
|
|||||
|
 | |
| |
| |
| |
| |
| |
|
Gene: CAST |
Gene summary for CAST |
| Gene information | Species | Human | Gene symbol | CAST | Gene ID | 831 |
| Gene name | calpastatin | |
| Gene Alias | BS-17 | |
| Cytomap | 5q15 | |
| Gene Type | protein-coding | GO ID | GO:0006508 | UniProtAcc | P20810 |
Top |
Malignant transformation analysis |
| Identification of the aberrant gene expression in precancerous and cancerous lesions by comparing the gene expression of stem-like cells in diseased tissues with normal stem cells |
| Entrez ID | Symbol | Replicates | Species | Organ | Tissue | Adj P-value | Log2FC | Malignancy |
| 831 | CAST | GSM4909286 | Human | Breast | IDC | 1.48e-06 | -2.56e-01 | 0.1081 |
| 831 | CAST | GSM4909290 | Human | Breast | IDC | 9.57e-07 | -4.24e-01 | 0.2096 |
| 831 | CAST | GSM4909291 | Human | Breast | IDC | 2.26e-07 | -4.62e-01 | 0.1753 |
| 831 | CAST | GSM4909294 | Human | Breast | IDC | 1.75e-03 | -1.35e-01 | 0.2022 |
| 831 | CAST | GSM4909296 | Human | Breast | IDC | 1.50e-15 | -4.25e-01 | 0.1524 |
| 831 | CAST | GSM4909297 | Human | Breast | IDC | 3.47e-15 | -3.14e-01 | 0.1517 |
| 831 | CAST | GSM4909302 | Human | Breast | IDC | 2.70e-03 | -2.60e-01 | 0.1545 |
| 831 | CAST | GSM4909307 | Human | Breast | IDC | 7.93e-32 | 6.51e-01 | 0.1569 |
| 831 | CAST | GSM4909308 | Human | Breast | IDC | 7.05e-23 | 6.02e-01 | 0.158 |
| 831 | CAST | GSM4909309 | Human | Breast | IDC | 4.59e-02 | -1.86e-01 | 0.0483 |
| 831 | CAST | GSM4909311 | Human | Breast | IDC | 1.01e-33 | -4.77e-01 | 0.1534 |
| 831 | CAST | GSM4909312 | Human | Breast | IDC | 2.53e-14 | -4.31e-01 | 0.1552 |
| 831 | CAST | GSM4909316 | Human | Breast | IDC | 2.38e-03 | -3.74e-01 | 0.21 |
| 831 | CAST | GSM4909319 | Human | Breast | IDC | 5.02e-39 | -5.29e-01 | 0.1563 |
| 831 | CAST | GSM4909320 | Human | Breast | IDC | 2.00e-08 | -4.44e-01 | 0.1575 |
| 831 | CAST | GSM4909321 | Human | Breast | IDC | 1.27e-15 | -3.43e-01 | 0.1559 |
| 831 | CAST | brca1 | Human | Breast | Precancer | 1.41e-02 | 3.15e-01 | -0.0338 |
| 831 | CAST | brca2 | Human | Breast | Precancer | 4.64e-04 | 2.27e-01 | -0.024 |
| 831 | CAST | brca3 | Human | Breast | Precancer | 8.03e-04 | 2.86e-01 | -0.0263 |
| 831 | CAST | NCCBC14 | Human | Breast | DCIS | 9.21e-13 | -1.47e-01 | 0.2021 |
| Page: 1 2 3 4 5 6 7 8 9 10 11 12 13 14 |
| Tissue | Expression Dynamics | Abbreviation |
| Breast | 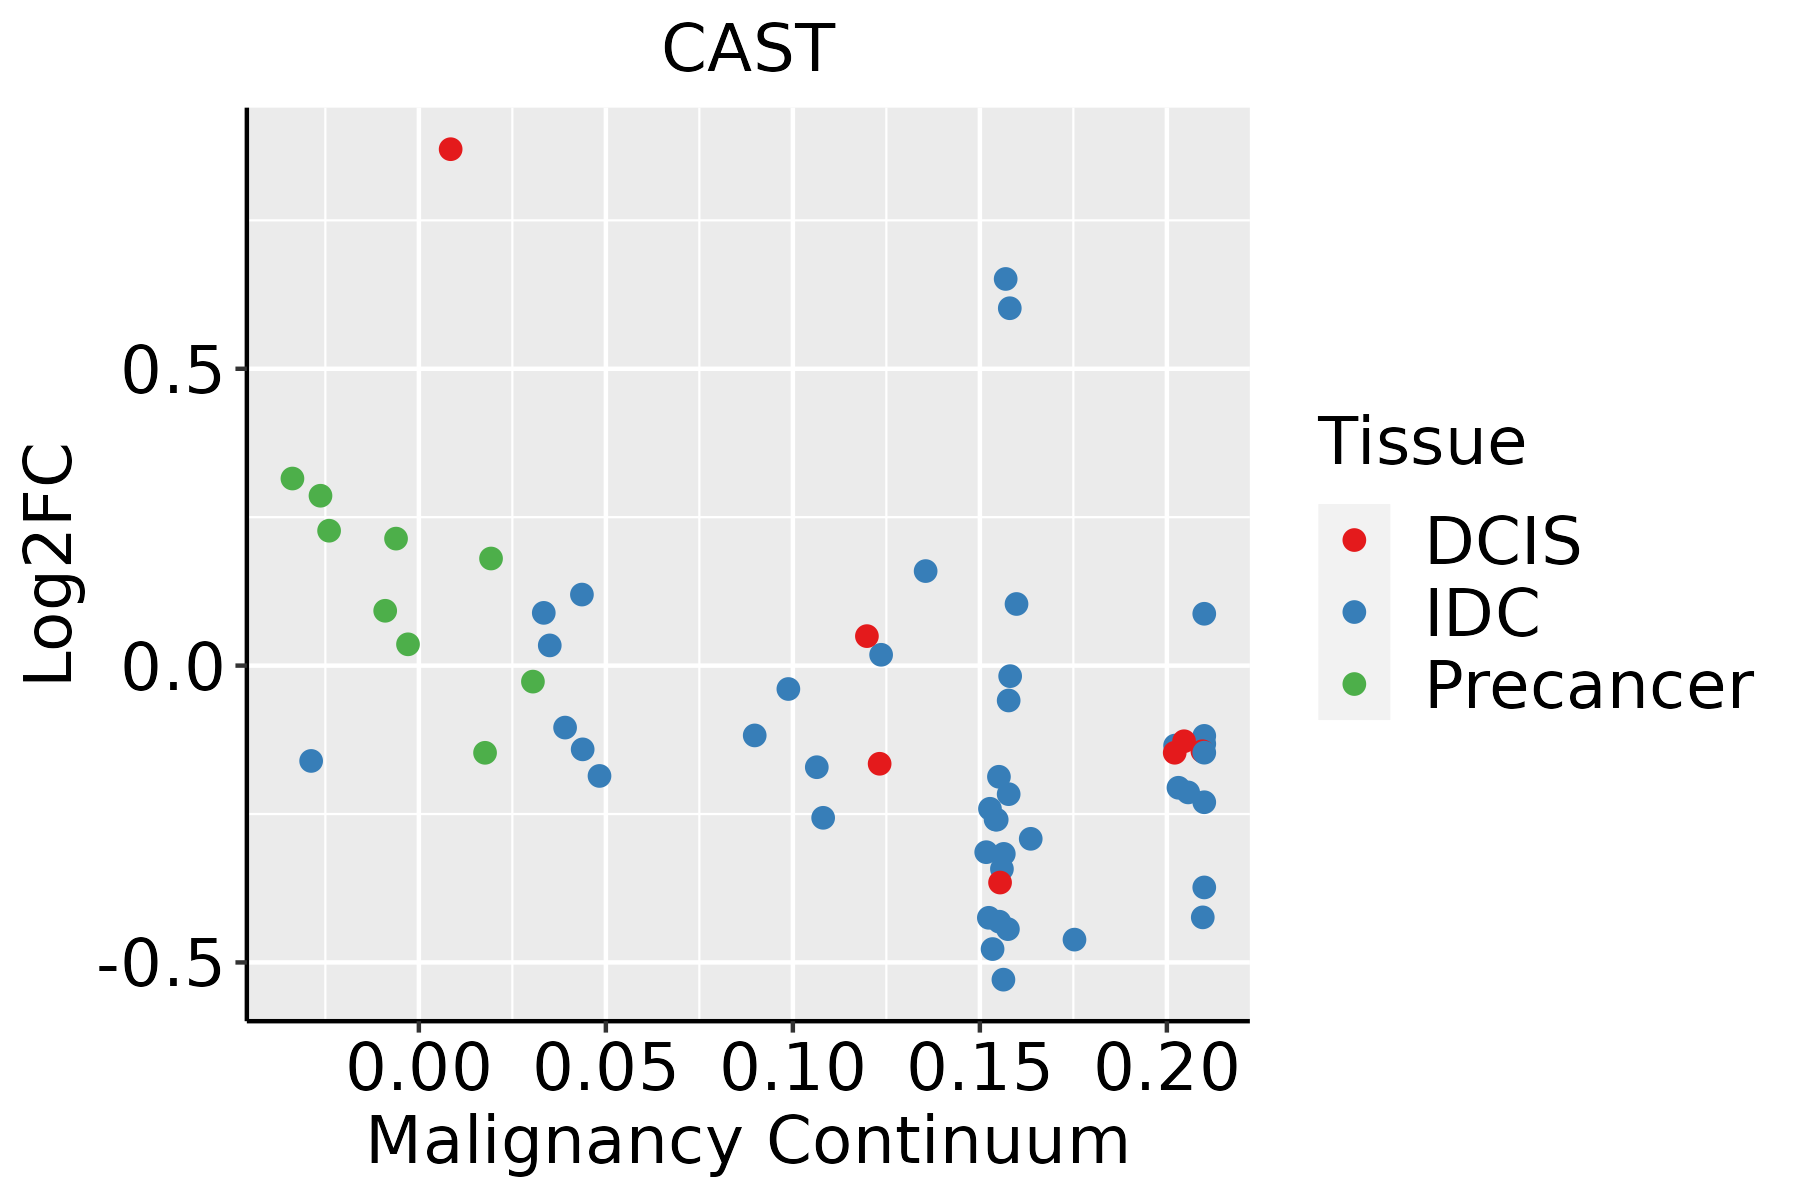 | IDC: Invasive ductal carcinoma |
| DCIS: Ductal carcinoma in situ | ||
| Precancer(BRCA1-mut): Precancerous lesion from BRCA1 mutation carriers | ||
| Colorectum (GSE201348) |  | FAP: Familial adenomatous polyposis |
| CRC: Colorectal cancer | ||
| Colorectum (HTA11) |  | AD: Adenomas |
| SER: Sessile serrated lesions | ||
| MSI-H: Microsatellite-high colorectal cancer | ||
| MSS: Microsatellite stable colorectal cancer | ||
| Endometrium | 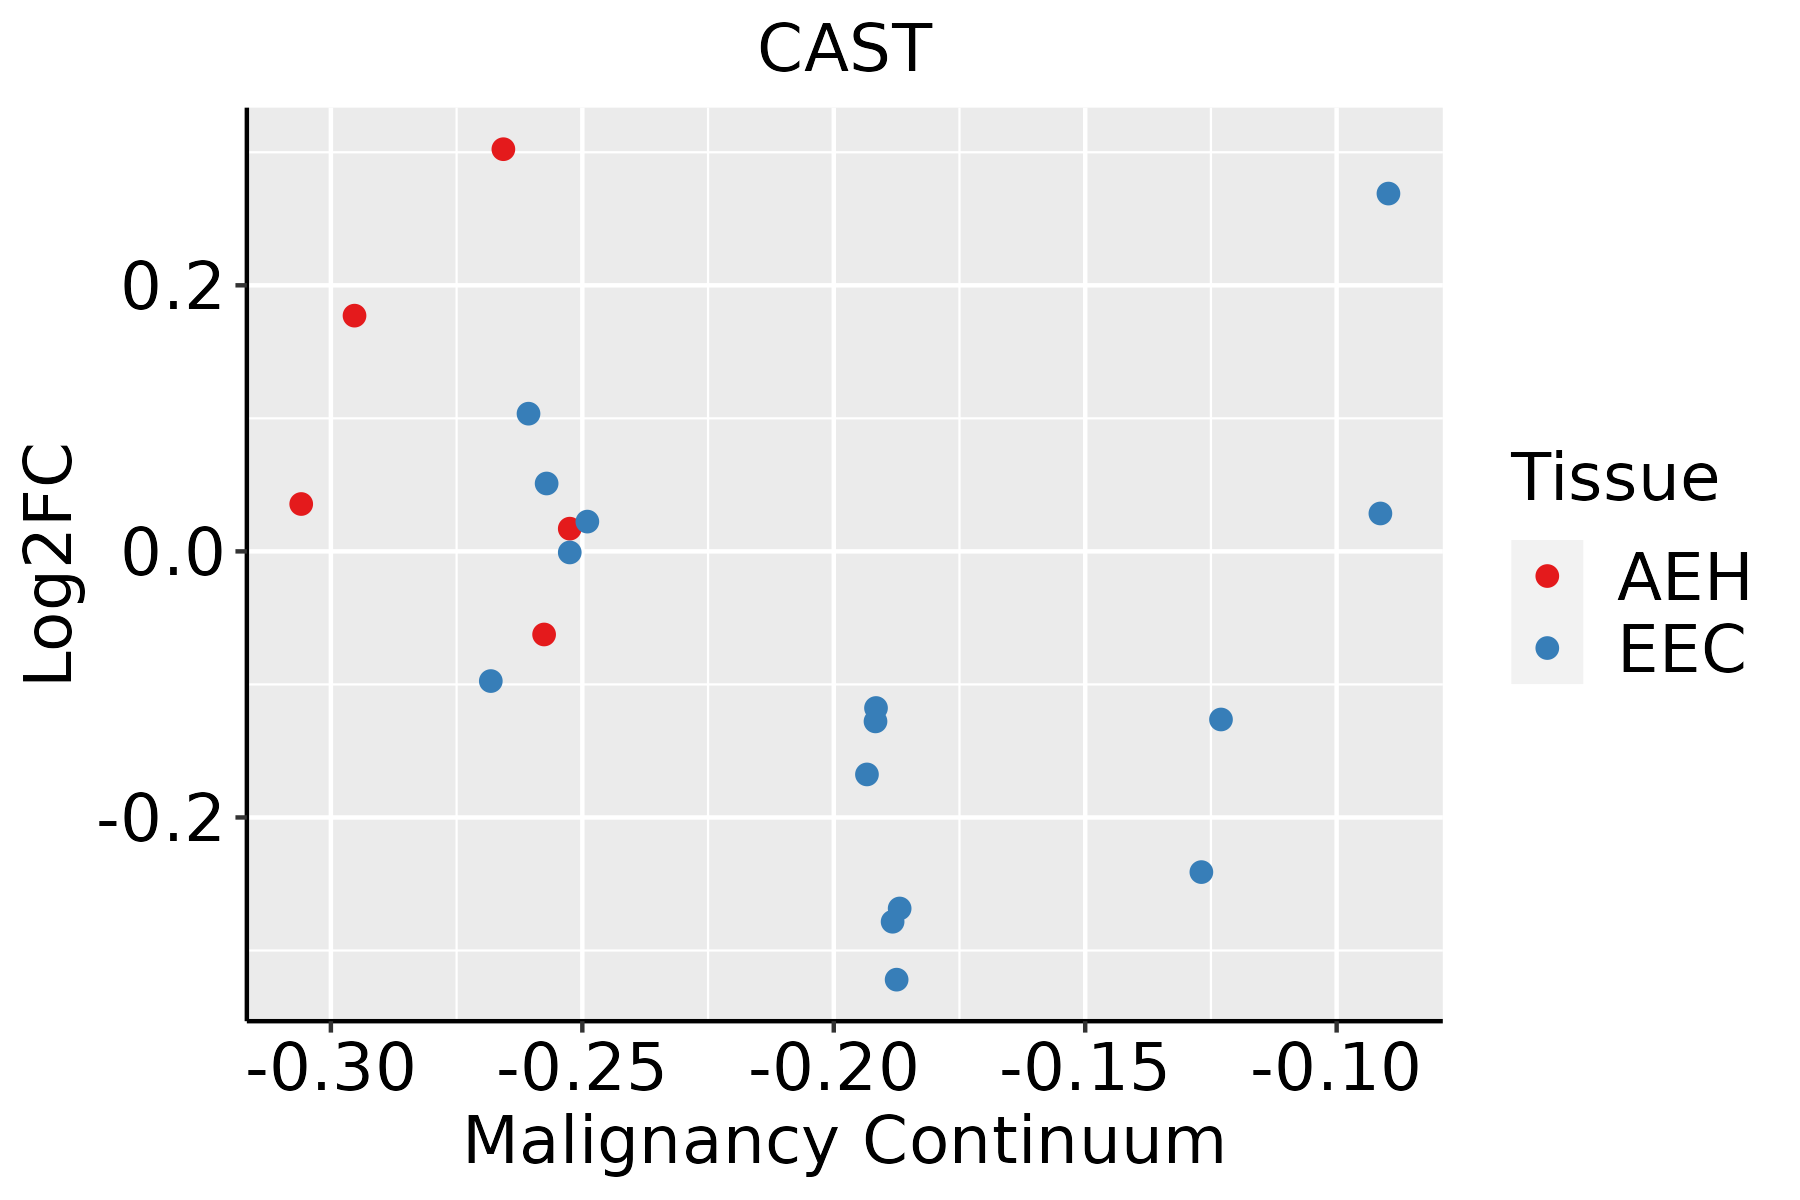 | AEH: Atypical endometrial hyperplasia |
| EEC: Endometrioid Cancer | ||
| Esophagus |  | ESCC: Esophageal squamous cell carcinoma |
| HGIN: High-grade intraepithelial neoplasias | ||
| LGIN: Low-grade intraepithelial neoplasias | ||
| GC |  | CAG: Chronic atrophic gastritis |
| CAG with IM: Chronic atrophic gastritis with intestinal metaplasia | ||
| CSG: Chronic superficial gastritis | ||
| GC: Gastric cancer | ||
| SIM: Severe intestinal metaplasia | ||
| WIM: Wild intestinal metaplasia | ||
| Liver | 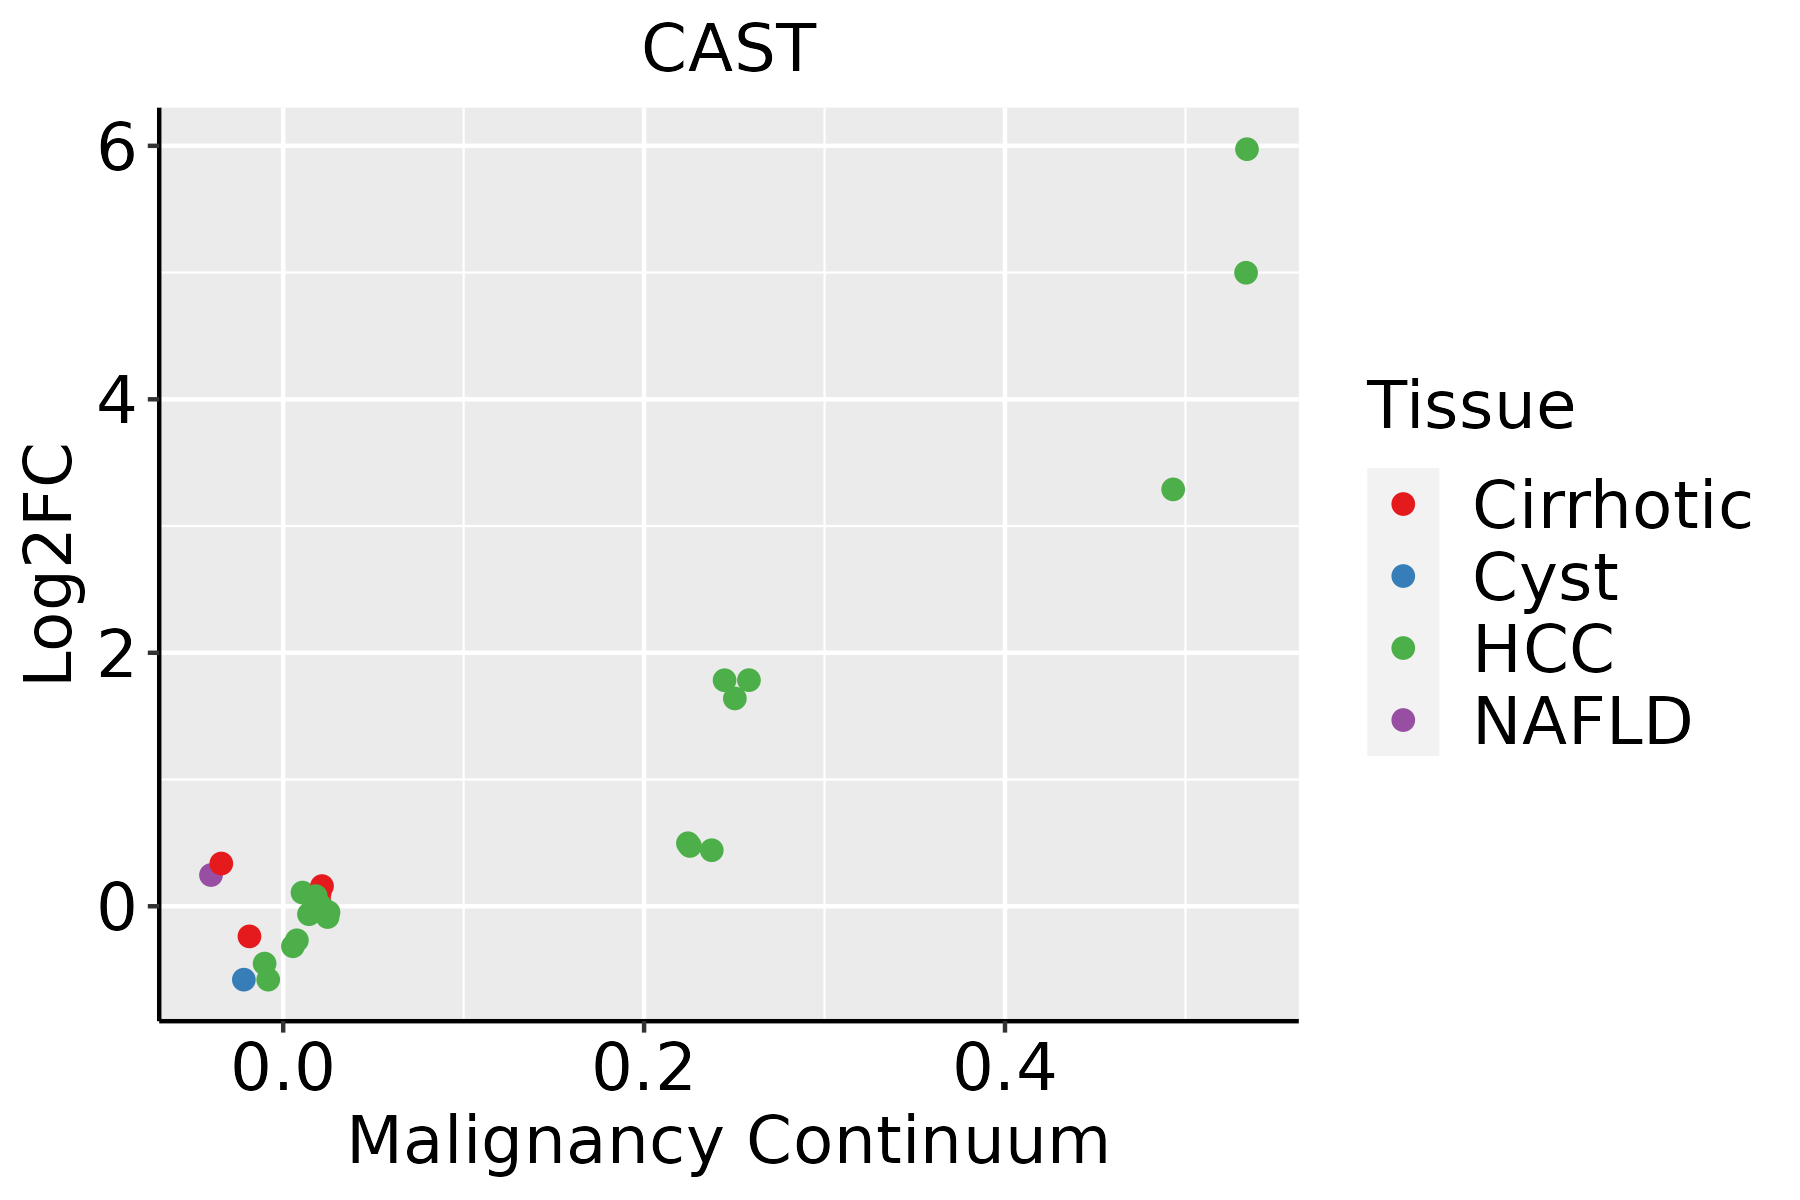 | HCC: Hepatocellular carcinoma |
| NAFLD: Non-alcoholic fatty liver disease | ||
| Lung | 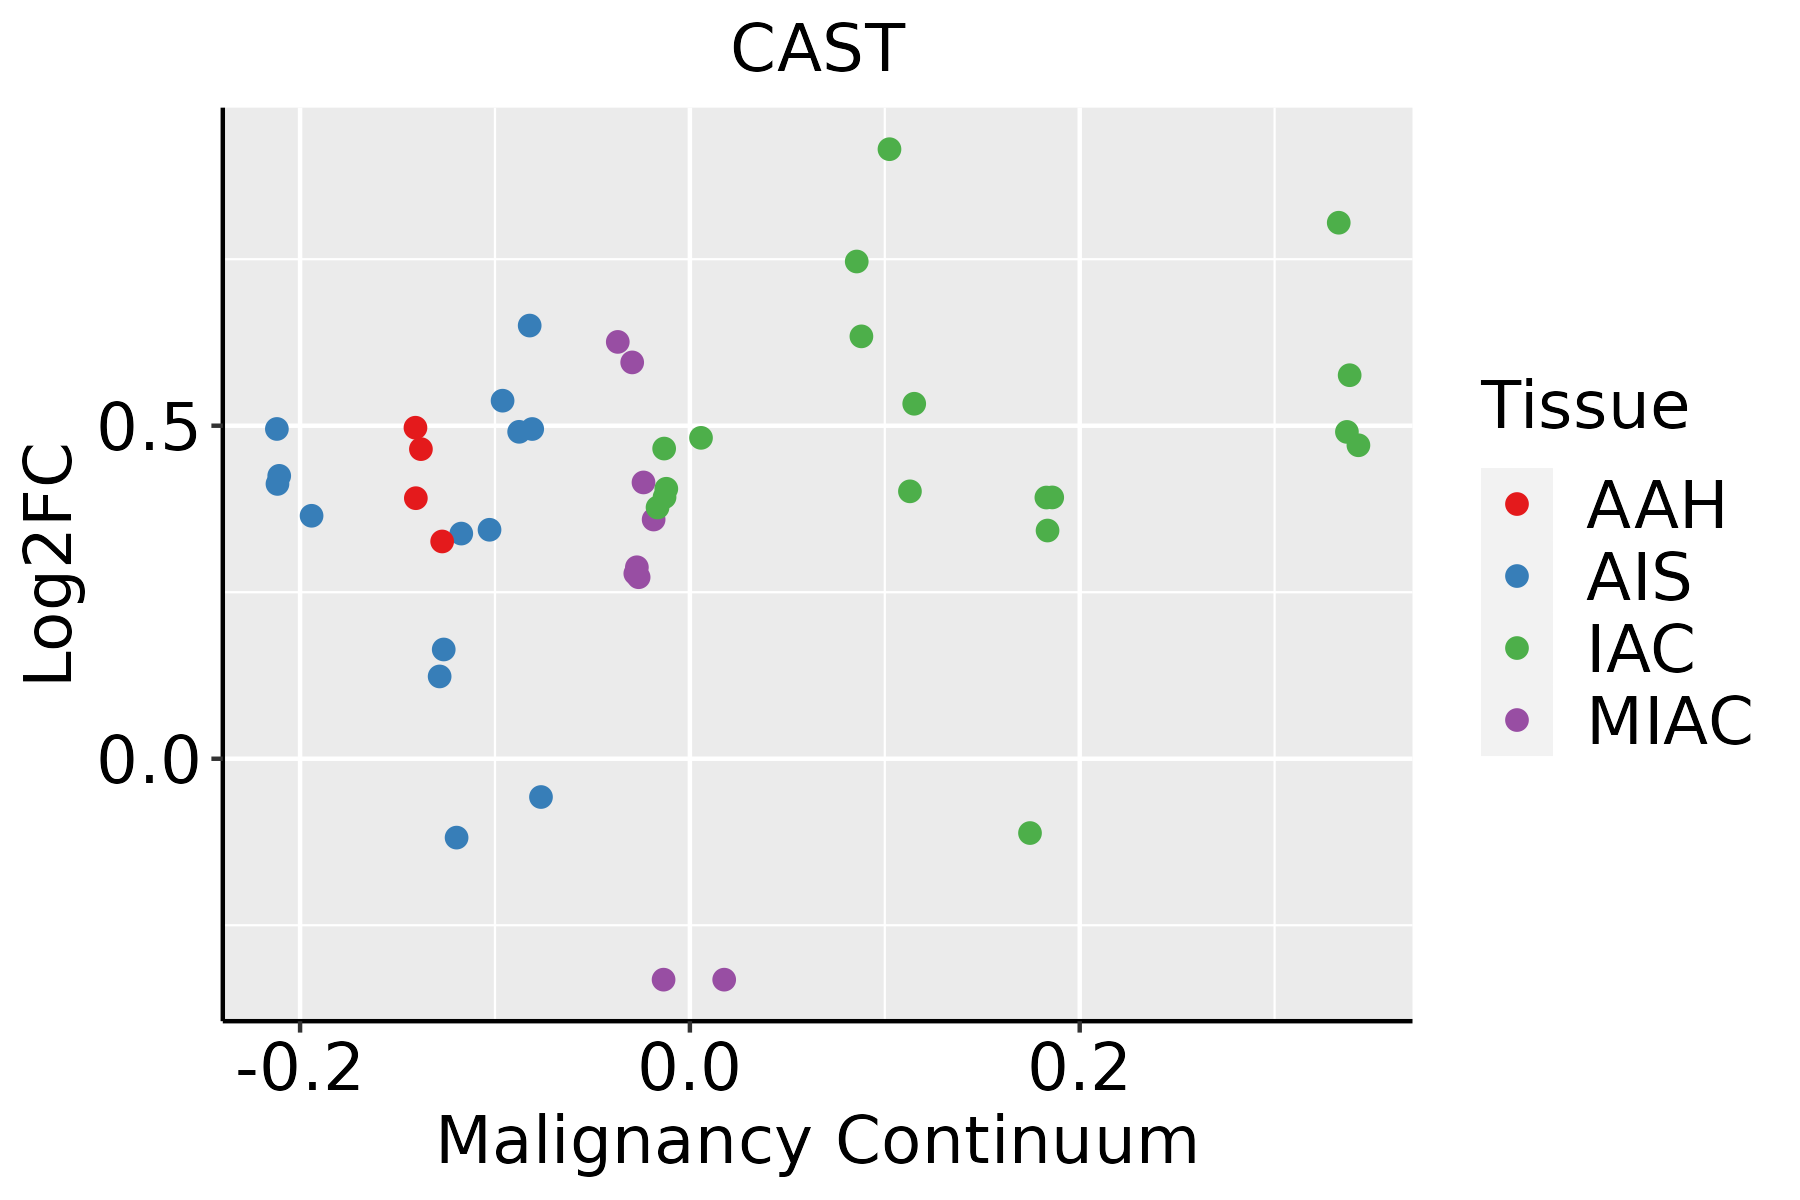 | AAH: Atypical adenomatous hyperplasia |
| AIS: Adenocarcinoma in situ | ||
| IAC: Invasive lung adenocarcinoma | ||
| MIA: Minimally invasive adenocarcinoma | ||
| Oral Cavity | 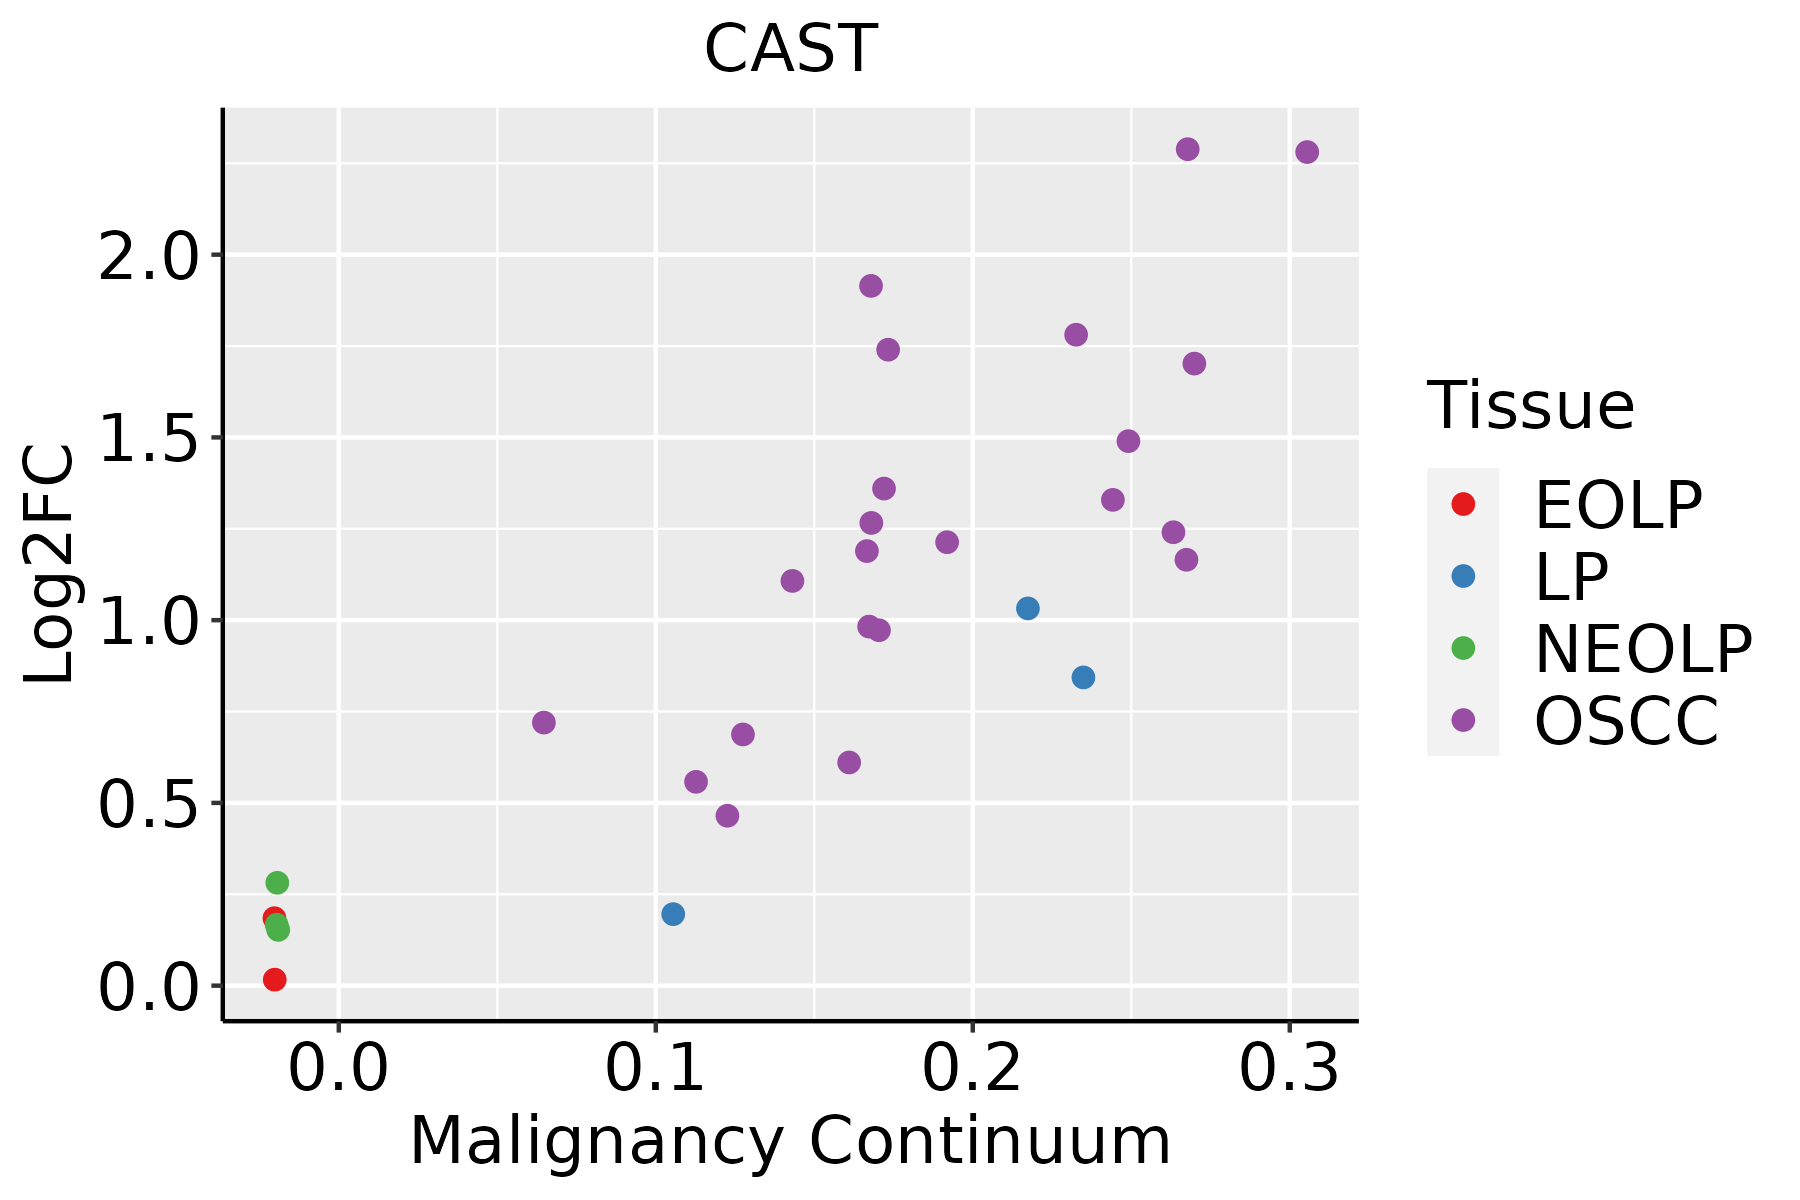 | EOLP: Erosive Oral lichen planus |
| LP: leukoplakia | ||
| NEOLP: Non-erosive oral lichen planus | ||
| OSCC: Oral squamous cell carcinoma | ||
| Prostate |  | BPH: Benign Prostatic Hyperplasia |
| Skin | 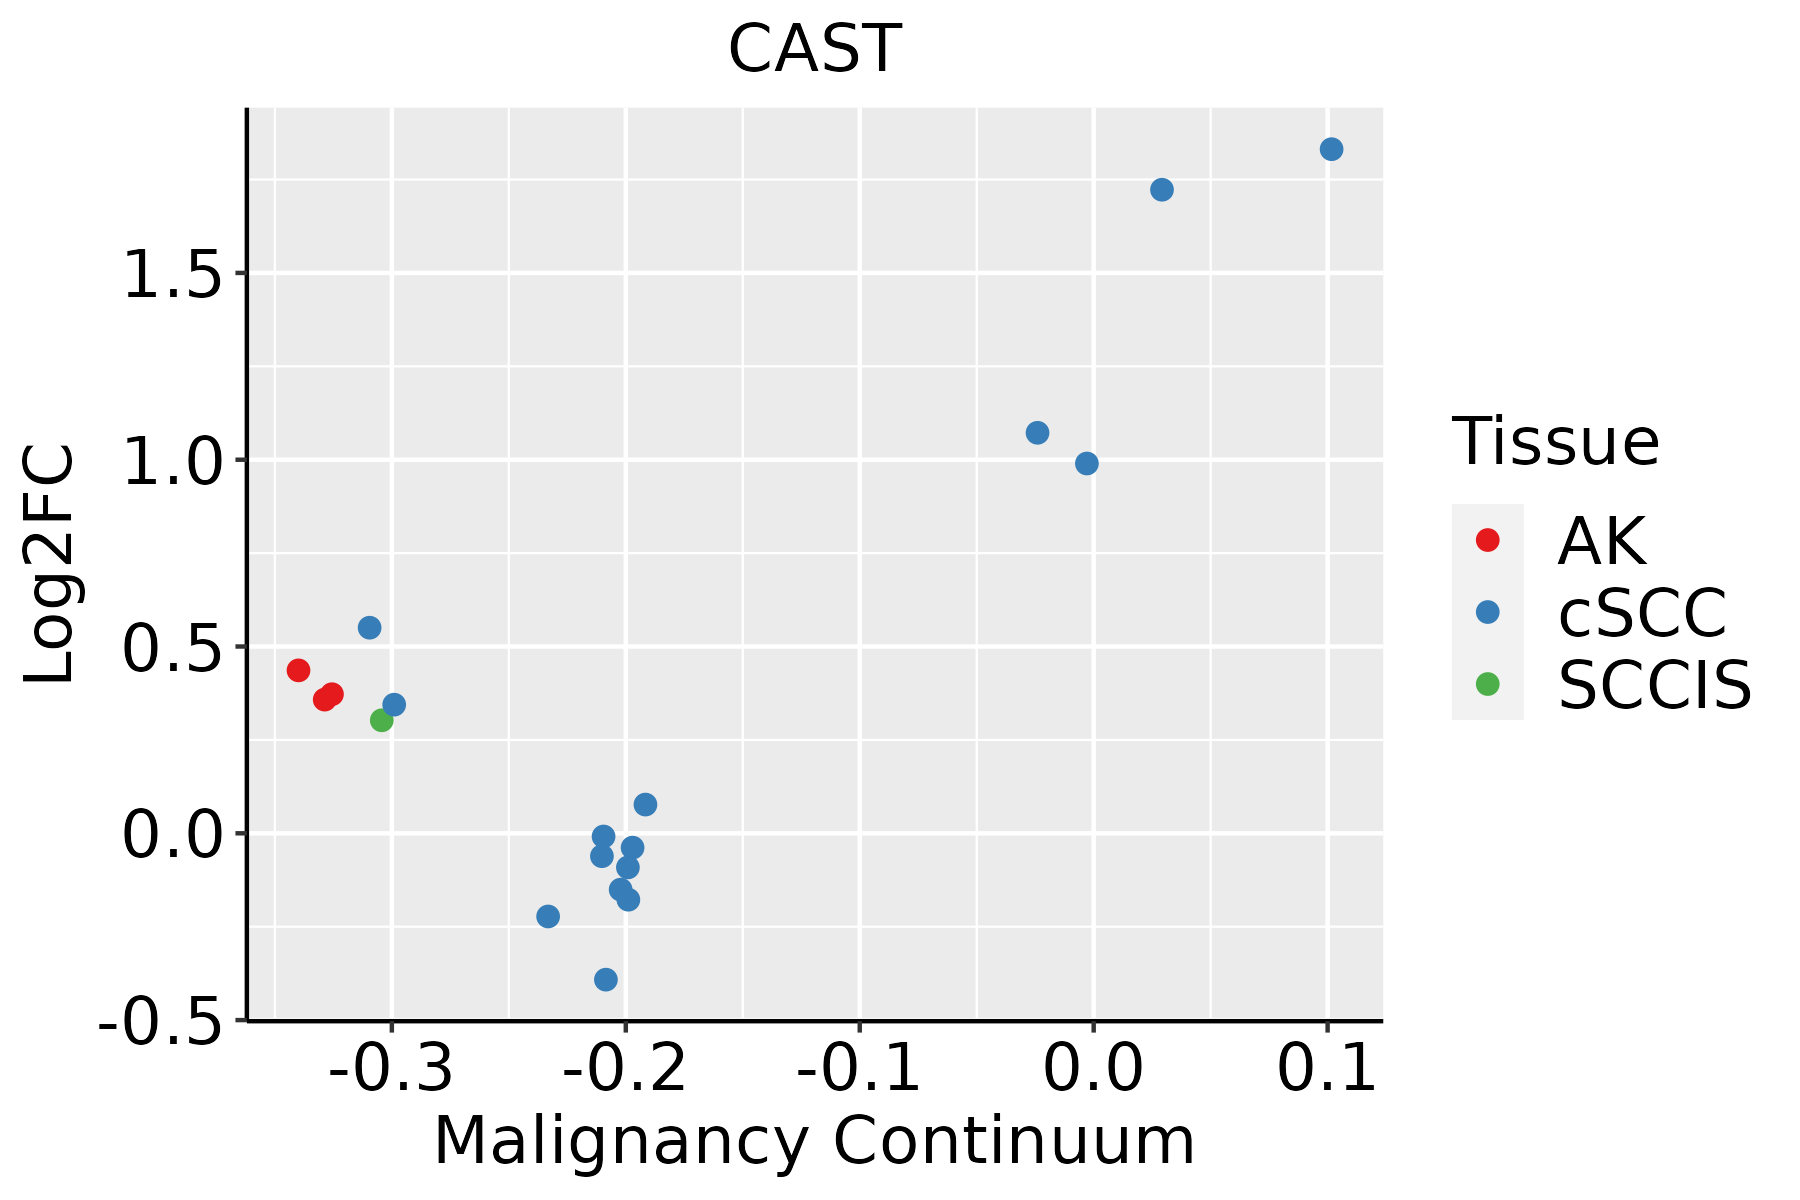 | AK: Actinic keratosis |
| cSCC: Cutaneous squamous cell carcinoma | ||
| SCCIS:squamous cell carcinoma in situ | ||
| Thyroid | 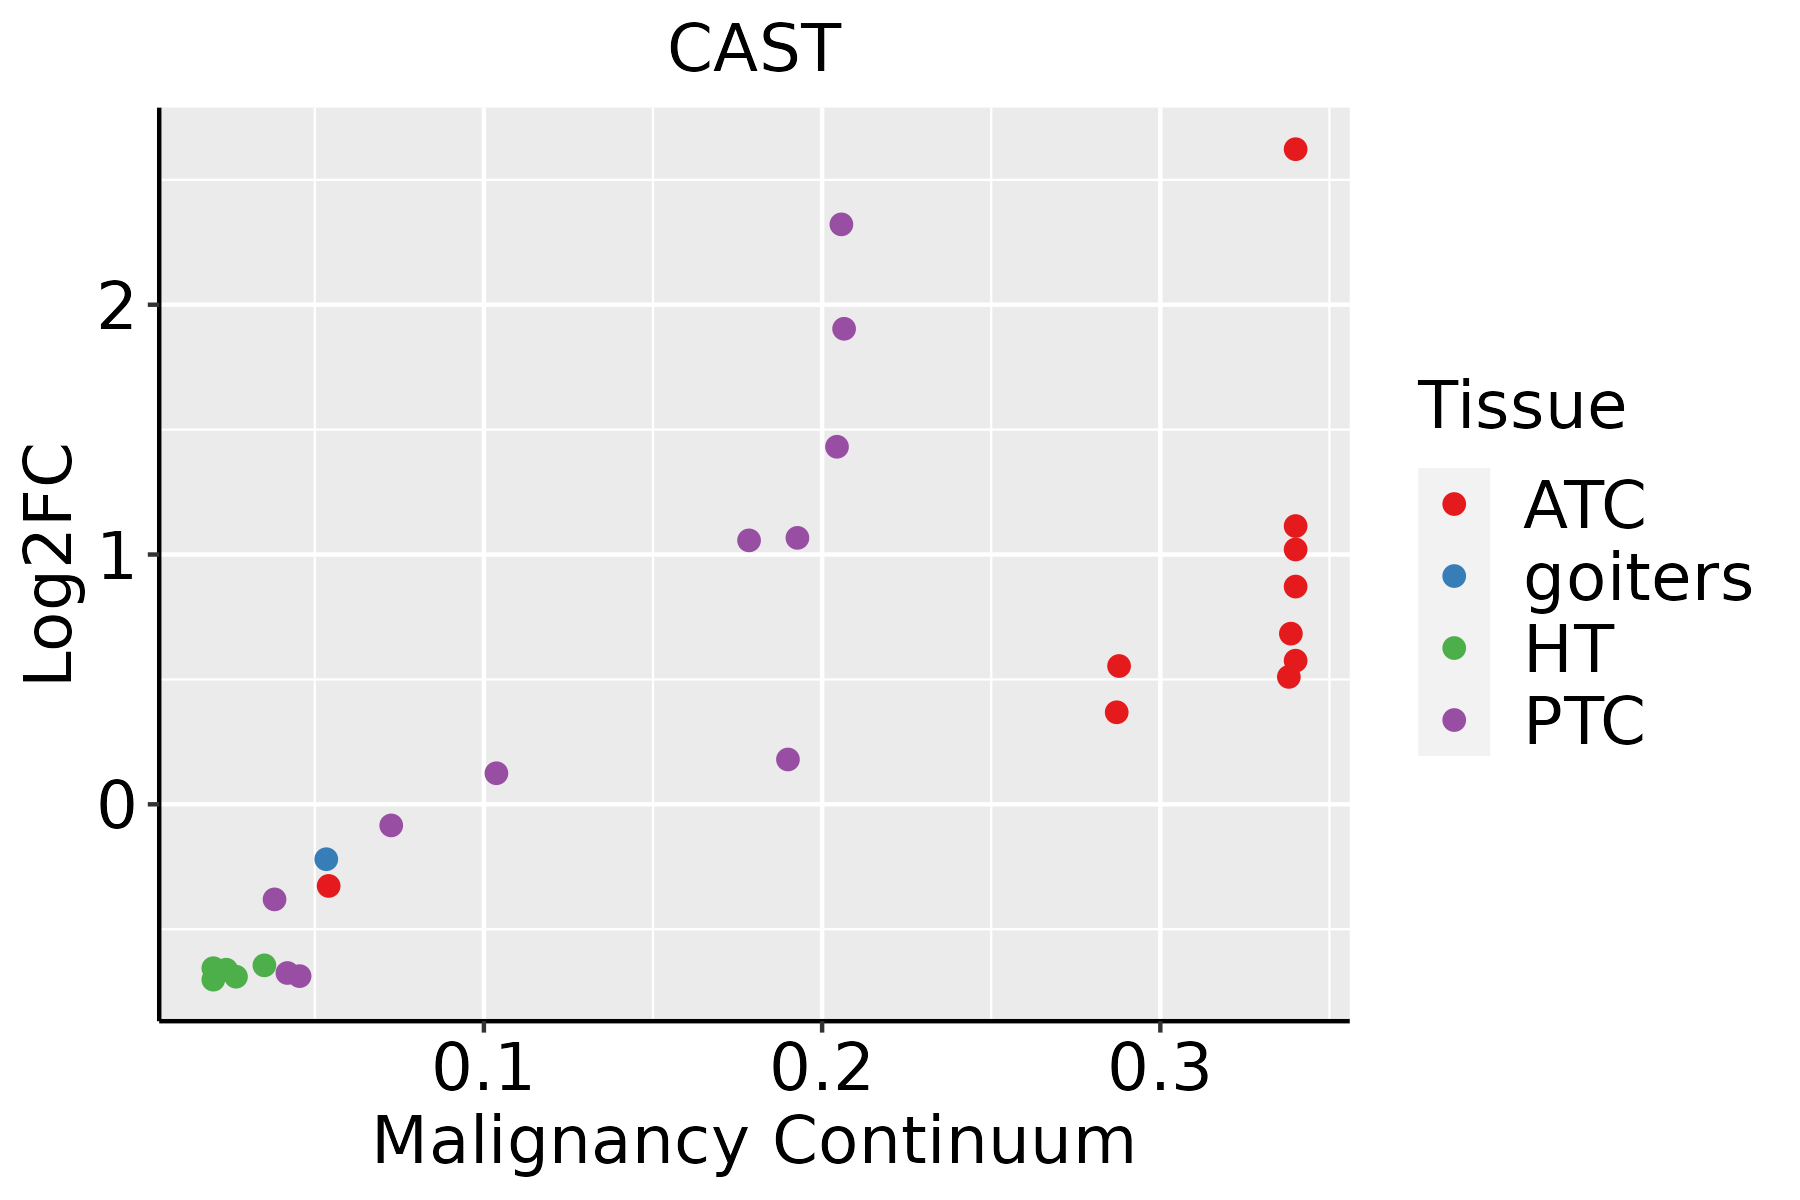 | ATC: Anaplastic thyroid cancer |
| HT: Hashimoto's thyroiditis | ||
| PTC: Papillary thyroid cancer |
| ∗log2FC in expression of this searched gene in stem-like cells from each diseased tissue sample relative to stem-like cells in normal samples in each tissue plotted against the malignancy continuum. Samples are colored based on if they are from different disease stage. |
Top |
Malignant transformation related pathway analysis |
| Find out the enriched GO biological processes and KEGG pathways involved in transition from healthy to precancer to cancer |
| Tissue | Disease Stage | Enriched GO biological Processes |
| Colorectum | AD |  |
| Colorectum | SER |  |
| Colorectum | MSS |  |
| Colorectum | MSI-H |  |
| Colorectum | FAP |  |
| ∗Top 15 enriched GO BP terms are showed in the bar plot of each disease state in each tissue. Each row represents a significant GO biological process which is colored according to the -log10(p.adjust). |
| Page: 1 2 3 4 5 6 7 8 9 |
| GO ID | Tissue | Disease Stage | Description | Gene Ratio | Bg Ratio | pvalue | p.adjust | Count |
| GO:00525479 | Breast | Precancer | regulation of peptidase activity | 71/1080 | 461/18723 | 2.72e-14 | 6.94e-12 | 71 |
| GO:00525489 | Breast | Precancer | regulation of endopeptidase activity | 67/1080 | 432/18723 | 1.06e-13 | 2.36e-11 | 67 |
| GO:20001169 | Breast | Precancer | regulation of cysteine-type endopeptidase activity | 43/1080 | 235/18723 | 1.30e-11 | 1.83e-09 | 43 |
| GO:00458619 | Breast | Precancer | negative regulation of proteolysis | 50/1080 | 351/18723 | 2.99e-09 | 2.39e-07 | 50 |
| GO:00513468 | Breast | Precancer | negative regulation of hydrolase activity | 50/1080 | 379/18723 | 3.85e-08 | 2.34e-06 | 50 |
| GO:00104668 | Breast | Precancer | negative regulation of peptidase activity | 38/1080 | 262/18723 | 1.46e-07 | 7.82e-06 | 38 |
| GO:00109519 | Breast | Precancer | negative regulation of endopeptidase activity | 37/1080 | 252/18723 | 1.55e-07 | 8.05e-06 | 37 |
| GO:20001179 | Breast | Precancer | negative regulation of cysteine-type endopeptidase activity | 19/1080 | 86/18723 | 3.36e-07 | 1.58e-05 | 19 |
| GO:19040193 | Breast | Precancer | epithelial cell apoptotic process | 17/1080 | 121/18723 | 5.76e-04 | 7.28e-03 | 17 |
| GO:19040351 | Breast | Precancer | regulation of epithelial cell apoptotic process | 14/1080 | 96/18723 | 1.18e-03 | 1.28e-02 | 14 |
| GO:00516047 | Breast | Precancer | protein maturation | 28/1080 | 294/18723 | 6.45e-03 | 4.50e-02 | 28 |
| GO:005254714 | Breast | IDC | regulation of peptidase activity | 96/1434 | 461/18723 | 7.58e-20 | 6.15e-17 | 96 |
| GO:005254814 | Breast | IDC | regulation of endopeptidase activity | 88/1434 | 432/18723 | 1.20e-17 | 4.85e-15 | 88 |
| GO:200011614 | Breast | IDC | regulation of cysteine-type endopeptidase activity | 55/1434 | 235/18723 | 4.25e-14 | 1.21e-11 | 55 |
| GO:004586114 | Breast | IDC | negative regulation of proteolysis | 70/1434 | 351/18723 | 8.21e-14 | 2.22e-11 | 70 |
| GO:005134613 | Breast | IDC | negative regulation of hydrolase activity | 71/1434 | 379/18723 | 1.33e-12 | 2.90e-10 | 71 |
| GO:001046613 | Breast | IDC | negative regulation of peptidase activity | 56/1434 | 262/18723 | 1.39e-12 | 2.92e-10 | 56 |
| GO:001095112 | Breast | IDC | negative regulation of endopeptidase activity | 52/1434 | 252/18723 | 3.53e-11 | 5.57e-09 | 52 |
| GO:200011713 | Breast | IDC | negative regulation of cysteine-type endopeptidase activity | 25/1434 | 86/18723 | 3.31e-09 | 2.77e-07 | 25 |
| GO:005160413 | Breast | IDC | protein maturation | 35/1434 | 294/18723 | 6.18e-03 | 4.40e-02 | 35 |
| Page: 1 2 3 4 5 6 7 8 9 10 11 12 13 14 15 16 |
| Pathway ID | Tissue | Disease Stage | Description | Gene Ratio | Bg Ratio | pvalue | p.adjust | qvalue | Count |
| hsa0513118 | Breast | Precancer | Shigellosis | 44/684 | 247/8465 | 3.91e-07 | 6.86e-06 | 5.26e-06 | 44 |
| hsa0513119 | Breast | Precancer | Shigellosis | 44/684 | 247/8465 | 3.91e-07 | 6.86e-06 | 5.26e-06 | 44 |
| hsa0513124 | Breast | IDC | Shigellosis | 47/867 | 247/8465 | 1.78e-05 | 2.00e-04 | 1.49e-04 | 47 |
| hsa0513134 | Breast | IDC | Shigellosis | 47/867 | 247/8465 | 1.78e-05 | 2.00e-04 | 1.49e-04 | 47 |
| hsa0513144 | Breast | DCIS | Shigellosis | 46/846 | 247/8465 | 2.06e-05 | 2.38e-04 | 1.75e-04 | 46 |
| hsa0513154 | Breast | DCIS | Shigellosis | 46/846 | 247/8465 | 2.06e-05 | 2.38e-04 | 1.75e-04 | 46 |
| hsa05131 | Colorectum | AD | Shigellosis | 109/2092 | 247/8465 | 1.09e-11 | 2.44e-10 | 1.55e-10 | 109 |
| hsa051311 | Colorectum | AD | Shigellosis | 109/2092 | 247/8465 | 1.09e-11 | 2.44e-10 | 1.55e-10 | 109 |
| hsa051312 | Colorectum | SER | Shigellosis | 87/1580 | 247/8465 | 3.07e-10 | 7.27e-09 | 5.28e-09 | 87 |
| hsa051313 | Colorectum | SER | Shigellosis | 87/1580 | 247/8465 | 3.07e-10 | 7.27e-09 | 5.28e-09 | 87 |
| hsa051314 | Colorectum | MSS | Shigellosis | 94/1875 | 247/8465 | 6.82e-09 | 1.34e-07 | 8.23e-08 | 94 |
| hsa051315 | Colorectum | MSS | Shigellosis | 94/1875 | 247/8465 | 6.82e-09 | 1.34e-07 | 8.23e-08 | 94 |
| hsa051316 | Colorectum | MSI-H | Shigellosis | 40/797 | 247/8465 | 4.28e-04 | 5.34e-03 | 4.47e-03 | 40 |
| hsa051317 | Colorectum | MSI-H | Shigellosis | 40/797 | 247/8465 | 4.28e-04 | 5.34e-03 | 4.47e-03 | 40 |
| hsa051318 | Colorectum | FAP | Shigellosis | 76/1404 | 247/8465 | 1.57e-08 | 5.84e-07 | 3.55e-07 | 76 |
| hsa051319 | Colorectum | FAP | Shigellosis | 76/1404 | 247/8465 | 1.57e-08 | 5.84e-07 | 3.55e-07 | 76 |
| hsa0513110 | Colorectum | CRC | Shigellosis | 59/1091 | 247/8465 | 1.19e-06 | 5.41e-05 | 3.66e-05 | 59 |
| hsa0513111 | Colorectum | CRC | Shigellosis | 59/1091 | 247/8465 | 1.19e-06 | 5.41e-05 | 3.66e-05 | 59 |
| hsa0513126 | Endometrium | AEH | Shigellosis | 78/1197 | 247/8465 | 9.23e-13 | 2.00e-11 | 1.46e-11 | 78 |
| hsa05131111 | Endometrium | AEH | Shigellosis | 78/1197 | 247/8465 | 9.23e-13 | 2.00e-11 | 1.46e-11 | 78 |
| Page: 1 2 3 |
Top |
Cell-cell communication analysis |
| Identification of potential cell-cell interactions between two cell types and their ligand-receptor pairs for different disease states |
| Ligand | Receptor | LRpair | Pathway | Tissue | Disease Stage |
| Page: 1 |
Top |
Single-cell gene regulatory network inference analysis |
| Find out the significant the regulons (TFs) and the target genes of each regulon across cell types for different disease states |
| TF | Cell Type | Tissue | Disease Stage | Target Gene | RSS | Regulon Activity |
| ∗The dot plots of a searched regulon are shown for all cell subpopulations in each disease state of each tissue based on the regulon specific score inferred using pySCENIC and by calculating the average expression. |
| Page: 1 |
Top |
Somatic mutation of malignant transformation related genes |
| Annotation of somatic variants for genes involved in malignant transformation |
| Hugo Symbol | Variant Class | Variant Classification | dbSNP RS | HGVSc | HGVSp | HGVSp Short | SWISSPROT | BIOTYPE | SIFT | PolyPhen | Tumor Sample Barcode | Tissue | Histology | Sex | Age | Stage | Therapy Types | Drugs | Outcome |
| CAST | SNV | Missense_Mutation | rs145309877 | c.1232T>C | p.Ile411Thr | p.I411T | P20810 | protein_coding | deleterious(0.01) | possibly_damaging(0.823) | TCGA-3C-AALK-01 | Breast | breast invasive carcinoma | Female | <65 | I/II | Chemotherapy | docetaxel | SD |
| CAST | SNV | Missense_Mutation | novel | c.1102N>A | p.Glu368Lys | p.E368K | P20810 | protein_coding | tolerated(1) | benign(0.023) | TCGA-AC-A5XS-01 | Breast | breast invasive carcinoma | Female | >=65 | I/II | Hormone Therapy | femara | SD |
| CAST | SNV | Missense_Mutation | novel | c.1522G>C | p.Asp508His | p.D508H | P20810 | protein_coding | tolerated(0.1) | probably_damaging(0.967) | TCGA-BH-A2L8-01 | Breast | breast invasive carcinoma | Female | <65 | I/II | Chemotherapy | cytoxan | CR |
| CAST | SNV | Missense_Mutation | c.1363T>A | p.Cys455Ser | p.C455S | P20810 | protein_coding | tolerated(0.13) | probably_damaging(0.998) | TCGA-C8-A12Y-01 | Breast | breast invasive carcinoma | Female | <65 | I/II | Unknown | Unknown | SD | |
| CAST | SNV | Missense_Mutation | rs369732336 | c.925N>T | p.Thr309Ser | p.T309S | P20810 | protein_coding | tolerated(0.44) | benign(0.029) | TCGA-E2-A15O-01 | Breast | breast invasive carcinoma | Female | >=65 | I/II | Hormone Therapy | arimidex | PD |
| CAST | SNV | Missense_Mutation | novel | c.1417N>T | p.Asp473Tyr | p.D473Y | P20810 | protein_coding | deleterious(0) | probably_damaging(0.926) | TCGA-GM-A2DB-01 | Breast | breast invasive carcinoma | Female | <65 | I/II | Chemotherapy | taxol | CR |
| CAST | insertion | Frame_Shift_Ins | novel | c.1688_1689insAAGGCAAAAGTCAGTCATGAGGGAAACAGGTGATCCAAGT | p.Pro564ArgfsTer21 | p.P564Rfs*21 | P20810 | protein_coding | TCGA-B6-A0IE-01 | Breast | breast invasive carcinoma | Female | <65 | III/IV | Unknown | Unknown | PD | ||
| CAST | SNV | Missense_Mutation | novel | c.408G>T | p.Glu136Asp | p.E136D | P20810 | protein_coding | tolerated(0.09) | possibly_damaging(0.547) | TCGA-2W-A8YY-01 | Cervix | cervical & endocervical cancer | Female | <65 | I/II | Chemotherapy | cisplatin | CR |
| CAST | SNV | Missense_Mutation | c.488C>T | p.Ser163Phe | p.S163F | P20810 | protein_coding | deleterious(0) | possibly_damaging(0.704) | TCGA-EK-A3GJ-01 | Cervix | cervical & endocervical cancer | Female | <65 | I/II | Unknown | Unknown | SD | |
| CAST | SNV | Missense_Mutation | novel | c.365N>C | p.Asn122Thr | p.N122T | P20810 | protein_coding | tolerated(0.34) | benign(0.117) | TCGA-AA-A00N-01 | Colorectum | colon adenocarcinoma | Male | >=65 | I/II | Unknown | Unknown | PD |
| Page: 1 2 3 4 5 6 |
Top |
Related drugs of malignant transformation related genes |
| Identification of chemicals and drugs interact with genes involved in malignant transfromation |
| (DGIdb 4.0) |
| Entrez ID | Symbol | Category | Interaction Types | Drug Claim Name | Drug Name | PMIDs |
| 831 | CAST | PROTEASE INHIBITOR | STAUROSPORINE | STAUROSPORINE | 12576481 | |
| 831 | CAST | PROTEASE INHIBITOR | ACE INHIBITOR | 11159730 | ||
| 831 | CAST | PROTEASE INHIBITOR | DHT | ANDROSTANOLONE | 12646165 | |
| 831 | CAST | PROTEASE INHIBITOR | 12-O-TETRADECANOYLPHORBOL-13-ACETATE | 1995645 | ||
| 831 | CAST | PROTEASE INHIBITOR | DOX | 12650523 | ||
| 831 | CAST | PROTEASE INHIBITOR | THROMBIN | THROMBIN | 8358337 | |
| 831 | CAST | PROTEASE INHIBITOR | EPINEPHRINE | EPINEPHRINE | 10863002 |
| Page: 1 |

Copyright 2023-Present -The University of Texas Health Science Center at Houston |