Schematic overview of the cellular and molecular mechanisms involved in the cancer progression, including the proposed cellular and molecular mechanisms in cancer cells trajectory. AT1: alveolar type 1 cells; AT2: alveolar type 2 cells; AAH: atypical adenomatous hyperplasia; AIS: adenocarcinoma in situ; MIA: minimally invasive adenocarcinoma; IA: invasive adenocarcinoma; EMT: epithelial-mesenchymal transition

Home

Download

Statistics

Help

Contact

Center for Computational Systems Medicine
leaf

Gene summary

leaf

Malignant transformation analysis

leaf

Malignant transformation related pathway analysis

leaf

Cell-cell communication analysis

leaf

Single-cell gene regulatory network inference analysis

leaf

Somatic mutation of malignant transformation related genes

leaf

Related drugs of malignant transformation related genes

Gene: CASP8AP2

Gene summary for CASP8AP2

check button Gene summary.

Gene informationSpeciesHuman
Gene symbol

CASP8AP2

Gene ID

9994

Gene namecaspase 8 associated protein 2
Gene AliasCED-4
Cytomap6q15
Gene Typeprotein-coding
GO ID

GO:0006139

UniProtAcc

Q9UKL3


Top

Malignant transformation analysis

check button Identification of the aberrant gene expression in precancerous and cancerous lesions by comparing the gene expression of stem-like cells in diseased tissues with normal stem cells
check button Malignant transformation involving gene list.
Entrez IDSymbolReplicatesSpeciesOrganTissueAdj P-valueLog2FCMalignancy
9994CASP8AP2LZE4THumanEsophagusESCC4.77e-113.63e-010.0811
9994CASP8AP2LZE7THumanEsophagusESCC3.56e-075.43e-010.0667
9994CASP8AP2LZE24THumanEsophagusESCC1.23e-031.97e-010.0596
9994CASP8AP2P1T-EHumanEsophagusESCC4.85e-062.60e-010.0875
9994CASP8AP2P2T-EHumanEsophagusESCC2.58e-245.21e-010.1177
9994CASP8AP2P4T-EHumanEsophagusESCC6.06e-123.97e-010.1323
9994CASP8AP2P5T-EHumanEsophagusESCC1.23e-173.16e-010.1327
9994CASP8AP2P8T-EHumanEsophagusESCC2.46e-173.26e-010.0889
9994CASP8AP2P9T-EHumanEsophagusESCC8.82e-041.14e-010.1131
9994CASP8AP2P10T-EHumanEsophagusESCC3.42e-133.01e-010.116
9994CASP8AP2P11T-EHumanEsophagusESCC3.72e-105.15e-010.1426
9994CASP8AP2P12T-EHumanEsophagusESCC8.82e-183.39e-010.1122
9994CASP8AP2P15T-EHumanEsophagusESCC3.34e-072.75e-010.1149
9994CASP8AP2P16T-EHumanEsophagusESCC1.88e-235.25e-010.1153
9994CASP8AP2P20T-EHumanEsophagusESCC3.66e-072.21e-010.1124
9994CASP8AP2P21T-EHumanEsophagusESCC6.96e-194.50e-010.1617
9994CASP8AP2P22T-EHumanEsophagusESCC3.29e-212.33e-010.1236
9994CASP8AP2P23T-EHumanEsophagusESCC5.01e-072.55e-010.108
9994CASP8AP2P24T-EHumanEsophagusESCC1.02e-122.71e-010.1287
9994CASP8AP2P26T-EHumanEsophagusESCC3.22e-082.43e-010.1276
Page: 1 2 3 4 5 

check button Transcriptomic changes along malignancy continuum.
TissueExpression DynamicsAbbreviation
EsophagusThe image shows the transcriptomic changes along malignancy continuum.log2FC in expression of this searched gene in stem-like cells from each diseased tissue sample relative to stem-like cells in normal samples in each tissue plotted against the malignancy continuum. Samples are colored based on if they are from different disease stage.
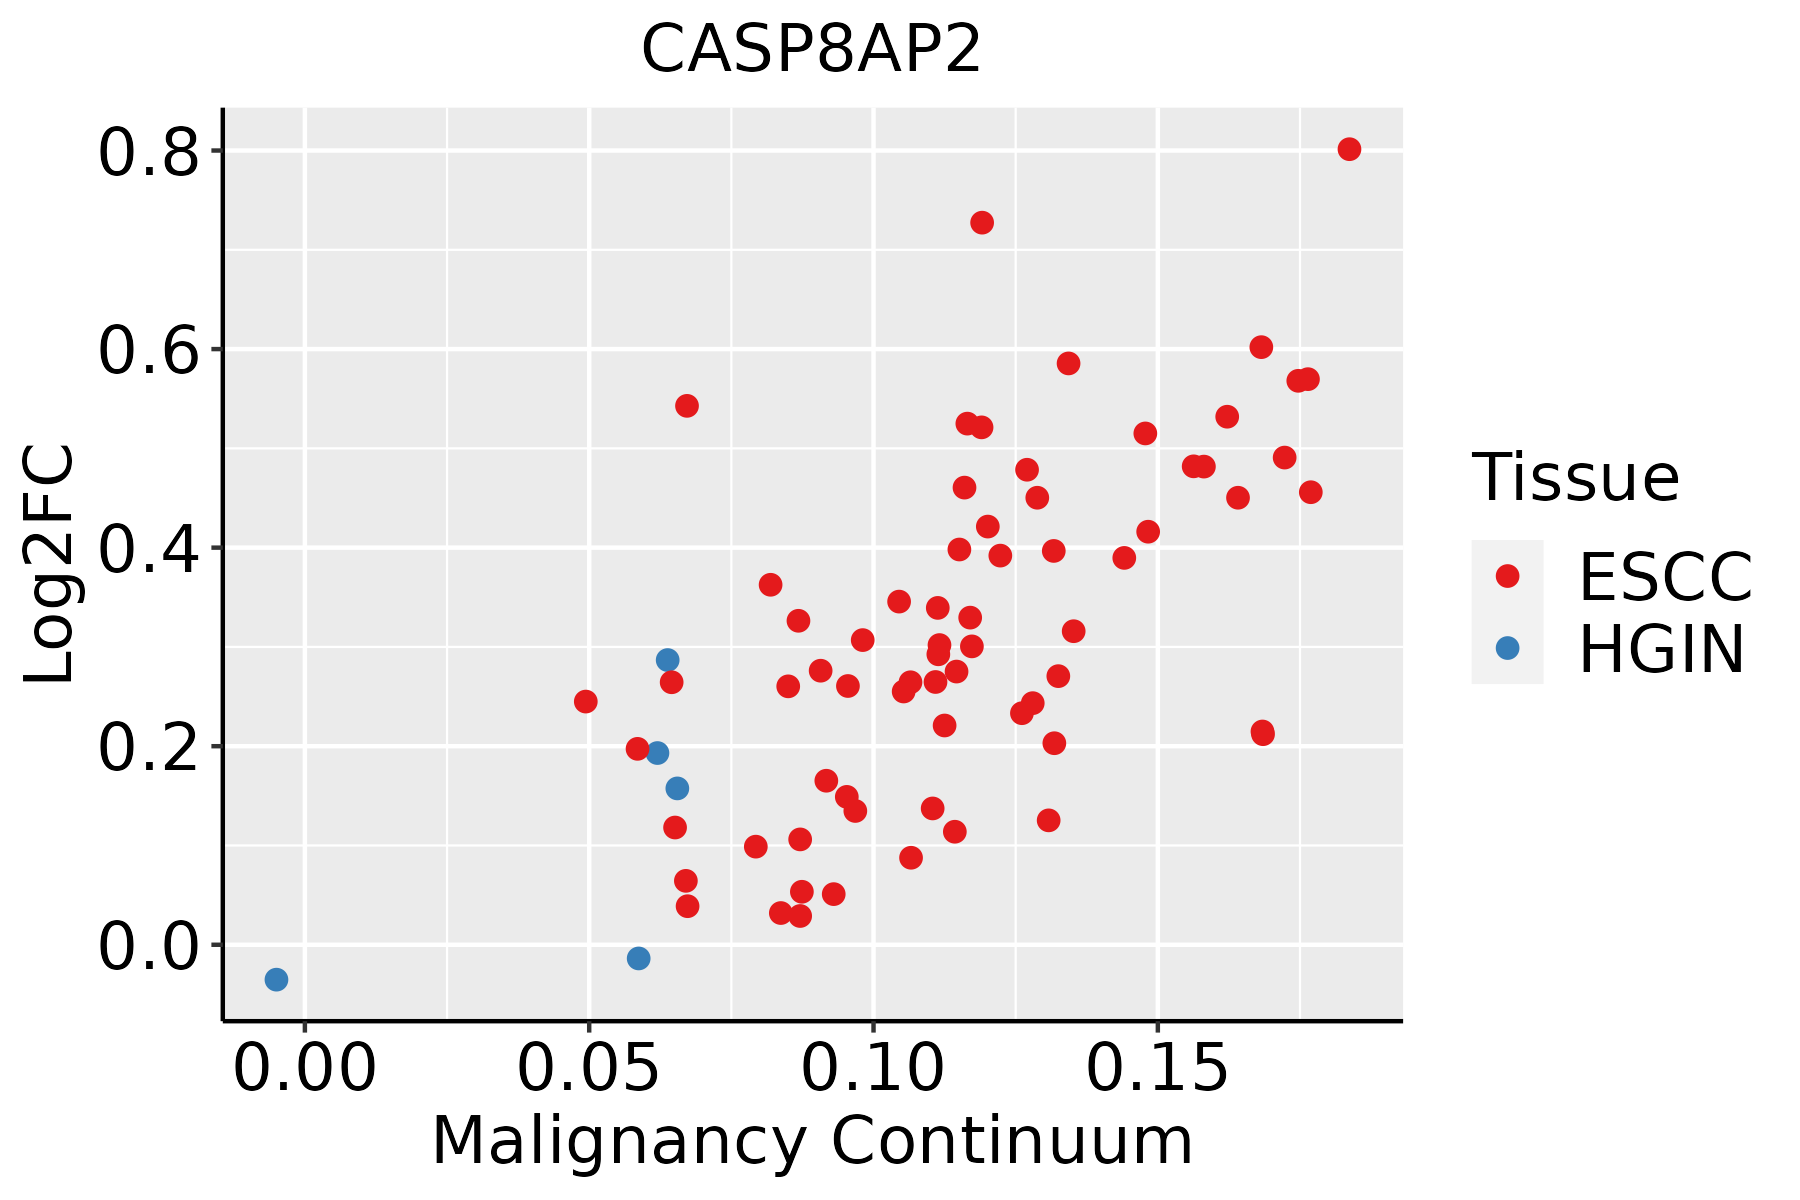
ESCC: Esophageal squamous cell carcinoma
HGIN: High-grade intraepithelial neoplasias
LGIN: Low-grade intraepithelial neoplasias
Oral CavityThe image shows the transcriptomic changes along malignancy continuum.log2FC in expression of this searched gene in stem-like cells from each diseased tissue sample relative to stem-like cells in normal samples in each tissue plotted against the malignancy continuum. Samples are colored based on if they are from different disease stage.
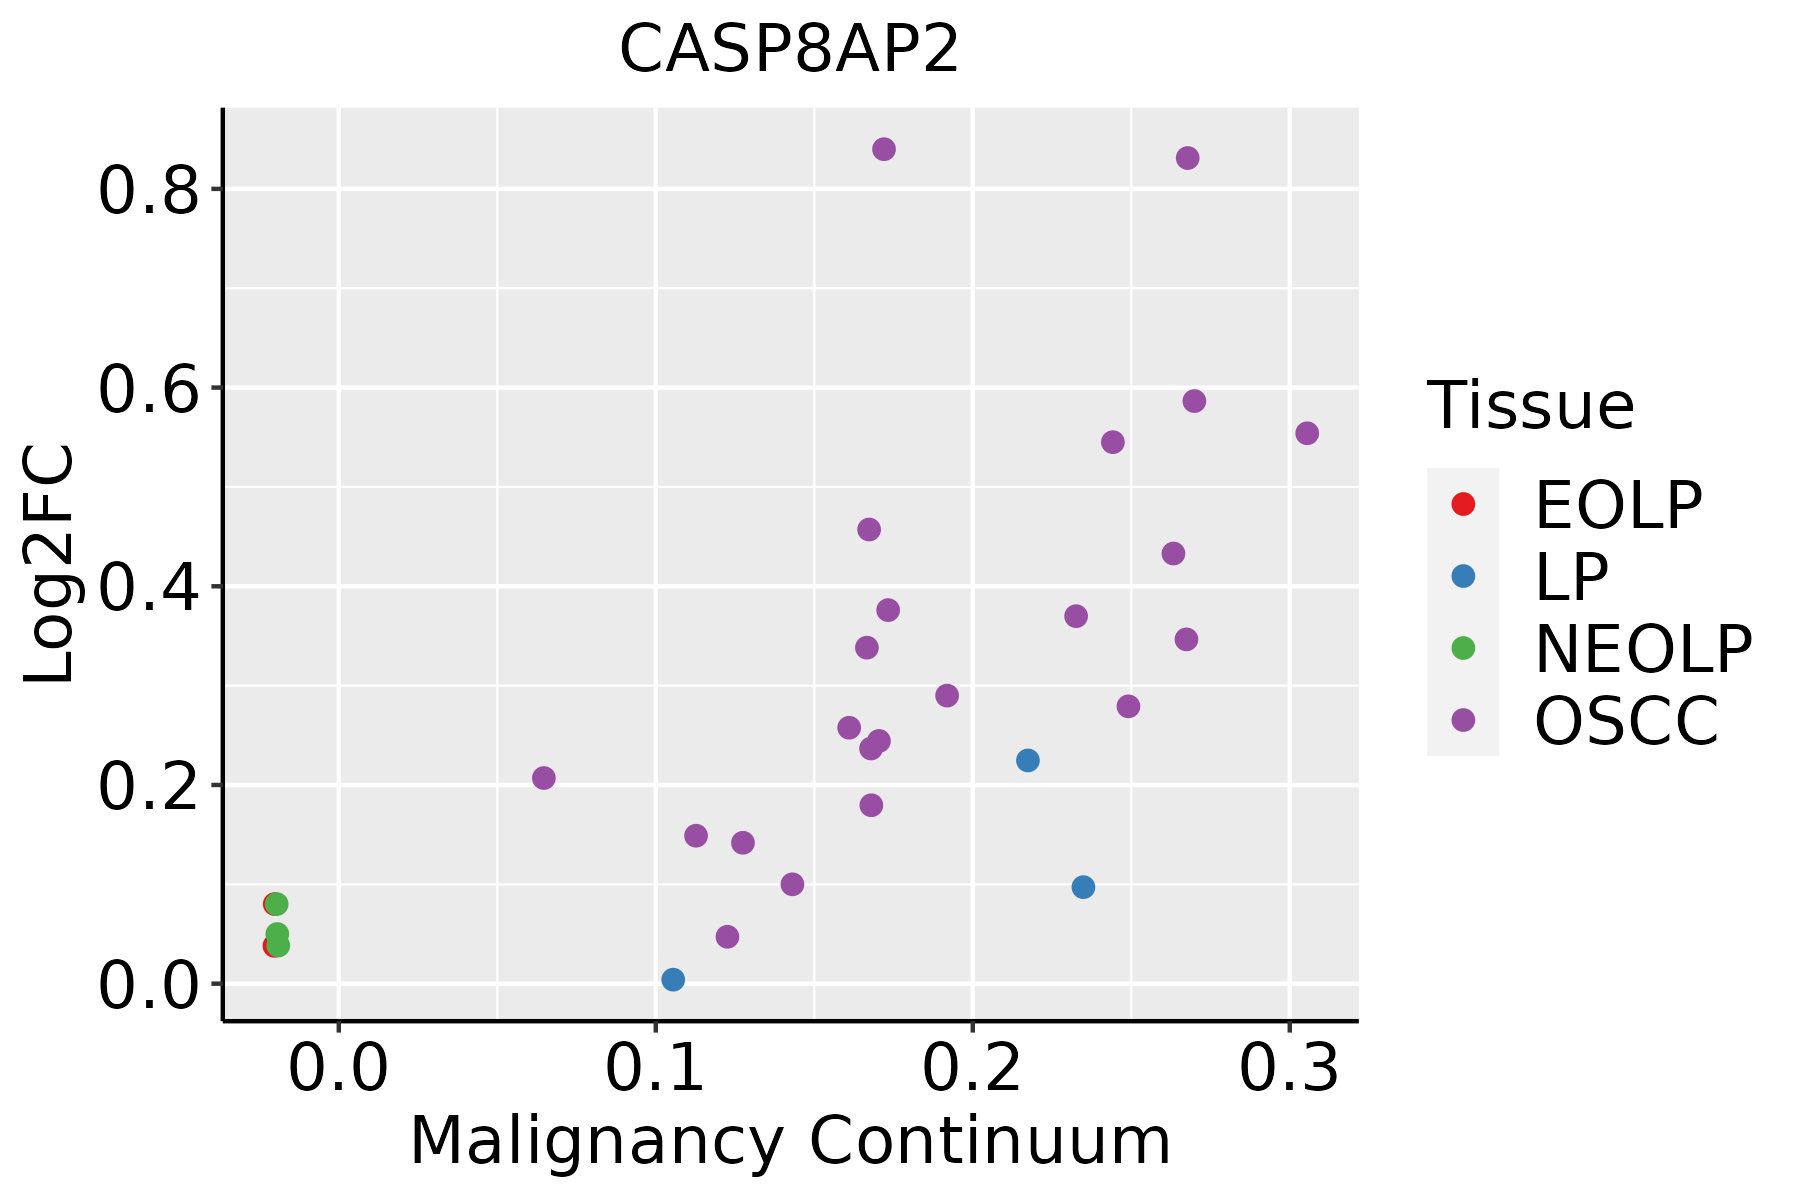
EOLP: Erosive Oral lichen planus
LP: leukoplakia
NEOLP: Non-erosive oral lichen planus
OSCC: Oral squamous cell carcinoma
ProstateThe image shows the transcriptomic changes along malignancy continuum.log2FC in expression of this searched gene in stem-like cells from each diseased tissue sample relative to stem-like cells in normal samples in each tissue plotted against the malignancy continuum. Samples are colored based on if they are from different disease stage.
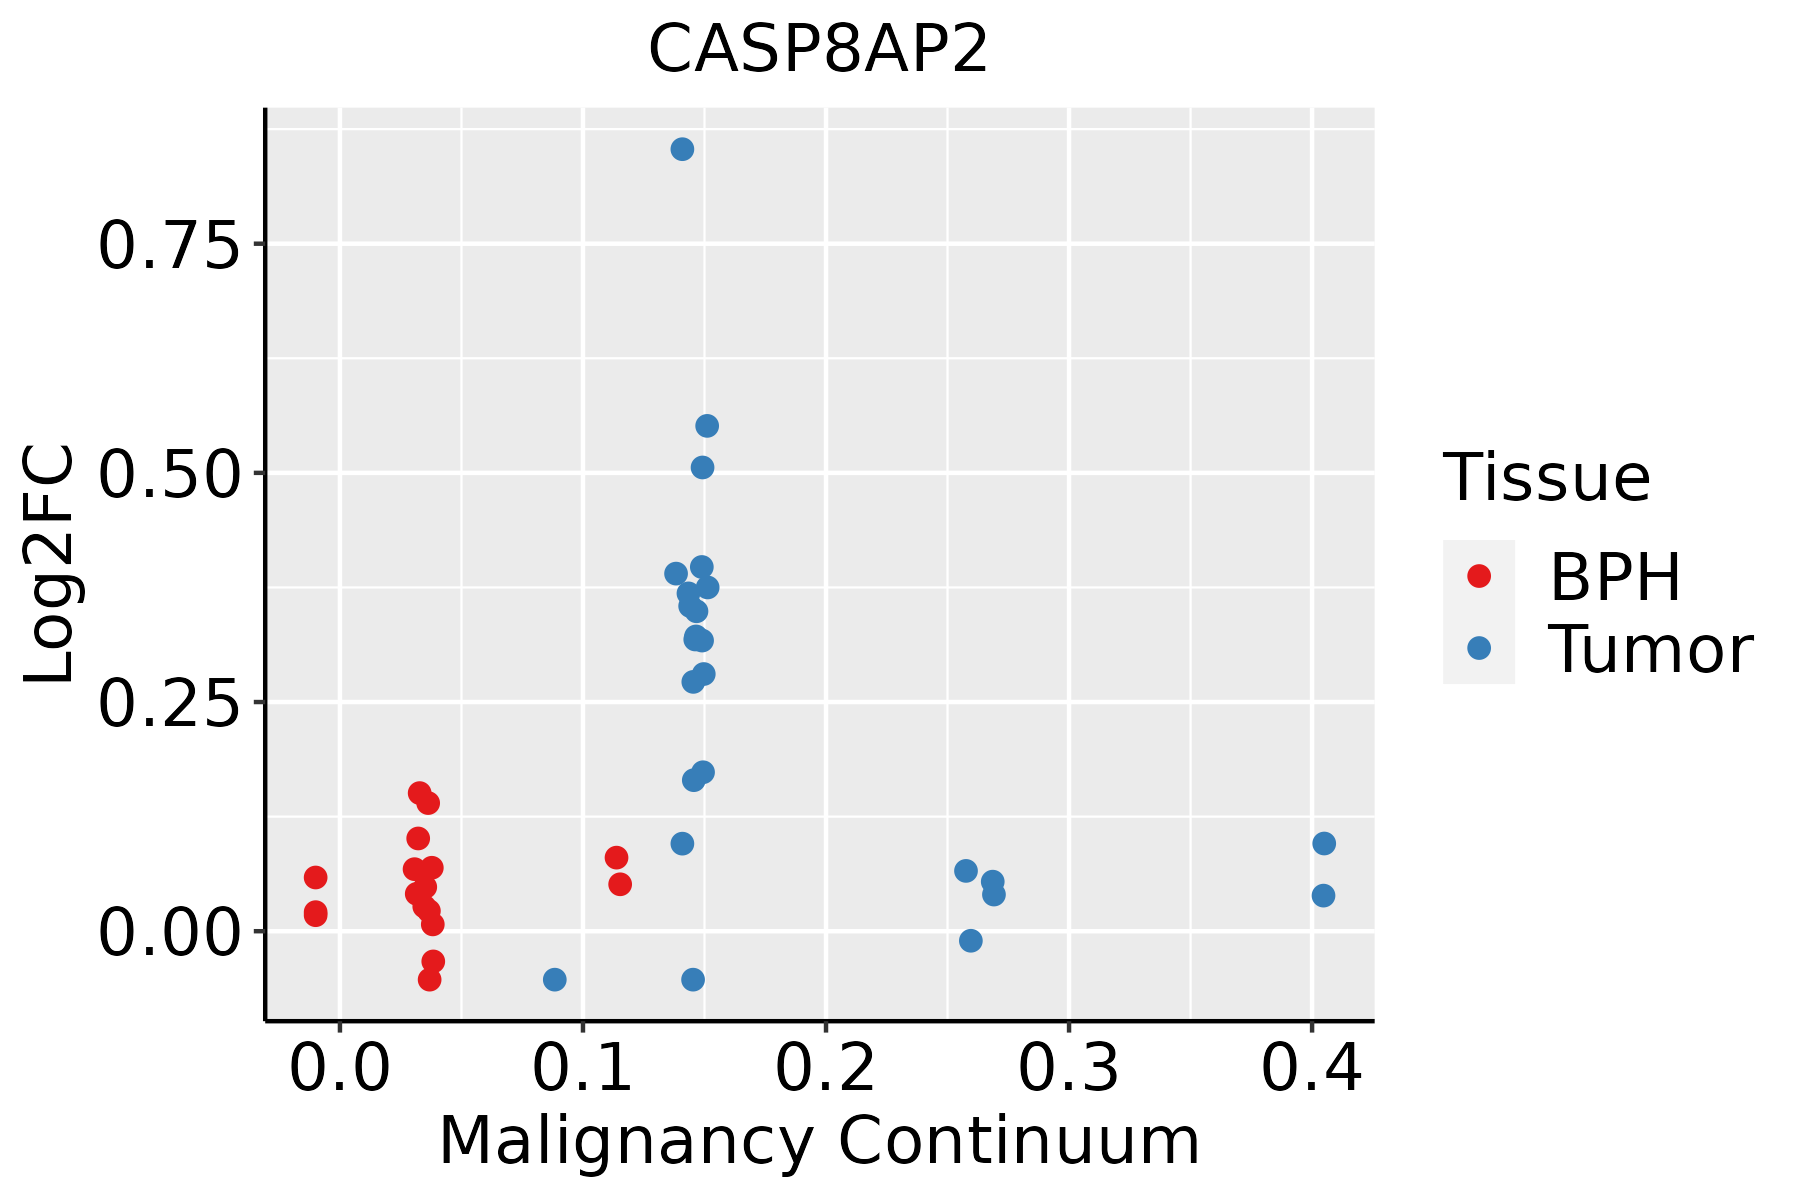
BPH: Benign Prostatic Hyperplasia
ThyroidThe image shows the transcriptomic changes along malignancy continuum.log2FC in expression of this searched gene in stem-like cells from each diseased tissue sample relative to stem-like cells in normal samples in each tissue plotted against the malignancy continuum. Samples are colored based on if they are from different disease stage.
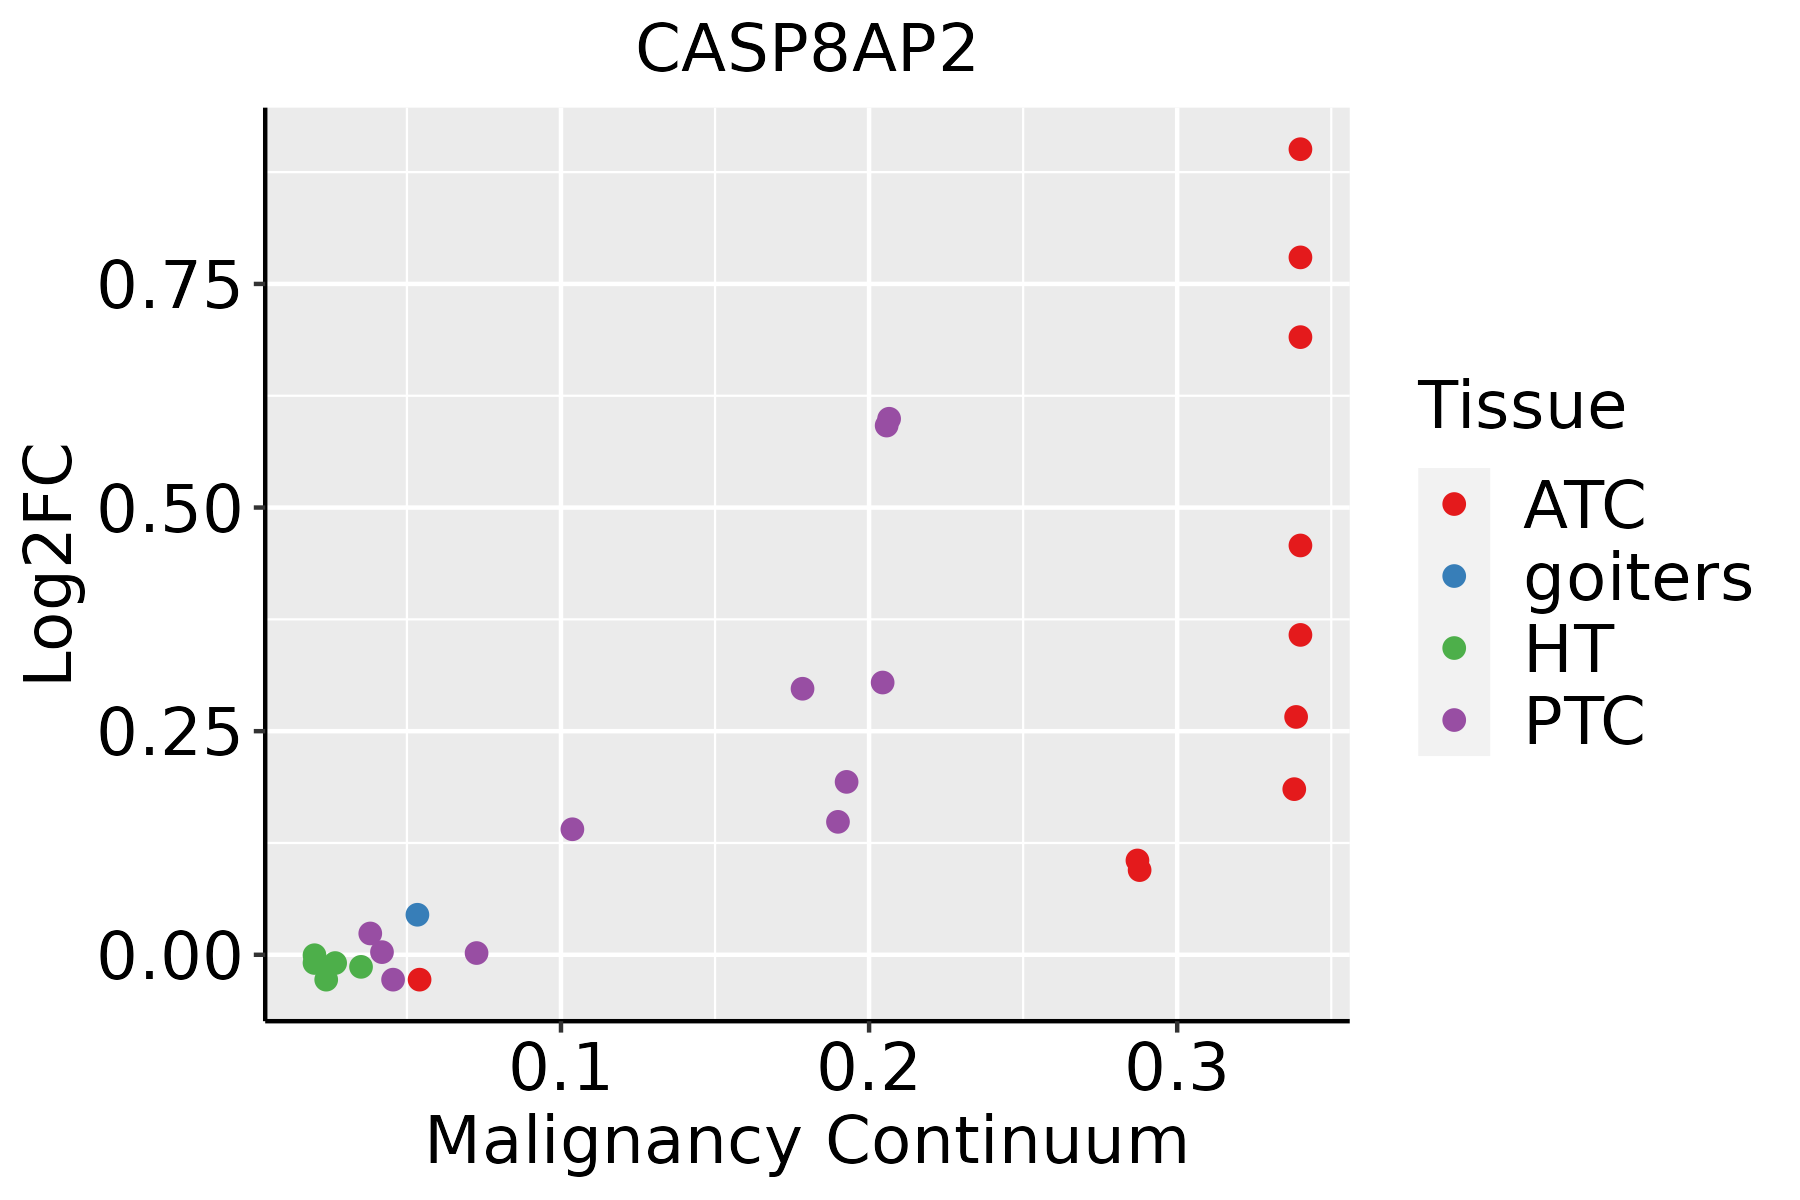
ATC: Anaplastic thyroid cancer
HT: Hashimoto's thyroiditis
PTC: Papillary thyroid cancer
∗log2FC in expression of this searched gene in stem-like cells from each diseased tissue sample relative to stem-like cells in normal samples in each tissue plotted against the malignancy continuum. Samples are colored based on if they are from different disease stage.

Top

Malignant transformation related pathway analysis

check buttonFind out the enriched GO biological processes and KEGG pathways involved in transition from healthy to precancer to cancer
check button Figure of enriched GO biological processes.
TissueDisease StageEnriched GO biological Processes
ColorectumADGO analysis - Figure of enriched GO biological processes: Top 15 enriched GO BP terms are showed in the bar plot of each disease state in each tissue. Each row represents a significant GO biological process which is colored according to the -log10(p.adjust).
ColorectumSERGO analysis - Figure of enriched GO biological processes: Top 15 enriched GO BP terms are showed in the bar plot of each disease state in each tissue. Each row represents a significant GO biological process which is colored according to the -log10(p.adjust).
ColorectumMSSGO analysis - Figure of enriched GO biological processes: Top 15 enriched GO BP terms are showed in the bar plot of each disease state in each tissue. Each row represents a significant GO biological process which is colored according to the -log10(p.adjust).
ColorectumMSI-HGO analysis - Figure of enriched GO biological processes: Top 15 enriched GO BP terms are showed in the bar plot of each disease state in each tissue. Each row represents a significant GO biological process which is colored according to the -log10(p.adjust).
ColorectumFAPGO analysis - Figure of enriched GO biological processes: Top 15 enriched GO BP terms are showed in the bar plot of each disease state in each tissue. Each row represents a significant GO biological process which is colored according to the -log10(p.adjust).
∗Top 15 enriched GO BP terms are showed in the bar plot of each disease state in each tissue. Each row represents a significant GO biological process which is colored according to the -log10(p.adjust).
Page: 1 2 3 4 5 6 7 8 9 

check button Enriched GO biological processes.
GO IDTissueDisease StageDescriptionGene RatioBg Ratiopvaluep.adjustCount
GO:0045862111EsophagusESCCpositive regulation of proteolysis256/8552372/187237.88e-209.43e-18256
GO:0097191111EsophagusESCCextrinsic apoptotic signaling pathway159/8552219/187234.12e-162.94e-14159
GO:0071496111EsophagusESCCcellular response to external stimulus215/8552320/187234.29e-152.43e-13215
GO:2000116111EsophagusESCCregulation of cysteine-type endopeptidase activity158/8552235/187231.67e-115.90e-10158
GO:0043281111EsophagusESCCregulation of cysteine-type endopeptidase activity involved in apoptotic process143/8552209/187232.12e-117.31e-10143
GO:0010952111EsophagusESCCpositive regulation of peptidase activity133/8552197/187234.31e-101.14e-08133
GO:007121419EsophagusESCCcellular response to abiotic stimulus206/8552331/187237.52e-101.88e-08206
GO:010400419EsophagusESCCcellular response to environmental stimulus206/8552331/187237.52e-101.88e-08206
GO:0052547111EsophagusESCCregulation of peptidase activity275/8552461/187237.54e-101.88e-08275
GO:0052548111EsophagusESCCregulation of endopeptidase activity253/8552432/187233.68e-086.78e-07253
GO:0010950111EsophagusESCCpositive regulation of endopeptidase activity116/8552179/187231.77e-072.79e-06116
GO:000862519EsophagusESCCextrinsic apoptotic signaling pathway via death domain receptors59/855282/187231.23e-061.52e-0559
GO:0043280110EsophagusESCCpositive regulation of cysteine-type endopeptidase activity involved in apoptotic process84/8552129/187236.38e-066.55e-0584
GO:2001056110EsophagusESCCpositive regulation of cysteine-type endopeptidase activity94/8552148/187238.87e-068.59e-0594
GO:000691915EsophagusESCCactivation of cysteine-type endopeptidase activity involved in apoptotic process54/855278/187232.17e-051.87e-0454
GO:00712606EsophagusESCCcellular response to mechanical stimulus54/855281/187231.09e-047.64e-0454
GO:000961216EsophagusESCCresponse to mechanical stimulus124/8552216/187233.30e-041.94e-03124
GO:004586220Oral cavityOSCCpositive regulation of proteolysis236/7305372/187236.53e-221.38e-19236
GO:200011620Oral cavityOSCCregulation of cysteine-type endopeptidase activity152/7305235/187231.14e-158.13e-14152
GO:004328120Oral cavityOSCCregulation of cysteine-type endopeptidase activity involved in apoptotic process137/7305209/187235.94e-153.80e-13137
Page: 1 2 3 4 5 

check button Enriched KEGG pathways.
Pathway IDTissueDisease StageDescriptionGene RatioBg Ratiopvaluep.adjustqvalueCount
Page: 1 

Top

Cell-cell communication analysis

check buttonIdentification of potential cell-cell interactions between two cell types and their ligand-receptor pairs for different disease states
LigandReceptorLRpairPathwayTissueDisease Stage
Page: 1 

Top

Single-cell gene regulatory network inference analysis

check buttonFind out the significant the regulons (TFs) and the target genes of each regulon across cell types for different disease states
TFCell TypeTissueDisease StageTarget GeneRSSRegulon Activity
∗The dot plots of a searched regulon are shown for all cell subpopulations in each disease state of each tissue based on the regulon specific score inferred using pySCENIC and by calculating the average expression.
Page: 1 

Top

Somatic mutation of malignant transformation related genes

check buttonAnnotation of somatic variants for genes involved in malignant transformation
Hugo SymbolVariant ClassVariant ClassificationdbSNP RSHGVScHGVSpHGVSp ShortSWISSPROTBIOTYPESIFTPolyPhenTumor Sample BarcodeTissueHistologySexAgeStageTherapy TypesDrugsOutcome
CASP8AP2SNVMissense_Mutationnovelc.208N>Cp.Glu70Glnp.E70Qprotein_codingdeleterious(0)probably_damaging(0.986)TCGA-5L-AAT1-01Breastbreast invasive carcinomaFemale<65III/IVHormone TherapyletrozolSD
CASP8AP2SNVMissense_Mutationnovelc.368G>Tp.Arg123Ilep.R123Iprotein_codingdeleterious(0)probably_damaging(0.979)TCGA-A2-A4S3-01Breastbreast invasive carcinomaFemale<65I/IIUnknownUnknownSD
CASP8AP2SNVMissense_Mutationnovelc.5021N>Tp.Ser1674Phep.S1674Fprotein_codingdeleterious(0.02)probably_damaging(0.924)TCGA-A8-A0A7-01Breastbreast invasive carcinomaFemale<65I/IIUnknownUnknownSD
CASP8AP2SNVMissense_Mutationnovelc.2392A>Cp.Ser798Argp.S798Rprotein_codingtolerated(0.19)benign(0.029)TCGA-AC-A23H-01Breastbreast invasive carcinomaFemale>=65I/IIUnknownUnknownPD
CASP8AP2SNVMissense_Mutationrs781619316c.2890C>Tp.Arg964Trpp.R964Wprotein_codingdeleterious(0)possibly_damaging(0.84)TCGA-AC-A23H-01Breastbreast invasive carcinomaFemale>=65I/IIUnknownUnknownPD
CASP8AP2SNVMissense_Mutationnovelc.1201C>Tp.His401Tyrp.H401Yprotein_codingtolerated(0.13)benign(0.018)TCGA-AC-A8OP-01Breastbreast invasive carcinomaFemale>=65I/IIUnknownUnknownSD
CASP8AP2SNVMissense_Mutationrs758643574c.908C>Tp.Ser303Leup.S303Lprotein_codingtolerated(0.33)benign(0.112)TCGA-AN-A046-01Breastbreast invasive carcinomaFemale>=65I/IIUnknownUnknownSD
CASP8AP2SNVMissense_Mutationnovelc.380A>Cp.Asn127Thrp.N127Tprotein_codingdeleterious(0)possibly_damaging(0.844)TCGA-AR-A24Q-01Breastbreast invasive carcinomaFemale<65I/IIChemotherapydoxorubicinSD
CASP8AP2SNVMissense_Mutationnovelc.2545N>Tp.His849Tyrp.H849Yprotein_codingdeleterious(0)benign(0.198)TCGA-AR-A250-01Breastbreast invasive carcinomaFemale<65I/IIChemotherapydoxorubicinSD
CASP8AP2SNVMissense_Mutationc.5065G>Ap.Asp1689Asnp.D1689Nprotein_codingdeleterious(0.01)probably_damaging(0.944)TCGA-C8-A1HF-01Breastbreast invasive carcinomaFemale<65I/IIUnknownUnknownSD
Page: 1 2 3 4 5 6 7 8 9 10 11 12 13 14 15 16 17 18 19 20 

Top

Related drugs of malignant transformation related genes

check buttonIdentification of chemicals and drugs interact with genes involved in malignant transfromation
(DGIdb 4.0)
Entrez IDSymbolCategoryInteraction TypesDrug Claim NameDrug NamePMIDs
Page: 1