
|
|||||
|
 | |
| |
| |
| |
| |
| |
|
Gene: CASP7 |
Gene summary for CASP7 |
| Gene information | Species | Human | Gene symbol | CASP7 | Gene ID | 840 |
| Gene name | caspase 7 | |
| Gene Alias | CASP-7 | |
| Cytomap | 10q25.3 | |
| Gene Type | protein-coding | GO ID | GO:0006508 | UniProtAcc | P55210 |
Top |
Malignant transformation analysis |
| Identification of the aberrant gene expression in precancerous and cancerous lesions by comparing the gene expression of stem-like cells in diseased tissues with normal stem cells |
| Entrez ID | Symbol | Replicates | Species | Organ | Tissue | Adj P-value | Log2FC | Malignancy |
| 840 | CASP7 | HTA11_347_2000001011 | Human | Colorectum | AD | 2.88e-15 | 6.22e-01 | -0.1954 |
| 840 | CASP7 | HTA11_696_2000001011 | Human | Colorectum | AD | 1.46e-05 | 2.86e-01 | -0.1464 |
| 840 | CASP7 | HTA11_99999970781_79442 | Human | Colorectum | MSS | 4.99e-02 | 2.33e-01 | 0.294 |
| 840 | CASP7 | A015-C-203 | Human | Colorectum | FAP | 2.71e-04 | -1.13e-01 | -0.1294 |
| 840 | CASP7 | A002-C-201 | Human | Colorectum | FAP | 2.82e-03 | -1.31e-01 | 0.0324 |
| 840 | CASP7 | A001-C-108 | Human | Colorectum | FAP | 1.36e-03 | -7.64e-02 | -0.0272 |
| 840 | CASP7 | A002-C-205 | Human | Colorectum | FAP | 1.22e-03 | -5.63e-02 | -0.1236 |
| 840 | CASP7 | A015-C-104 | Human | Colorectum | FAP | 1.05e-04 | -1.17e-01 | -0.1899 |
| 840 | CASP7 | A002-C-016 | Human | Colorectum | FAP | 1.41e-03 | -1.13e-01 | 0.0521 |
| 840 | CASP7 | A015-C-002 | Human | Colorectum | FAP | 2.44e-03 | -2.31e-01 | -0.0763 |
| 840 | CASP7 | A002-C-116 | Human | Colorectum | FAP | 6.28e-04 | -8.11e-02 | -0.0452 |
| 840 | CASP7 | A014-C-008 | Human | Colorectum | FAP | 2.98e-03 | -2.22e-01 | -0.191 |
| 840 | CASP7 | A018-E-020 | Human | Colorectum | FAP | 1.70e-02 | 1.18e-02 | -0.2034 |
| 840 | CASP7 | LZE4T | Human | Esophagus | ESCC | 1.14e-12 | 2.41e-01 | 0.0811 |
| 840 | CASP7 | LZE8T | Human | Esophagus | ESCC | 3.67e-13 | 3.58e-01 | 0.067 |
| 840 | CASP7 | LZE20T | Human | Esophagus | ESCC | 1.55e-02 | 1.79e-01 | 0.0662 |
| 840 | CASP7 | LZE24T | Human | Esophagus | ESCC | 6.67e-30 | 9.34e-01 | 0.0596 |
| 840 | CASP7 | LZE6T | Human | Esophagus | ESCC | 2.02e-05 | 1.22e-01 | 0.0845 |
| 840 | CASP7 | P1T-E | Human | Esophagus | ESCC | 4.68e-04 | 3.82e-01 | 0.0875 |
| 840 | CASP7 | P2T-E | Human | Esophagus | ESCC | 6.22e-28 | 4.30e-01 | 0.1177 |
| Page: 1 2 3 4 5 |
| Tissue | Expression Dynamics | Abbreviation |
| Colorectum (GSE201348) |  | FAP: Familial adenomatous polyposis |
| CRC: Colorectal cancer | ||
| Colorectum (HTA11) |  | AD: Adenomas |
| SER: Sessile serrated lesions | ||
| MSI-H: Microsatellite-high colorectal cancer | ||
| MSS: Microsatellite stable colorectal cancer | ||
| Esophagus |  | ESCC: Esophageal squamous cell carcinoma |
| HGIN: High-grade intraepithelial neoplasias | ||
| LGIN: Low-grade intraepithelial neoplasias | ||
| Oral Cavity | 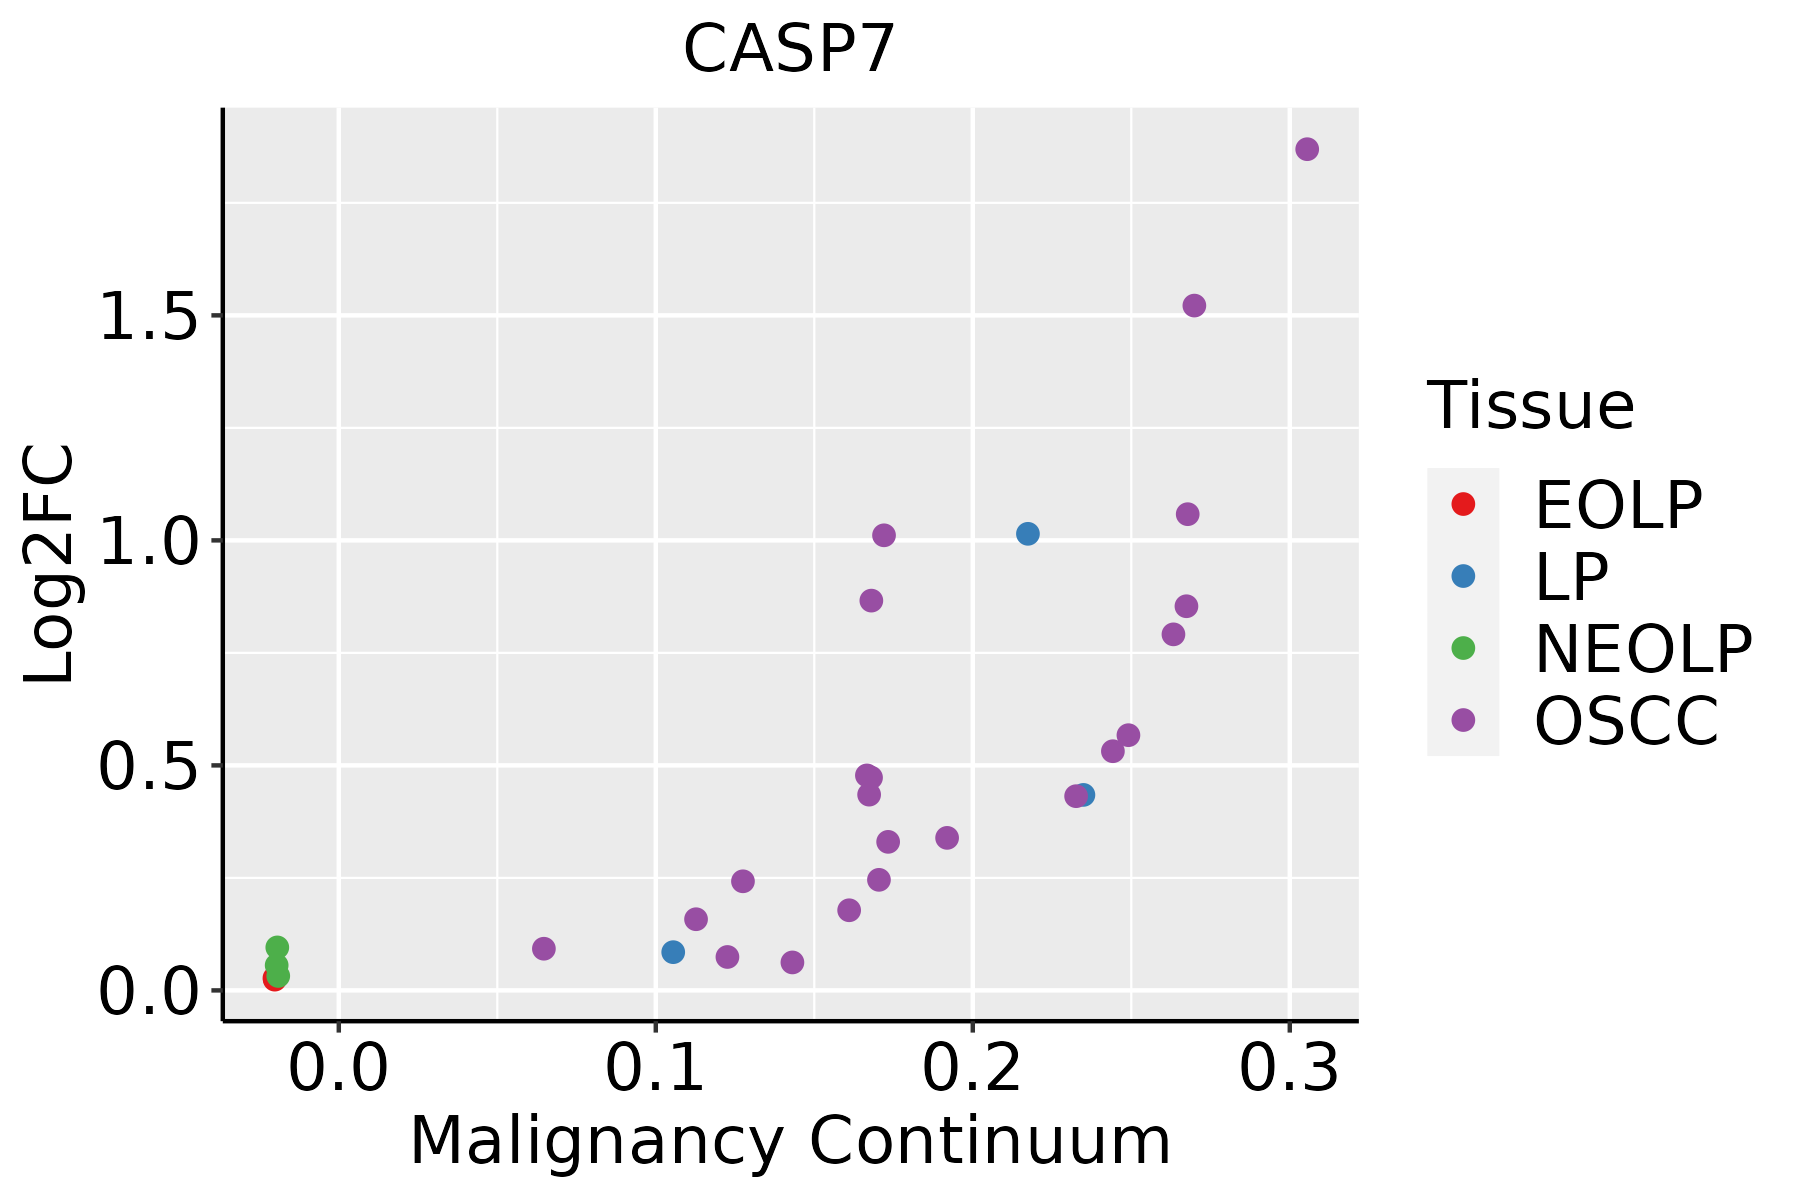 | EOLP: Erosive Oral lichen planus |
| LP: leukoplakia | ||
| NEOLP: Non-erosive oral lichen planus | ||
| OSCC: Oral squamous cell carcinoma | ||
| Skin | 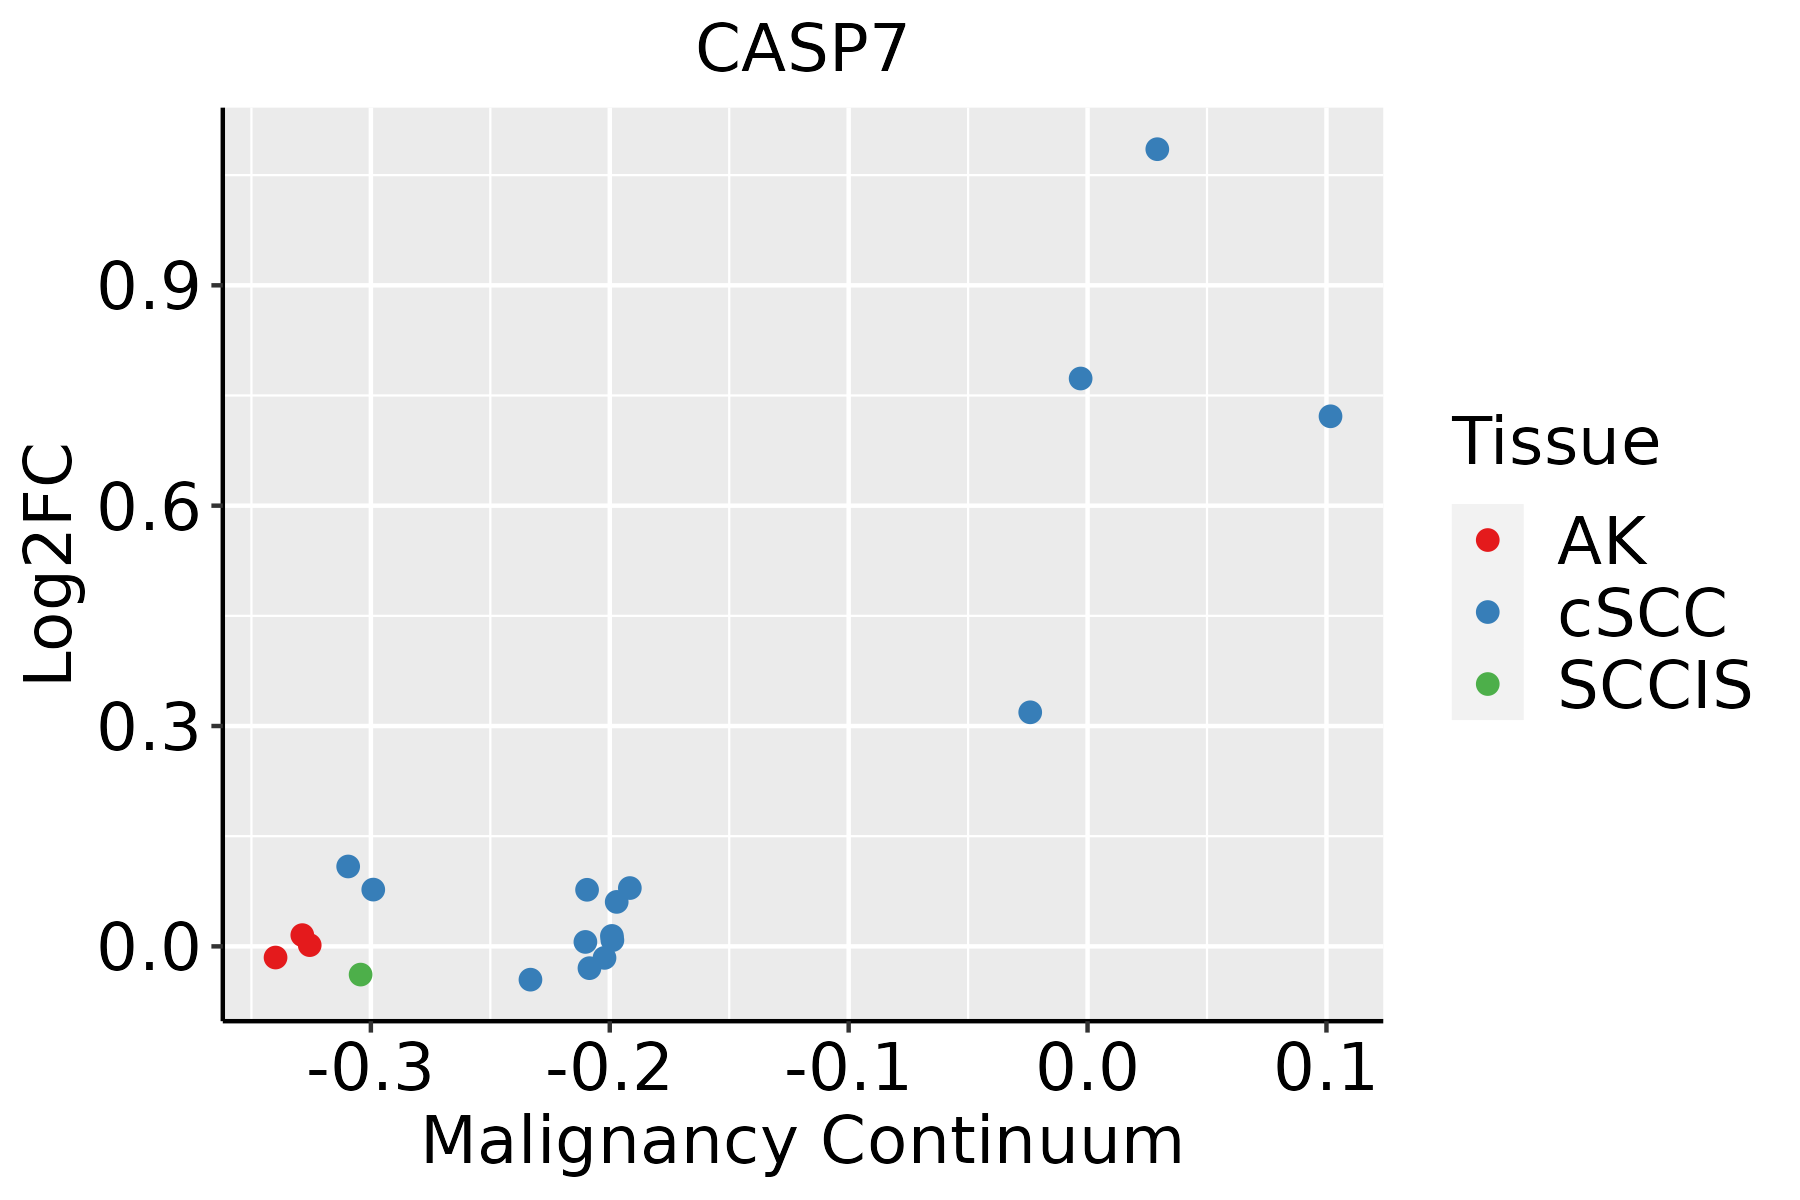 | AK: Actinic keratosis |
| cSCC: Cutaneous squamous cell carcinoma | ||
| SCCIS:squamous cell carcinoma in situ |
| ∗log2FC in expression of this searched gene in stem-like cells from each diseased tissue sample relative to stem-like cells in normal samples in each tissue plotted against the malignancy continuum. Samples are colored based on if they are from different disease stage. |
Top |
Malignant transformation related pathway analysis |
| Find out the enriched GO biological processes and KEGG pathways involved in transition from healthy to precancer to cancer |
| Tissue | Disease Stage | Enriched GO biological Processes |
| Colorectum | AD |  |
| Colorectum | SER |  |
| Colorectum | MSS |  |
| Colorectum | MSI-H |  |
| Colorectum | FAP |  |
| ∗Top 15 enriched GO BP terms are showed in the bar plot of each disease state in each tissue. Each row represents a significant GO biological process which is colored according to the -log10(p.adjust). |
| Page: 1 2 3 4 5 6 7 8 9 |
| GO ID | Tissue | Disease Stage | Description | Gene Ratio | Bg Ratio | pvalue | p.adjust | Count |
| GO:0070997 | Colorectum | AD | neuron death | 114/3918 | 361/18723 | 1.13e-06 | 3.72e-05 | 114 |
| GO:0051402 | Colorectum | AD | neuron apoptotic process | 77/3918 | 246/18723 | 8.07e-05 | 1.28e-03 | 77 |
| GO:0007568 | Colorectum | AD | aging | 98/3918 | 339/18723 | 2.77e-04 | 3.39e-03 | 98 |
| GO:0051604 | Colorectum | AD | protein maturation | 85/3918 | 294/18723 | 6.73e-04 | 6.91e-03 | 85 |
| GO:0016485 | Colorectum | AD | protein processing | 63/3918 | 225/18723 | 6.77e-03 | 4.19e-02 | 63 |
| GO:00709972 | Colorectum | MSS | neuron death | 97/3467 | 361/18723 | 5.21e-05 | 9.31e-04 | 97 |
| GO:00075681 | Colorectum | MSS | aging | 90/3467 | 339/18723 | 1.51e-04 | 2.19e-03 | 90 |
| GO:00514022 | Colorectum | MSS | neuron apoptotic process | 66/3467 | 246/18723 | 7.94e-04 | 8.36e-03 | 66 |
| GO:00516042 | Colorectum | MSS | protein maturation | 75/3467 | 294/18723 | 1.70e-03 | 1.53e-02 | 75 |
| GO:00164852 | Colorectum | MSS | protein processing | 57/3467 | 225/18723 | 6.60e-03 | 4.38e-02 | 57 |
| GO:00709974 | Colorectum | FAP | neuron death | 81/2622 | 361/18723 | 8.35e-06 | 2.46e-04 | 81 |
| GO:00514024 | Colorectum | FAP | neuron apoptotic process | 55/2622 | 246/18723 | 2.42e-04 | 3.37e-03 | 55 |
| GO:00075682 | Colorectum | FAP | aging | 69/2622 | 339/18723 | 7.66e-04 | 8.12e-03 | 69 |
| GO:000941113 | Esophagus | ESCC | response to UV | 115/8552 | 149/18723 | 3.29e-15 | 1.93e-13 | 115 |
| GO:000931419 | Esophagus | ESCC | response to radiation | 277/8552 | 456/18723 | 4.42e-11 | 1.43e-09 | 277 |
| GO:005160418 | Esophagus | ESCC | protein maturation | 189/8552 | 294/18723 | 7.64e-11 | 2.39e-09 | 189 |
| GO:0070997111 | Esophagus | ESCC | neuron death | 216/8552 | 361/18723 | 3.49e-08 | 6.45e-07 | 216 |
| GO:000756820 | Esophagus | ESCC | aging | 201/8552 | 339/18723 | 2.64e-07 | 3.94e-06 | 201 |
| GO:0051402110 | Esophagus | ESCC | neuron apoptotic process | 148/8552 | 246/18723 | 3.08e-06 | 3.47e-05 | 148 |
| GO:001648514 | Esophagus | ESCC | protein processing | 134/8552 | 225/18723 | 1.81e-05 | 1.60e-04 | 134 |
| Page: 1 2 3 |
| Pathway ID | Tissue | Disease Stage | Description | Gene Ratio | Bg Ratio | pvalue | p.adjust | qvalue | Count |
| hsa05010 | Colorectum | AD | Alzheimer disease | 174/2092 | 384/8465 | 1.82e-19 | 9.26e-18 | 5.91e-18 | 174 |
| hsa04932 | Colorectum | AD | Non-alcoholic fatty liver disease | 90/2092 | 155/8465 | 4.83e-19 | 1.80e-17 | 1.15e-17 | 90 |
| hsa05022 | Colorectum | AD | Pathways of neurodegeneration - multiple diseases | 201/2092 | 476/8465 | 4.54e-18 | 1.27e-16 | 8.09e-17 | 201 |
| hsa05132 | Colorectum | AD | Salmonella infection | 102/2092 | 249/8465 | 7.65e-09 | 1.28e-07 | 8.17e-08 | 102 |
| hsa05130 | Colorectum | AD | Pathogenic Escherichia coli infection | 79/2092 | 197/8465 | 1.05e-06 | 1.36e-05 | 8.65e-06 | 79 |
| hsa05417 | Colorectum | AD | Lipid and atherosclerosis | 73/2092 | 215/8465 | 1.31e-03 | 8.27e-03 | 5.27e-03 | 73 |
| hsa050101 | Colorectum | AD | Alzheimer disease | 174/2092 | 384/8465 | 1.82e-19 | 9.26e-18 | 5.91e-18 | 174 |
| hsa049321 | Colorectum | AD | Non-alcoholic fatty liver disease | 90/2092 | 155/8465 | 4.83e-19 | 1.80e-17 | 1.15e-17 | 90 |
| hsa050221 | Colorectum | AD | Pathways of neurodegeneration - multiple diseases | 201/2092 | 476/8465 | 4.54e-18 | 1.27e-16 | 8.09e-17 | 201 |
| hsa051321 | Colorectum | AD | Salmonella infection | 102/2092 | 249/8465 | 7.65e-09 | 1.28e-07 | 8.17e-08 | 102 |
| hsa051301 | Colorectum | AD | Pathogenic Escherichia coli infection | 79/2092 | 197/8465 | 1.05e-06 | 1.36e-05 | 8.65e-06 | 79 |
| hsa054171 | Colorectum | AD | Lipid and atherosclerosis | 73/2092 | 215/8465 | 1.31e-03 | 8.27e-03 | 5.27e-03 | 73 |
| hsa050104 | Colorectum | MSS | Alzheimer disease | 169/1875 | 384/8465 | 1.21e-22 | 1.01e-20 | 6.21e-21 | 169 |
| hsa050224 | Colorectum | MSS | Pathways of neurodegeneration - multiple diseases | 192/1875 | 476/8465 | 2.79e-20 | 1.04e-18 | 6.36e-19 | 192 |
| hsa049324 | Colorectum | MSS | Non-alcoholic fatty liver disease | 85/1875 | 155/8465 | 4.19e-19 | 1.17e-17 | 7.17e-18 | 85 |
| hsa051324 | Colorectum | MSS | Salmonella infection | 92/1875 | 249/8465 | 5.23e-08 | 9.74e-07 | 5.97e-07 | 92 |
| hsa051304 | Colorectum | MSS | Pathogenic Escherichia coli infection | 73/1875 | 197/8465 | 1.10e-06 | 1.48e-05 | 9.06e-06 | 73 |
| hsa054174 | Colorectum | MSS | Lipid and atherosclerosis | 70/1875 | 215/8465 | 2.38e-04 | 1.81e-03 | 1.11e-03 | 70 |
| hsa04210 | Colorectum | MSS | Apoptosis | 44/1875 | 136/8465 | 3.66e-03 | 1.66e-02 | 1.01e-02 | 44 |
| hsa050105 | Colorectum | MSS | Alzheimer disease | 169/1875 | 384/8465 | 1.21e-22 | 1.01e-20 | 6.21e-21 | 169 |
| Page: 1 2 3 4 5 6 |
Top |
Cell-cell communication analysis |
| Identification of potential cell-cell interactions between two cell types and their ligand-receptor pairs for different disease states |
| Ligand | Receptor | LRpair | Pathway | Tissue | Disease Stage |
| Page: 1 |
Top |
Single-cell gene regulatory network inference analysis |
| Find out the significant the regulons (TFs) and the target genes of each regulon across cell types for different disease states |
| TF | Cell Type | Tissue | Disease Stage | Target Gene | RSS | Regulon Activity |
| ∗The dot plots of a searched regulon are shown for all cell subpopulations in each disease state of each tissue based on the regulon specific score inferred using pySCENIC and by calculating the average expression. |
| Page: 1 |
Top |
Somatic mutation of malignant transformation related genes |
| Annotation of somatic variants for genes involved in malignant transformation |
| Hugo Symbol | Variant Class | Variant Classification | dbSNP RS | HGVSc | HGVSp | HGVSp Short | SWISSPROT | BIOTYPE | SIFT | PolyPhen | Tumor Sample Barcode | Tissue | Histology | Sex | Age | Stage | Therapy Types | Drugs | Outcome |
| CASP7 | SNV | Missense_Mutation | rs146796754 | c.560N>A | p.Arg187Gln | p.R187Q | protein_coding | tolerated(0.14) | benign(0.01) | TCGA-AN-A046-01 | Breast | breast invasive carcinoma | Female | >=65 | I/II | Unknown | Unknown | SD | |
| CASP7 | SNV | Missense_Mutation | c.491N>T | p.Asp164Val | p.D164V | protein_coding | deleterious(0.02) | possibly_damaging(0.818) | TCGA-AN-A0AM-01 | Breast | breast invasive carcinoma | Female | <65 | I/II | Unknown | Unknown | SD | ||
| CASP7 | SNV | Missense_Mutation | c.1107N>C | p.Glu369Asp | p.E369D | protein_coding | tolerated(0.18) | benign(0.118) | TCGA-D8-A1JA-01 | Breast | breast invasive carcinoma | Female | <65 | III/IV | Chemotherapy | adriamycin | PD | ||
| CASP7 | SNV | Missense_Mutation | novel | c.926N>T | p.Ser309Phe | p.S309F | protein_coding | deleterious(0) | probably_damaging(1) | TCGA-EW-A1P8-01 | Breast | breast invasive carcinoma | Female | <65 | III/IV | Chemotherapy | fluorouracil | PD | |
| CASP7 | insertion | Frame_Shift_Ins | novel | c.1114_1115insCATTCATTCATTTATCTTTTCATCAAATTATCATTGAGCTCCTA | p.Gln372ProfsTer40 | p.Q372Pfs*40 | protein_coding | TCGA-A2-A0D1-01 | Breast | breast invasive carcinoma | Female | >=65 | I/II | Chemotherapy | taxotere | SD | |||
| CASP7 | SNV | Missense_Mutation | rs376348175 | c.815N>A | p.Arg272Gln | p.R272Q | protein_coding | tolerated(0.19) | possibly_damaging(0.541) | TCGA-VS-A9UM-01 | Cervix | cervical & endocervical cancer | Female | <65 | I/II | Chemotherapy | cisplatin | CR | |
| CASP7 | SNV | Missense_Mutation | novel | c.490N>C | p.Asp164His | p.D164H | protein_coding | tolerated(0.23) | benign(0.224) | TCGA-VS-A9UY-01 | Cervix | cervical & endocervical cancer | Female | <65 | I/II | Chemotherapy | cisplatin | PD | |
| CASP7 | SNV | Missense_Mutation | c.956G>A | p.Ser319Asn | p.S319N | protein_coding | tolerated(1) | benign(0.001) | TCGA-AD-6964-01 | Colorectum | colon adenocarcinoma | Male | <65 | III/IV | Chemotherapy | folfox | PD | ||
| CASP7 | SNV | Missense_Mutation | rs375409071 | c.851N>T | p.Ser284Leu | p.S284L | protein_coding | deleterious(0.02) | benign(0.351) | TCGA-AZ-4313-01 | Colorectum | colon adenocarcinoma | Female | <65 | I/II | Unknown | Unknown | SD | |
| CASP7 | SNV | Missense_Mutation | novel | c.515N>A | p.Arg172Gln | p.R172Q | protein_coding | deleterious(0.01) | probably_damaging(1) | TCGA-EI-6917-01 | Colorectum | rectum adenocarcinoma | Male | <65 | III/IV | Chemotherapy | 5fluorouracil+oxaciplatina+l-folinian | SD |
| Page: 1 2 3 4 |
Top |
Related drugs of malignant transformation related genes |
| Identification of chemicals and drugs interact with genes involved in malignant transfromation |
| (DGIdb 4.0) |
| Entrez ID | Symbol | Category | Interaction Types | Drug Claim Name | Drug Name | PMIDs |
| 840 | CASP7 | PROTEASE, DRUGGABLE GENOME, ENZYME | paclitaxel | PACLITAXEL | 22441531 | |
| 840 | CASP7 | PROTEASE, DRUGGABLE GENOME, ENZYME | Platinum compounds | 22441531 | ||
| 840 | CASP7 | PROTEASE, DRUGGABLE GENOME, ENZYME | GOSSYPOL | GOSSYPOL | ||
| 840 | CASP7 | PROTEASE, DRUGGABLE GENOME, ENZYME | MYRICETIN | MYRICETIN | ||
| 840 | CASP7 | PROTEASE, DRUGGABLE GENOME, ENZYME | inhibitor | 252166828 | ||
| 840 | CASP7 | PROTEASE, DRUGGABLE GENOME, ENZYME | 20(S)-PROTOPANAXADIOL | CHEMBL375563 | 17261067 | |
| 840 | CASP7 | PROTEASE, DRUGGABLE GENOME, ENZYME | BITHIONOL | BITHIONOL | ||
| 840 | CASP7 | PROTEASE, DRUGGABLE GENOME, ENZYME | gemcitabine | GEMCITABINE | 22441531 | |
| 840 | CASP7 | PROTEASE, DRUGGABLE GENOME, ENZYME | IRL-2500 | CHEMBL72410 | ||
| 840 | CASP7 | PROTEASE, DRUGGABLE GENOME, ENZYME | STICTIC ACID | STICTIC ACID |
| Page: 1 2 3 |

Copyright 2023-Present -The University of Texas Health Science Center at Houston |