
|
|||||
|
 | |
| |
| |
| |
| |
| |
|
Gene: CASP4 |
Gene summary for CASP4 |
| Gene information | Species | Human | Gene symbol | CASP4 | Gene ID | 837 |
| Gene name | caspase 4 | |
| Gene Alias | ICE(rel)II | |
| Cytomap | 11q22.3 | |
| Gene Type | protein-coding | GO ID | GO:0001959 | UniProtAcc | P49662 |
Top |
Malignant transformation analysis |
| Identification of the aberrant gene expression in precancerous and cancerous lesions by comparing the gene expression of stem-like cells in diseased tissues with normal stem cells |
| Entrez ID | Symbol | Replicates | Species | Organ | Tissue | Adj P-value | Log2FC | Malignancy |
| 837 | CASP4 | LZE4T | Human | Esophagus | ESCC | 1.68e-03 | 1.38e-02 | 0.0811 |
| 837 | CASP4 | LZE8T | Human | Esophagus | ESCC | 2.87e-09 | 1.77e-01 | 0.067 |
| 837 | CASP4 | LZE20T | Human | Esophagus | ESCC | 1.11e-03 | 2.08e-01 | 0.0662 |
| 837 | CASP4 | LZE22D1 | Human | Esophagus | HGIN | 6.75e-07 | 5.07e-01 | 0.0595 |
| 837 | CASP4 | LZE22T | Human | Esophagus | ESCC | 7.77e-06 | 7.00e-01 | 0.068 |
| 837 | CASP4 | LZE24T | Human | Esophagus | ESCC | 3.68e-18 | 6.59e-01 | 0.0596 |
| 837 | CASP4 | LZE21T | Human | Esophagus | ESCC | 1.78e-03 | 5.22e-02 | 0.0655 |
| 837 | CASP4 | LZE6T | Human | Esophagus | ESCC | 4.72e-09 | 2.56e-01 | 0.0845 |
| 837 | CASP4 | P1T-E | Human | Esophagus | ESCC | 2.55e-04 | 1.01e-01 | 0.0875 |
| 837 | CASP4 | P2T-E | Human | Esophagus | ESCC | 1.15e-09 | 4.01e-02 | 0.1177 |
| 837 | CASP4 | P4T-E | Human | Esophagus | ESCC | 4.14e-24 | 4.06e-01 | 0.1323 |
| 837 | CASP4 | P5T-E | Human | Esophagus | ESCC | 2.40e-16 | 1.88e-01 | 0.1327 |
| 837 | CASP4 | P8T-E | Human | Esophagus | ESCC | 1.63e-61 | 1.43e+00 | 0.0889 |
| 837 | CASP4 | P9T-E | Human | Esophagus | ESCC | 3.52e-13 | 3.50e-01 | 0.1131 |
| 837 | CASP4 | P10T-E | Human | Esophagus | ESCC | 3.98e-11 | 4.77e-02 | 0.116 |
| 837 | CASP4 | P11T-E | Human | Esophagus | ESCC | 2.42e-17 | 7.00e-01 | 0.1426 |
| 837 | CASP4 | P12T-E | Human | Esophagus | ESCC | 5.38e-04 | -1.44e-01 | 0.1122 |
| 837 | CASP4 | P15T-E | Human | Esophagus | ESCC | 3.87e-06 | 1.68e-01 | 0.1149 |
| 837 | CASP4 | P16T-E | Human | Esophagus | ESCC | 1.20e-04 | -1.00e-01 | 0.1153 |
| 837 | CASP4 | P17T-E | Human | Esophagus | ESCC | 1.10e-02 | 1.82e-01 | 0.1278 |
| Page: 1 2 3 4 5 6 |
| Tissue | Expression Dynamics | Abbreviation |
| Esophagus | 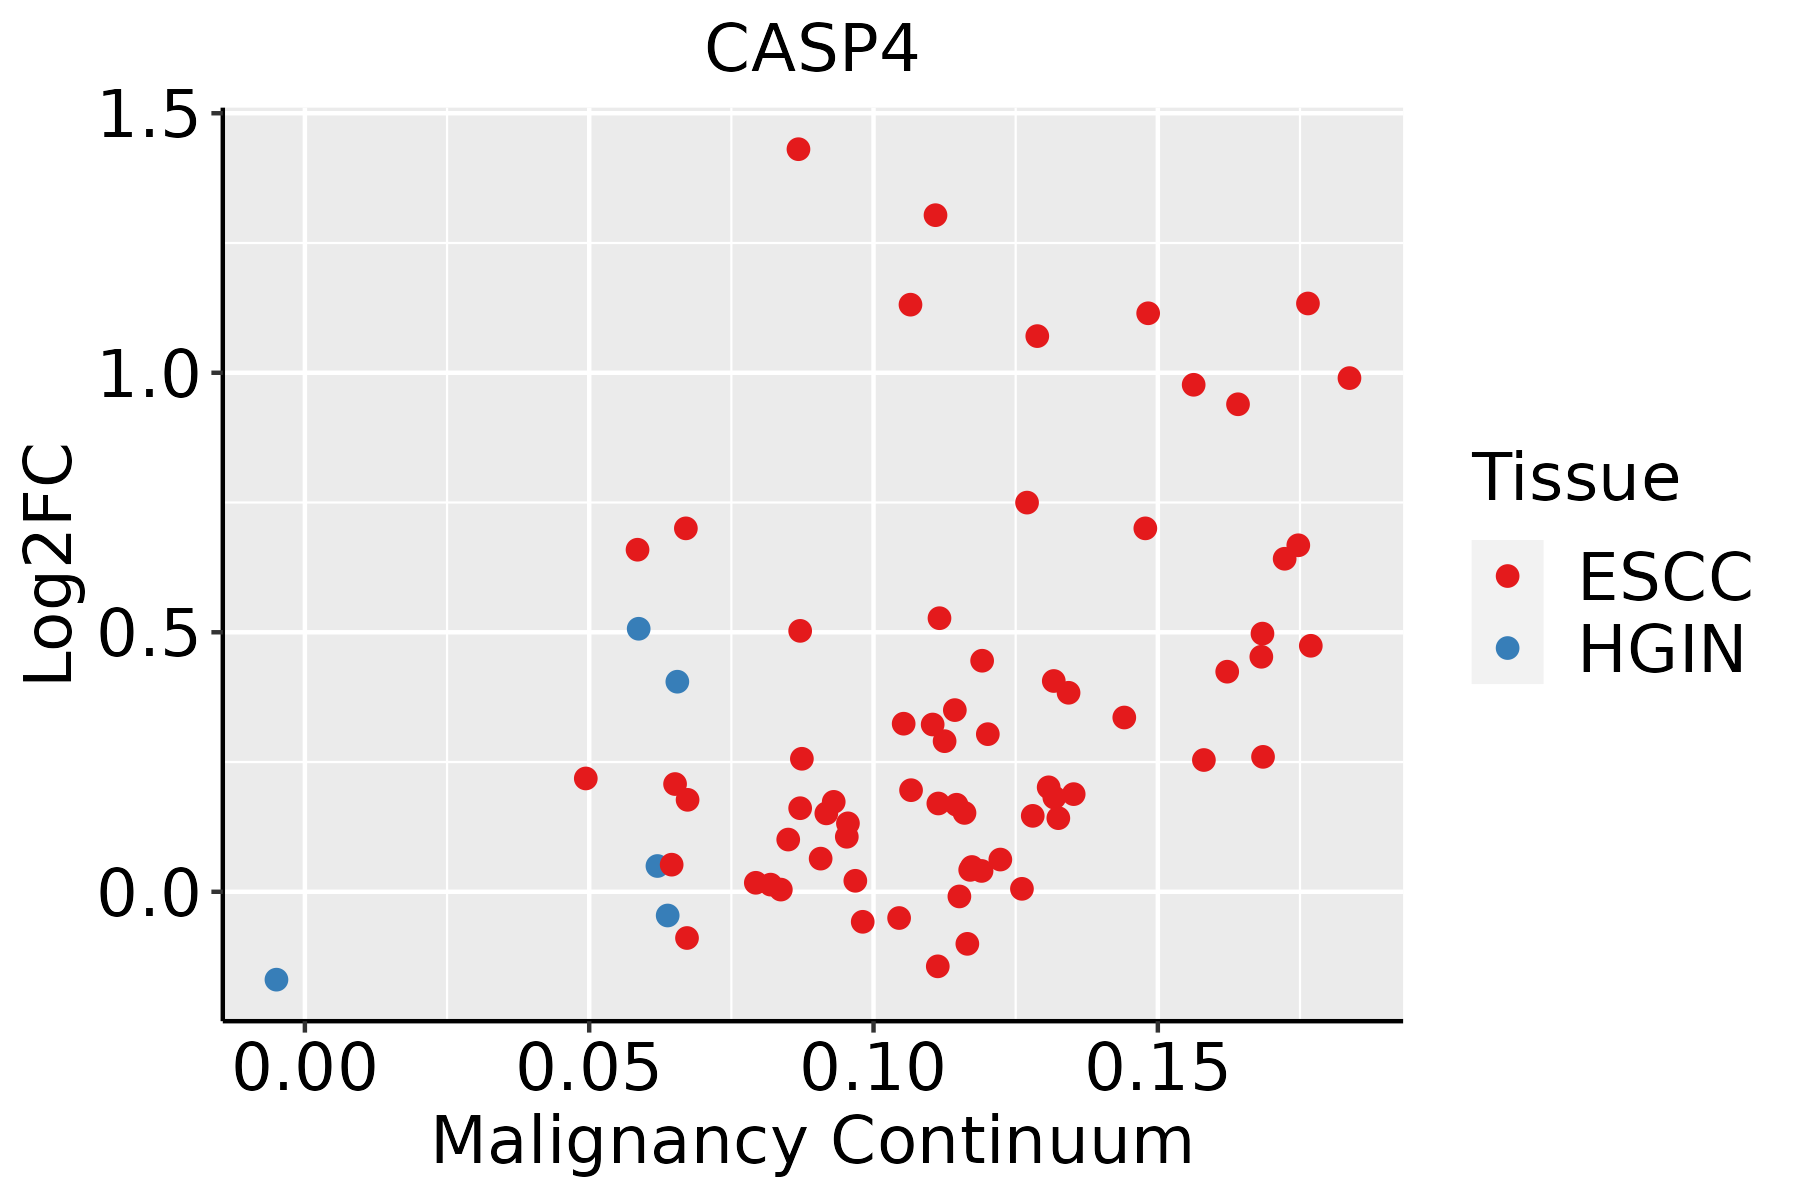 | ESCC: Esophageal squamous cell carcinoma |
| HGIN: High-grade intraepithelial neoplasias | ||
| LGIN: Low-grade intraepithelial neoplasias | ||
| Liver | 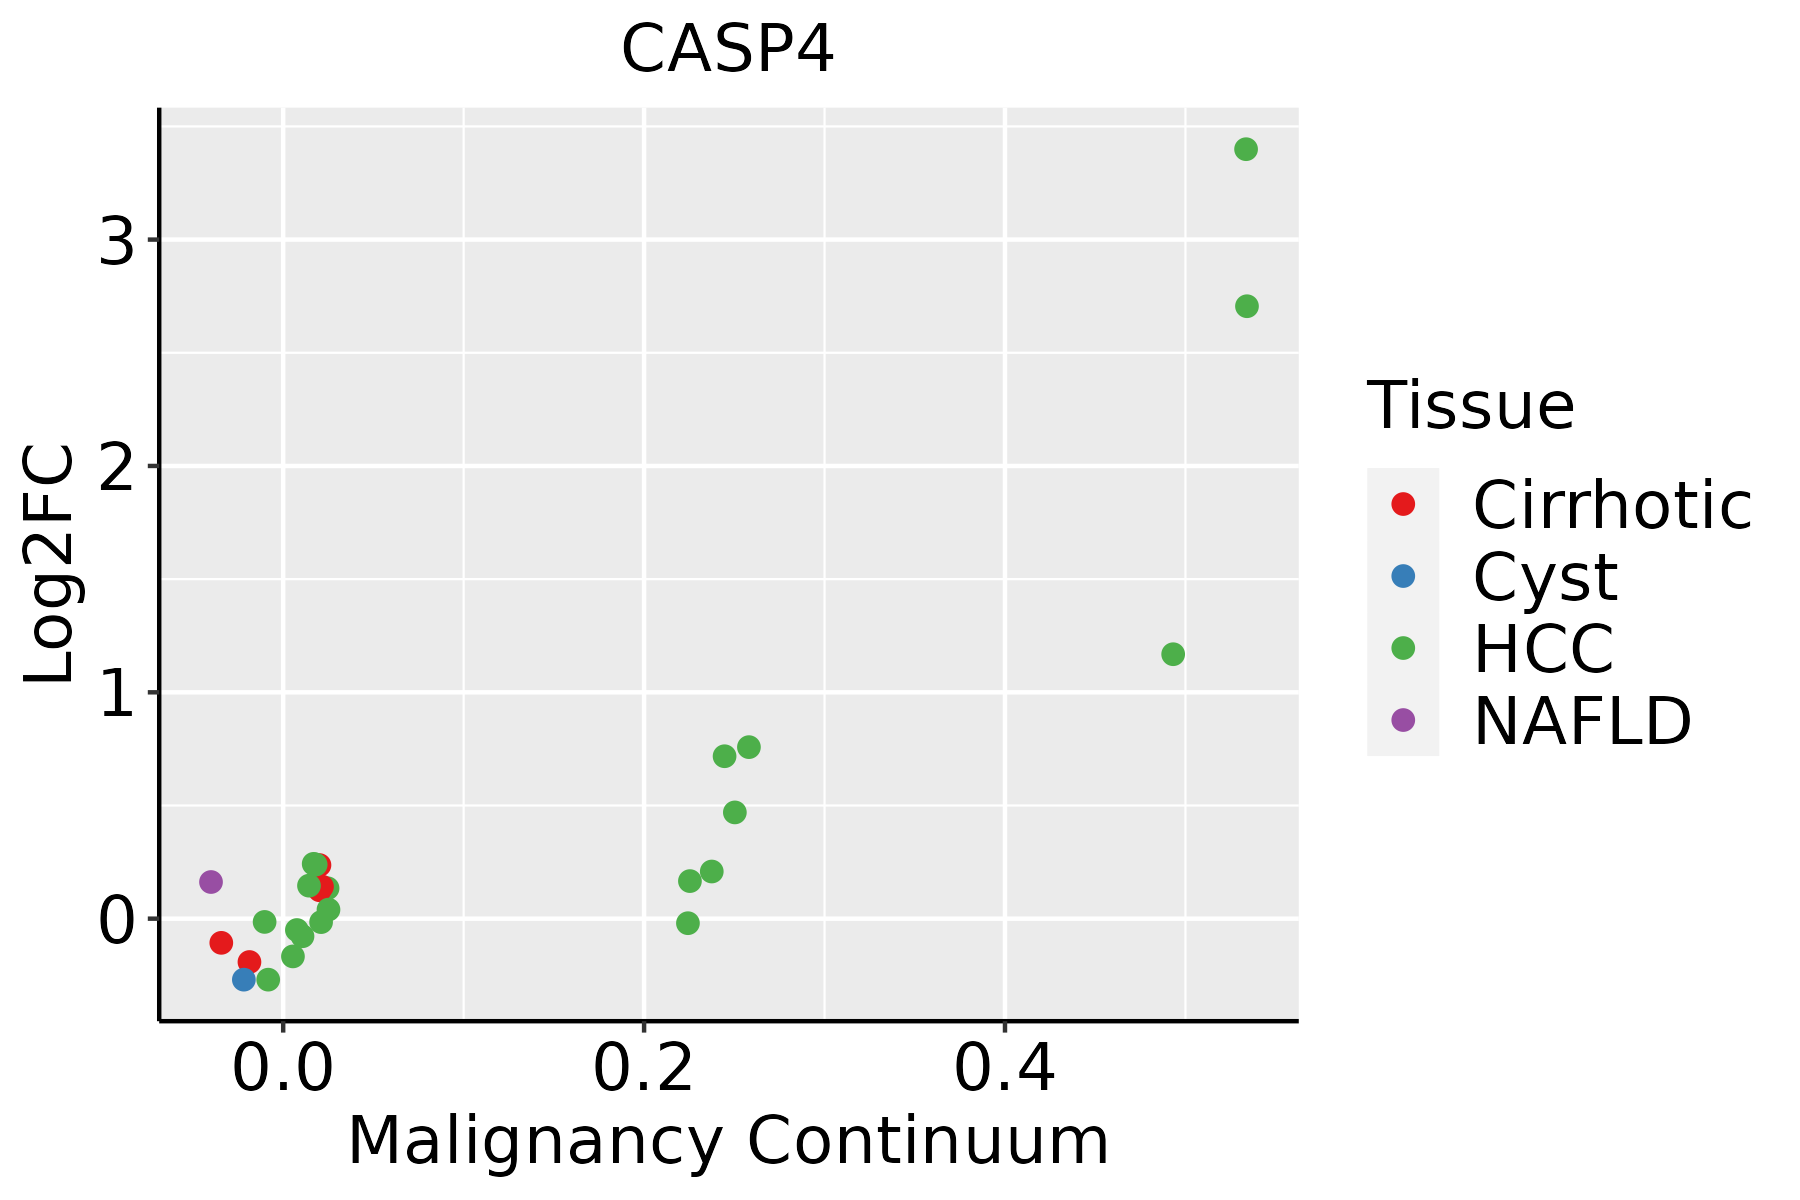 | HCC: Hepatocellular carcinoma |
| NAFLD: Non-alcoholic fatty liver disease | ||
| Oral Cavity |  | EOLP: Erosive Oral lichen planus |
| LP: leukoplakia | ||
| NEOLP: Non-erosive oral lichen planus | ||
| OSCC: Oral squamous cell carcinoma | ||
| Skin | 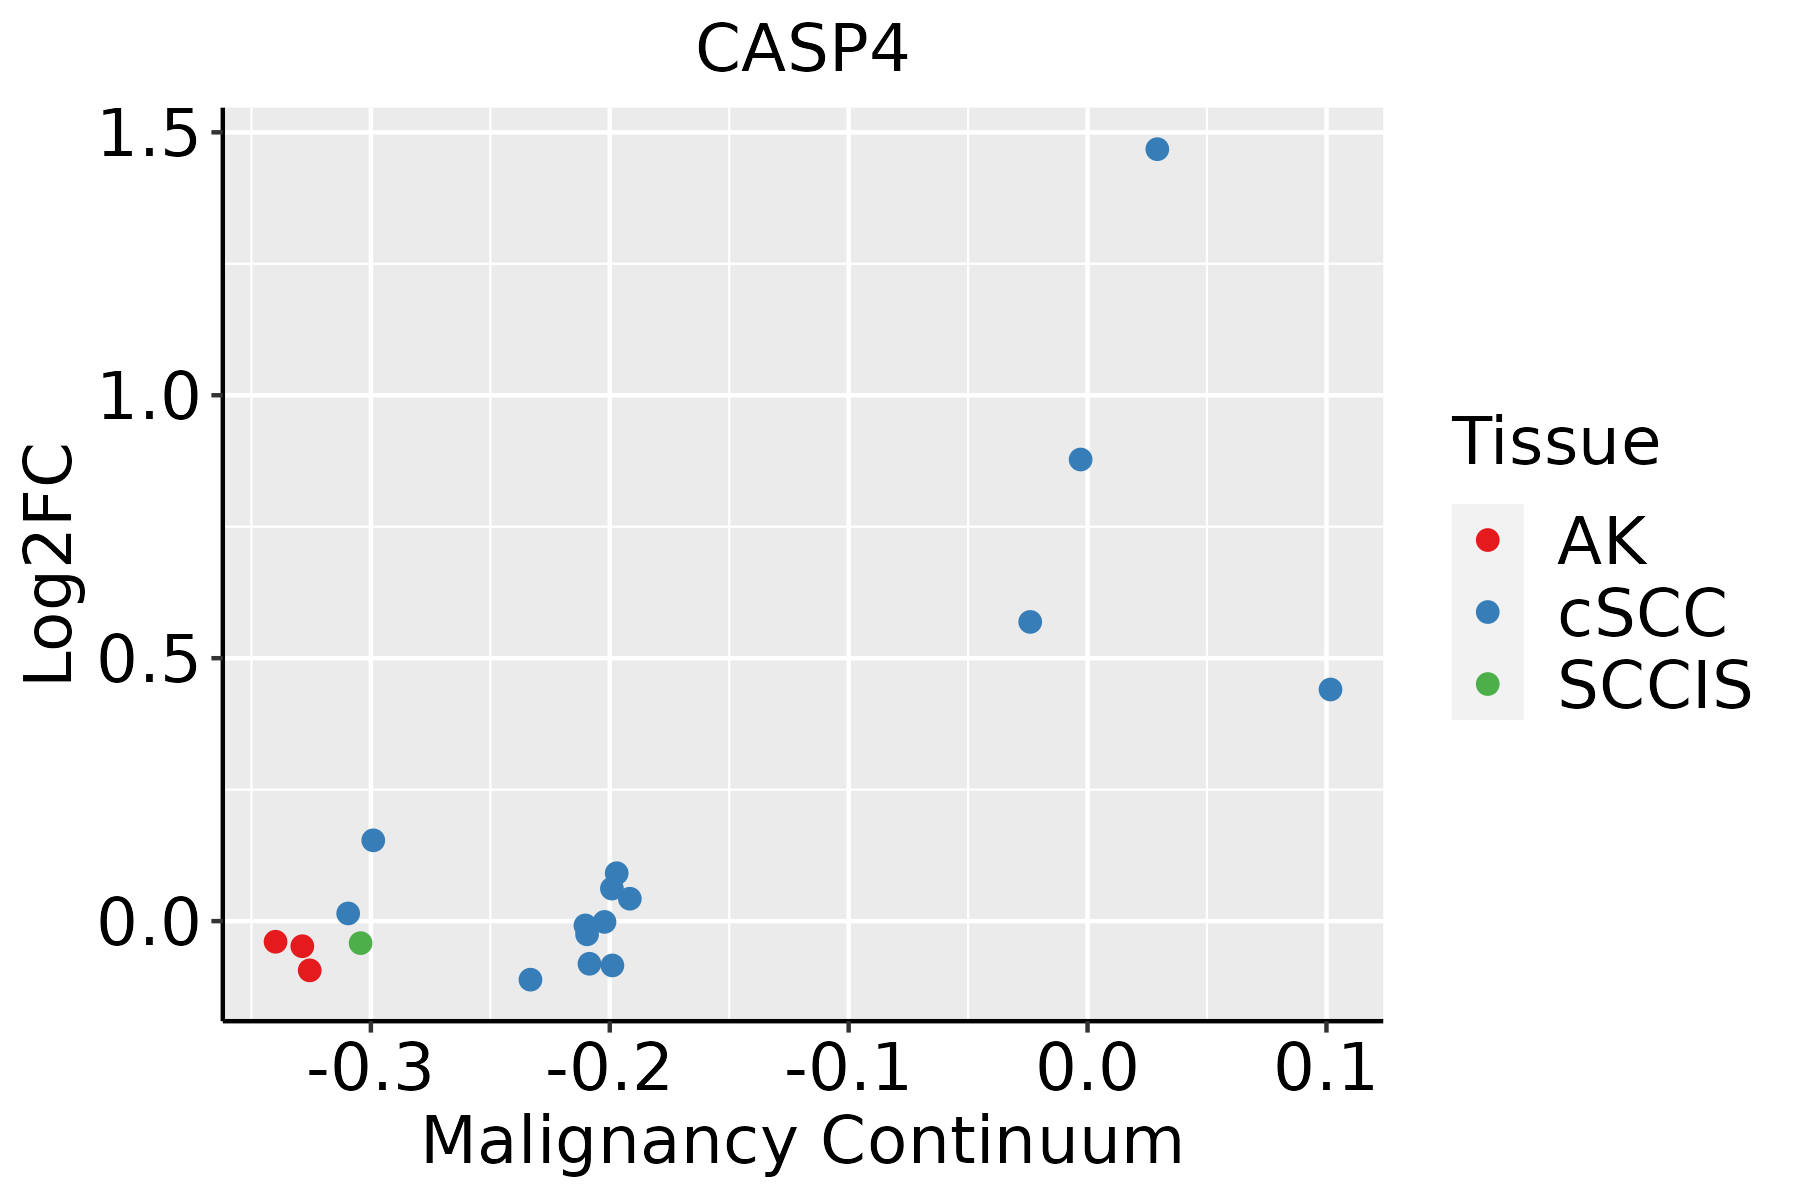 | AK: Actinic keratosis |
| cSCC: Cutaneous squamous cell carcinoma | ||
| SCCIS:squamous cell carcinoma in situ | ||
| Thyroid | 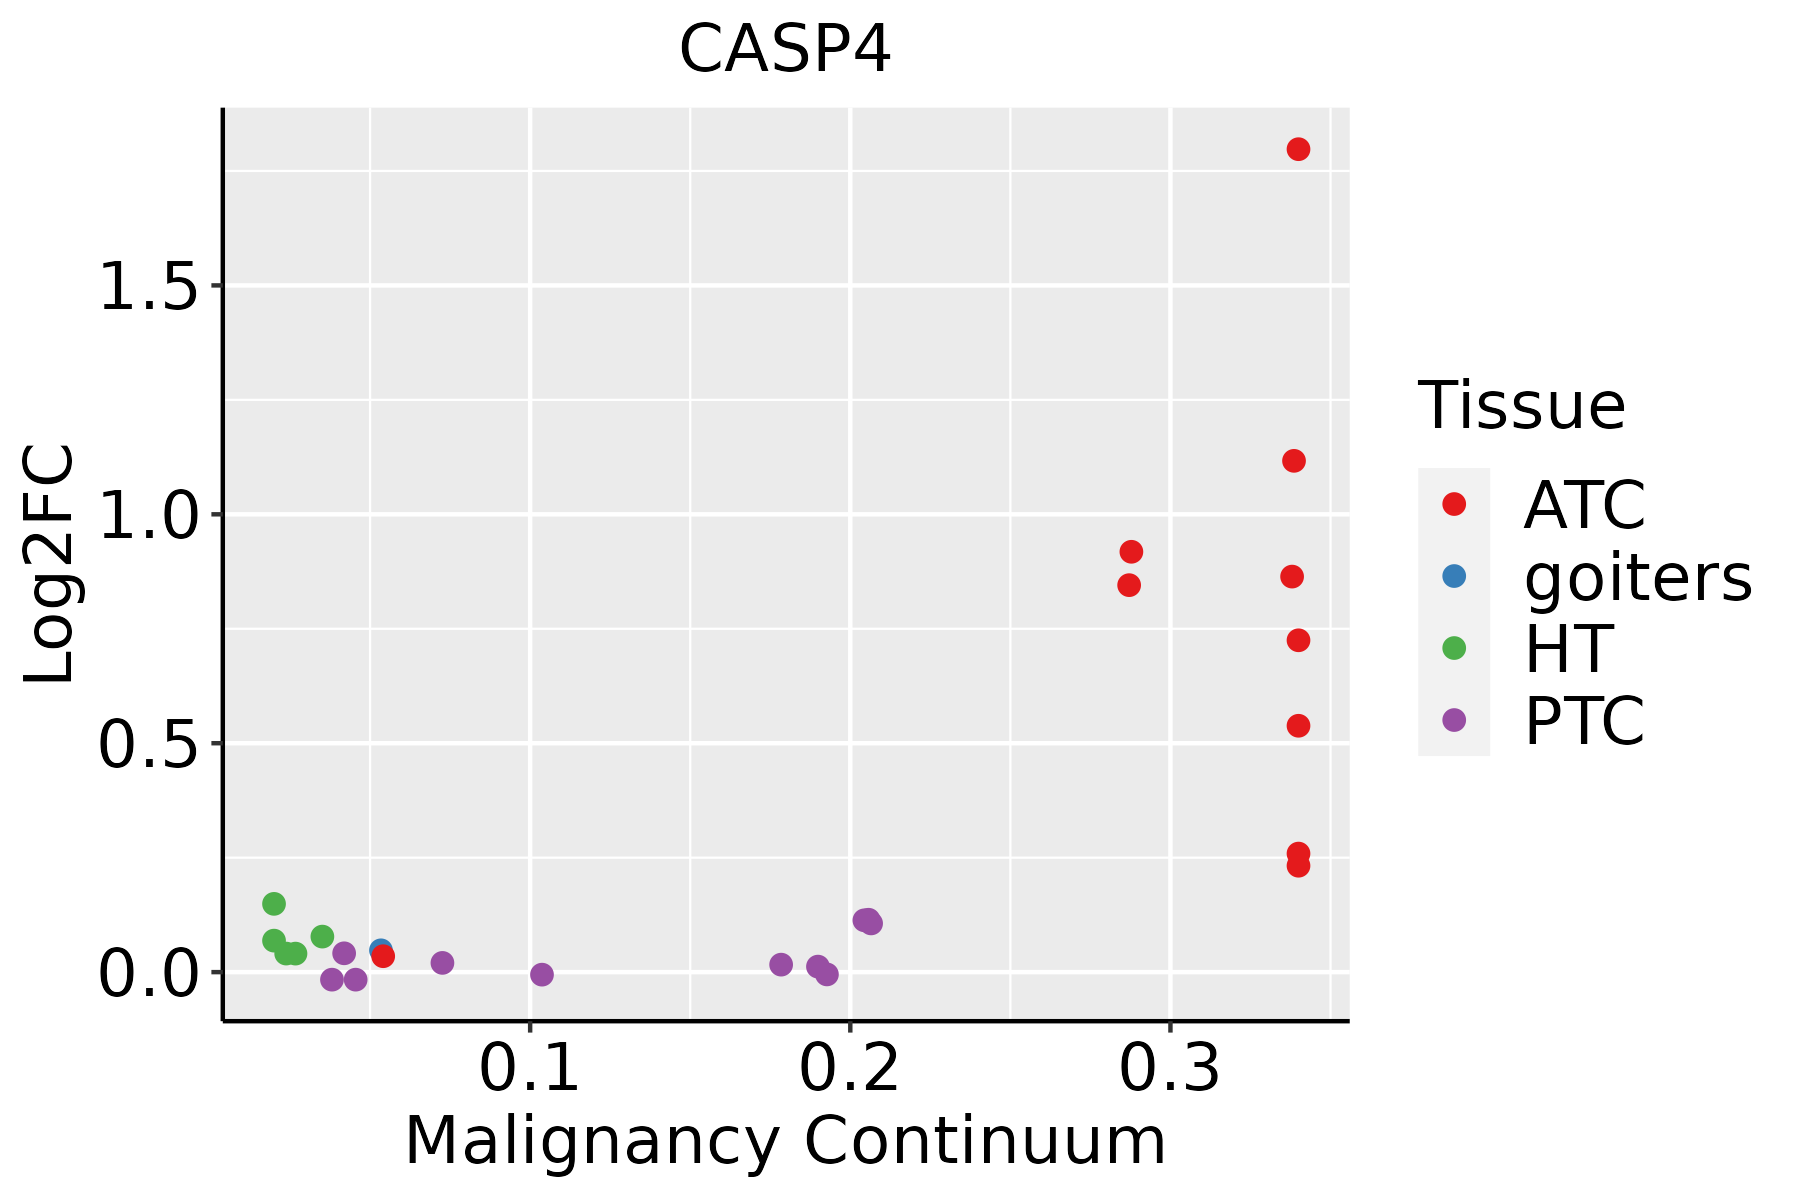 | ATC: Anaplastic thyroid cancer |
| HT: Hashimoto's thyroiditis | ||
| PTC: Papillary thyroid cancer |
| ∗log2FC in expression of this searched gene in stem-like cells from each diseased tissue sample relative to stem-like cells in normal samples in each tissue plotted against the malignancy continuum. Samples are colored based on if they are from different disease stage. |
Top |
Malignant transformation related pathway analysis |
| Find out the enriched GO biological processes and KEGG pathways involved in transition from healthy to precancer to cancer |
| Tissue | Disease Stage | Enriched GO biological Processes |
| Colorectum | AD |  |
| Colorectum | SER |  |
| Colorectum | MSS |  |
| Colorectum | MSI-H |  |
| Colorectum | FAP |  |
| ∗Top 15 enriched GO BP terms are showed in the bar plot of each disease state in each tissue. Each row represents a significant GO biological process which is colored according to the -log10(p.adjust). |
| Page: 1 2 3 4 5 6 7 8 9 |
| GO ID | Tissue | Disease Stage | Description | Gene Ratio | Bg Ratio | pvalue | p.adjust | Count |
| GO:009719327 | Esophagus | HGIN | intrinsic apoptotic signaling pathway | 90/2587 | 288/18723 | 1.50e-14 | 2.80e-12 | 90 |
| GO:003497625 | Esophagus | HGIN | response to endoplasmic reticulum stress | 81/2587 | 256/18723 | 1.47e-13 | 2.32e-11 | 81 |
| GO:007005920 | Esophagus | HGIN | intrinsic apoptotic signaling pathway in response to endoplasmic reticulum stress | 25/2587 | 63/18723 | 3.41e-07 | 1.57e-05 | 25 |
| GO:005160417 | Esophagus | HGIN | protein maturation | 68/2587 | 294/18723 | 9.77e-06 | 2.86e-04 | 68 |
| GO:00164857 | Esophagus | HGIN | protein processing | 49/2587 | 225/18723 | 7.04e-04 | 9.52e-03 | 49 |
| GO:003320910 | Esophagus | HGIN | tumor necrosis factor-mediated signaling pathway | 26/2587 | 99/18723 | 7.45e-04 | 9.90e-03 | 26 |
| GO:190165318 | Esophagus | HGIN | cellular response to peptide | 68/2587 | 359/18723 | 3.88e-03 | 3.54e-02 | 68 |
| GO:0097193111 | Esophagus | ESCC | intrinsic apoptotic signaling pathway | 222/8552 | 288/18723 | 5.87e-28 | 2.02e-25 | 222 |
| GO:0034976111 | Esophagus | ESCC | response to endoplasmic reticulum stress | 192/8552 | 256/18723 | 7.15e-22 | 1.30e-19 | 192 |
| GO:005160418 | Esophagus | ESCC | protein maturation | 189/8552 | 294/18723 | 7.64e-11 | 2.39e-09 | 189 |
| GO:0070059111 | Esophagus | ESCC | intrinsic apoptotic signaling pathway in response to endoplasmic reticulum stress | 50/8552 | 63/18723 | 4.37e-08 | 7.96e-07 | 50 |
| GO:190165319 | Esophagus | ESCC | cellular response to peptide | 208/8552 | 359/18723 | 1.68e-06 | 2.01e-05 | 208 |
| GO:00607595 | Esophagus | ESCC | regulation of response to cytokine stimulus | 103/8552 | 162/18723 | 3.14e-06 | 3.53e-05 | 103 |
| GO:003320914 | Esophagus | ESCC | tumor necrosis factor-mediated signaling pathway | 67/8552 | 99/18723 | 7.87e-06 | 7.72e-05 | 67 |
| GO:00019595 | Esophagus | ESCC | regulation of cytokine-mediated signaling pathway | 95/8552 | 150/18723 | 9.48e-06 | 9.04e-05 | 95 |
| GO:003461220 | Esophagus | ESCC | response to tumor necrosis factor | 149/8552 | 253/18723 | 1.47e-05 | 1.33e-04 | 149 |
| GO:001648514 | Esophagus | ESCC | protein processing | 134/8552 | 225/18723 | 1.81e-05 | 1.60e-04 | 134 |
| GO:007135620 | Esophagus | ESCC | cellular response to tumor necrosis factor | 132/8552 | 229/18723 | 1.69e-04 | 1.11e-03 | 132 |
| GO:00019615 | Esophagus | ESCC | positive regulation of cytokine-mediated signaling pathway | 35/8552 | 50/18723 | 4.33e-04 | 2.44e-03 | 35 |
| GO:00607605 | Esophagus | ESCC | positive regulation of response to cytokine stimulus | 39/8552 | 57/18723 | 4.34e-04 | 2.44e-03 | 39 |
| Page: 1 2 3 4 5 |
| Pathway ID | Tissue | Disease Stage | Description | Gene Ratio | Bg Ratio | pvalue | p.adjust | qvalue | Count |
| hsa0513139 | Esophagus | HGIN | Shigellosis | 71/1383 | 247/8465 | 4.89e-07 | 7.98e-06 | 6.34e-06 | 71 |
| hsa0513239 | Esophagus | HGIN | Salmonella infection | 69/1383 | 249/8465 | 3.02e-06 | 4.47e-05 | 3.55e-05 | 69 |
| hsa0513039 | Esophagus | HGIN | Pathogenic Escherichia coli infection | 54/1383 | 197/8465 | 4.91e-05 | 6.15e-04 | 4.89e-04 | 54 |
| hsa046219 | Esophagus | HGIN | NOD-like receptor signaling pathway | 45/1383 | 186/8465 | 3.40e-03 | 2.54e-02 | 2.02e-02 | 45 |
| hsa05131114 | Esophagus | HGIN | Shigellosis | 71/1383 | 247/8465 | 4.89e-07 | 7.98e-06 | 6.34e-06 | 71 |
| hsa05132115 | Esophagus | HGIN | Salmonella infection | 69/1383 | 249/8465 | 3.02e-06 | 4.47e-05 | 3.55e-05 | 69 |
| hsa05130115 | Esophagus | HGIN | Pathogenic Escherichia coli infection | 54/1383 | 197/8465 | 4.91e-05 | 6.15e-04 | 4.89e-04 | 54 |
| hsa0462114 | Esophagus | HGIN | NOD-like receptor signaling pathway | 45/1383 | 186/8465 | 3.40e-03 | 2.54e-02 | 2.02e-02 | 45 |
| hsa05132211 | Esophagus | ESCC | Salmonella infection | 191/4205 | 249/8465 | 6.51e-19 | 5.45e-17 | 2.79e-17 | 191 |
| hsa05131211 | Esophagus | ESCC | Shigellosis | 176/4205 | 247/8465 | 2.27e-12 | 4.01e-11 | 2.05e-11 | 176 |
| hsa05130211 | Esophagus | ESCC | Pathogenic Escherichia coli infection | 142/4205 | 197/8465 | 8.21e-11 | 1.06e-09 | 5.42e-10 | 142 |
| hsa0462122 | Esophagus | ESCC | NOD-like receptor signaling pathway | 116/4205 | 186/8465 | 2.90e-04 | 1.03e-03 | 5.30e-04 | 116 |
| hsa05132310 | Esophagus | ESCC | Salmonella infection | 191/4205 | 249/8465 | 6.51e-19 | 5.45e-17 | 2.79e-17 | 191 |
| hsa05131310 | Esophagus | ESCC | Shigellosis | 176/4205 | 247/8465 | 2.27e-12 | 4.01e-11 | 2.05e-11 | 176 |
| hsa05130310 | Esophagus | ESCC | Pathogenic Escherichia coli infection | 142/4205 | 197/8465 | 8.21e-11 | 1.06e-09 | 5.42e-10 | 142 |
| hsa0462132 | Esophagus | ESCC | NOD-like receptor signaling pathway | 116/4205 | 186/8465 | 2.90e-04 | 1.03e-03 | 5.30e-04 | 116 |
| hsa0513222 | Liver | Cirrhotic | Salmonella infection | 121/2530 | 249/8465 | 2.47e-10 | 5.13e-09 | 3.16e-09 | 121 |
| hsa0513022 | Liver | Cirrhotic | Pathogenic Escherichia coli infection | 88/2530 | 197/8465 | 6.48e-06 | 6.24e-05 | 3.84e-05 | 88 |
| hsa0513122 | Liver | Cirrhotic | Shigellosis | 105/2530 | 247/8465 | 1.31e-05 | 1.21e-04 | 7.48e-05 | 105 |
| hsa0513232 | Liver | Cirrhotic | Salmonella infection | 121/2530 | 249/8465 | 2.47e-10 | 5.13e-09 | 3.16e-09 | 121 |
| Page: 1 2 3 |
Top |
Cell-cell communication analysis |
| Identification of potential cell-cell interactions between two cell types and their ligand-receptor pairs for different disease states |
| Ligand | Receptor | LRpair | Pathway | Tissue | Disease Stage |
| Page: 1 |
Top |
Single-cell gene regulatory network inference analysis |
| Find out the significant the regulons (TFs) and the target genes of each regulon across cell types for different disease states |
| TF | Cell Type | Tissue | Disease Stage | Target Gene | RSS | Regulon Activity |
| ∗The dot plots of a searched regulon are shown for all cell subpopulations in each disease state of each tissue based on the regulon specific score inferred using pySCENIC and by calculating the average expression. |
| Page: 1 |
Top |
Somatic mutation of malignant transformation related genes |
| Annotation of somatic variants for genes involved in malignant transformation |
| Hugo Symbol | Variant Class | Variant Classification | dbSNP RS | HGVSc | HGVSp | HGVSp Short | SWISSPROT | BIOTYPE | SIFT | PolyPhen | Tumor Sample Barcode | Tissue | Histology | Sex | Age | Stage | Therapy Types | Drugs | Outcome |
| CASP4 | SNV | Missense_Mutation | c.36N>C | p.Lys12Asn | p.K12N | P49662 | protein_coding | tolerated(0.05) | benign(0.093) | TCGA-D8-A1JT-01 | Breast | breast invasive carcinoma | Female | >=65 | I/II | Hormone Therapy | arimidex | SD | |
| CASP4 | insertion | Frame_Shift_Ins | novel | c.930_931insA | p.Val311SerfsTer41 | p.V311Sfs*41 | P49662 | protein_coding | TCGA-A2-A0EV-01 | Breast | breast invasive carcinoma | Female | >=65 | I/II | Unknown | Unknown | SD | ||
| CASP4 | insertion | Nonsense_Mutation | novel | c.929_930insTCAGCCTTGGTGAGTGTTGAAAGTA | p.Val311GlnfsTer4 | p.V311Qfs*4 | P49662 | protein_coding | TCGA-A2-A0EV-01 | Breast | breast invasive carcinoma | Female | >=65 | I/II | Unknown | Unknown | SD | ||
| CASP4 | SNV | Missense_Mutation | novel | c.529N>A | p.Glu177Lys | p.E177K | P49662 | protein_coding | tolerated(0.28) | benign(0.029) | TCGA-2W-A8YY-01 | Cervix | cervical & endocervical cancer | Female | <65 | I/II | Chemotherapy | cisplatin | CR |
| CASP4 | SNV | Missense_Mutation | novel | c.886G>A | p.Val296Met | p.V296M | P49662 | protein_coding | deleterious(0.02) | possibly_damaging(0.605) | TCGA-AA-3947-01 | Colorectum | colon adenocarcinoma | Female | <65 | I/II | Unknown | Unknown | SD |
| CASP4 | SNV | Missense_Mutation | novel | c.815N>A | p.Pro272Gln | p.P272Q | P49662 | protein_coding | deleterious(0.02) | possibly_damaging(0.873) | TCGA-AA-3972-01 | Colorectum | colon adenocarcinoma | Male | >=65 | III/IV | Chemotherapy | capecitabine | PD |
| CASP4 | SNV | Missense_Mutation | novel | c.392G>T | p.Arg131Ile | p.R131I | P49662 | protein_coding | deleterious(0.02) | possibly_damaging(0.635) | TCGA-AZ-4315-01 | Colorectum | colon adenocarcinoma | Male | <65 | I/II | Unknown | Unknown | SD |
| CASP4 | SNV | Missense_Mutation | novel | c.1052N>C | p.Glu351Ala | p.E351A | P49662 | protein_coding | deleterious(0) | benign(0.43) | TCGA-CA-6717-01 | Colorectum | colon adenocarcinoma | Male | <65 | I/II | Chemotherapy | oxaliplatin | CR |
| CASP4 | SNV | Missense_Mutation | rs138280041 | c.676N>A | p.Pro226Thr | p.P226T | P49662 | protein_coding | deleterious(0.02) | benign(0.09) | TCGA-CA-6717-01 | Colorectum | colon adenocarcinoma | Male | <65 | I/II | Chemotherapy | oxaliplatin | CR |
| CASP4 | SNV | Missense_Mutation | c.262N>T | p.Ala88Ser | p.A88S | P49662 | protein_coding | tolerated(0.17) | benign(0.047) | TCGA-AG-A002-01 | Colorectum | rectum adenocarcinoma | Male | <65 | I/II | Unknown | Unknown | SD |
| Page: 1 2 3 4 5 6 |
Top |
Related drugs of malignant transformation related genes |
| Identification of chemicals and drugs interact with genes involved in malignant transfromation |
| (DGIdb 4.0) |
| Entrez ID | Symbol | Category | Interaction Types | Drug Claim Name | Drug Name | PMIDs |
| 837 | CASP4 | PROTEASE, DRUGGABLE GENOME, ENZYME | inhibitor | CHEMBL197672 | EMRICASAN | |
| 837 | CASP4 | PROTEASE, DRUGGABLE GENOME, ENZYME | inhibitor | 252166854 | ||
| 837 | CASP4 | PROTEASE, DRUGGABLE GENOME, ENZYME | inhibitor | 315661119 | ||
| 837 | CASP4 | PROTEASE, DRUGGABLE GENOME, ENZYME | inhibitor | 252166835 |
| Page: 1 |

Copyright 2023-Present -The University of Texas Health Science Center at Houston |