
|
|||||
|
 | |
| |
| |
| |
| |
| |
|
Gene: CASP3 |
Gene summary for CASP3 |
| Gene information | Species | Human | Gene symbol | CASP3 | Gene ID | 836 |
| Gene name | caspase 3 | |
| Gene Alias | CPP32 | |
| Cytomap | 4q35.1 | |
| Gene Type | protein-coding | GO ID | GO:0000003 | UniProtAcc | P42574 |
Top |
Malignant transformation analysis |
| Identification of the aberrant gene expression in precancerous and cancerous lesions by comparing the gene expression of stem-like cells in diseased tissues with normal stem cells |
| Entrez ID | Symbol | Replicates | Species | Organ | Tissue | Adj P-value | Log2FC | Malignancy |
| 836 | CASP3 | LZE4T | Human | Esophagus | ESCC | 1.09e-15 | 3.48e-01 | 0.0811 |
| 836 | CASP3 | LZE5T | Human | Esophagus | ESCC | 4.67e-03 | 5.99e-01 | 0.0514 |
| 836 | CASP3 | LZE7T | Human | Esophagus | ESCC | 4.23e-07 | 4.18e-01 | 0.0667 |
| 836 | CASP3 | LZE8T | Human | Esophagus | ESCC | 2.90e-08 | 2.39e-01 | 0.067 |
| 836 | CASP3 | LZE20T | Human | Esophagus | ESCC | 8.94e-04 | 7.98e-02 | 0.0662 |
| 836 | CASP3 | LZE22T | Human | Esophagus | ESCC | 2.25e-06 | 3.23e-01 | 0.068 |
| 836 | CASP3 | LZE24T | Human | Esophagus | ESCC | 1.45e-12 | 3.61e-01 | 0.0596 |
| 836 | CASP3 | LZE6T | Human | Esophagus | ESCC | 4.66e-06 | 2.65e-01 | 0.0845 |
| 836 | CASP3 | P2T-E | Human | Esophagus | ESCC | 2.84e-31 | 5.09e-01 | 0.1177 |
| 836 | CASP3 | P4T-E | Human | Esophagus | ESCC | 3.20e-15 | 4.62e-01 | 0.1323 |
| 836 | CASP3 | P5T-E | Human | Esophagus | ESCC | 4.26e-13 | 2.45e-01 | 0.1327 |
| 836 | CASP3 | P8T-E | Human | Esophagus | ESCC | 1.26e-16 | 3.89e-01 | 0.0889 |
| 836 | CASP3 | P9T-E | Human | Esophagus | ESCC | 5.21e-09 | 2.27e-01 | 0.1131 |
| 836 | CASP3 | P10T-E | Human | Esophagus | ESCC | 8.13e-16 | 1.82e-01 | 0.116 |
| 836 | CASP3 | P11T-E | Human | Esophagus | ESCC | 5.39e-19 | 4.90e-01 | 0.1426 |
| 836 | CASP3 | P12T-E | Human | Esophagus | ESCC | 8.53e-47 | 1.01e+00 | 0.1122 |
| 836 | CASP3 | P15T-E | Human | Esophagus | ESCC | 4.44e-23 | 4.65e-01 | 0.1149 |
| 836 | CASP3 | P16T-E | Human | Esophagus | ESCC | 6.18e-15 | 3.59e-01 | 0.1153 |
| 836 | CASP3 | P17T-E | Human | Esophagus | ESCC | 3.81e-03 | 2.26e-01 | 0.1278 |
| 836 | CASP3 | P19T-E | Human | Esophagus | ESCC | 2.78e-02 | 2.58e-01 | 0.1662 |
| Page: 1 2 3 4 5 6 |
| Tissue | Expression Dynamics | Abbreviation |
| Esophagus | 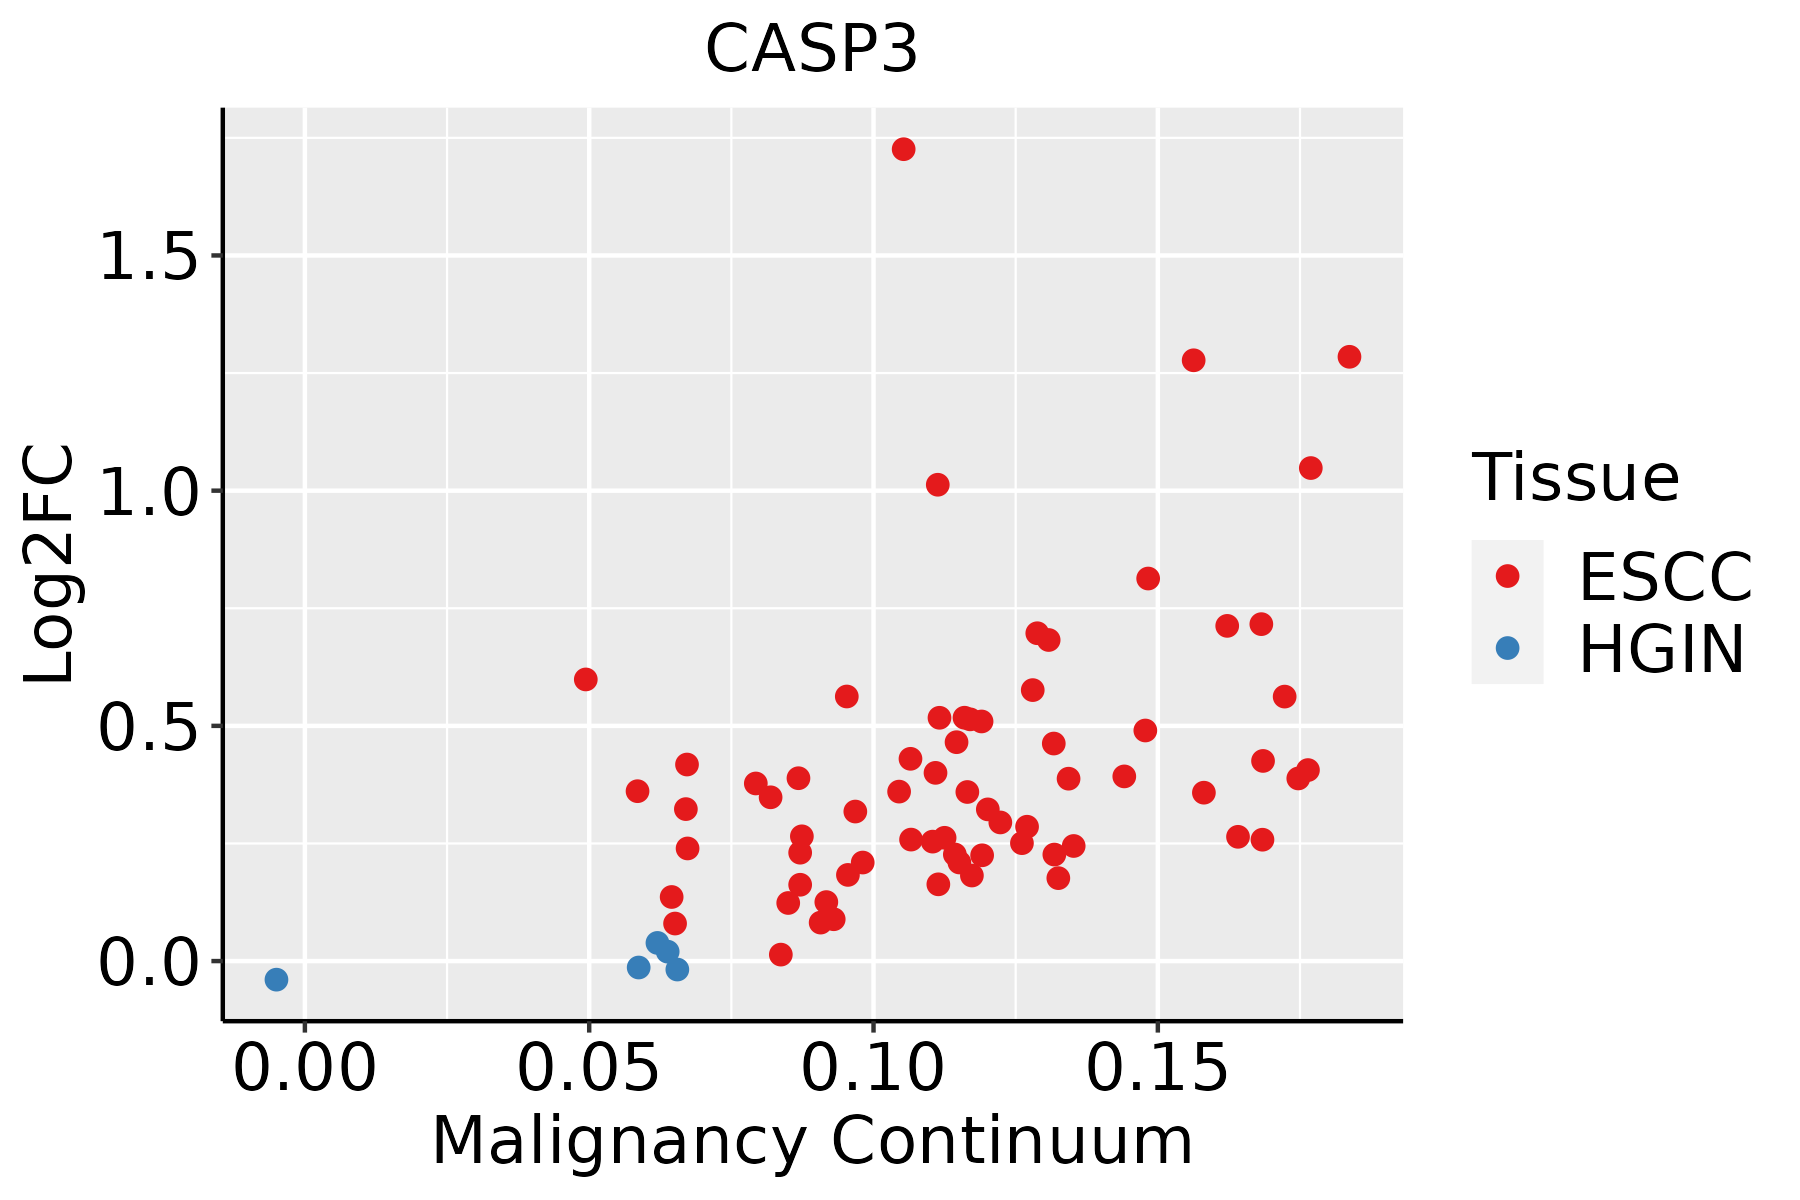 | ESCC: Esophageal squamous cell carcinoma |
| HGIN: High-grade intraepithelial neoplasias | ||
| LGIN: Low-grade intraepithelial neoplasias | ||
| Liver |  | HCC: Hepatocellular carcinoma |
| NAFLD: Non-alcoholic fatty liver disease | ||
| Oral Cavity |  | EOLP: Erosive Oral lichen planus |
| LP: leukoplakia | ||
| NEOLP: Non-erosive oral lichen planus | ||
| OSCC: Oral squamous cell carcinoma | ||
| Skin | 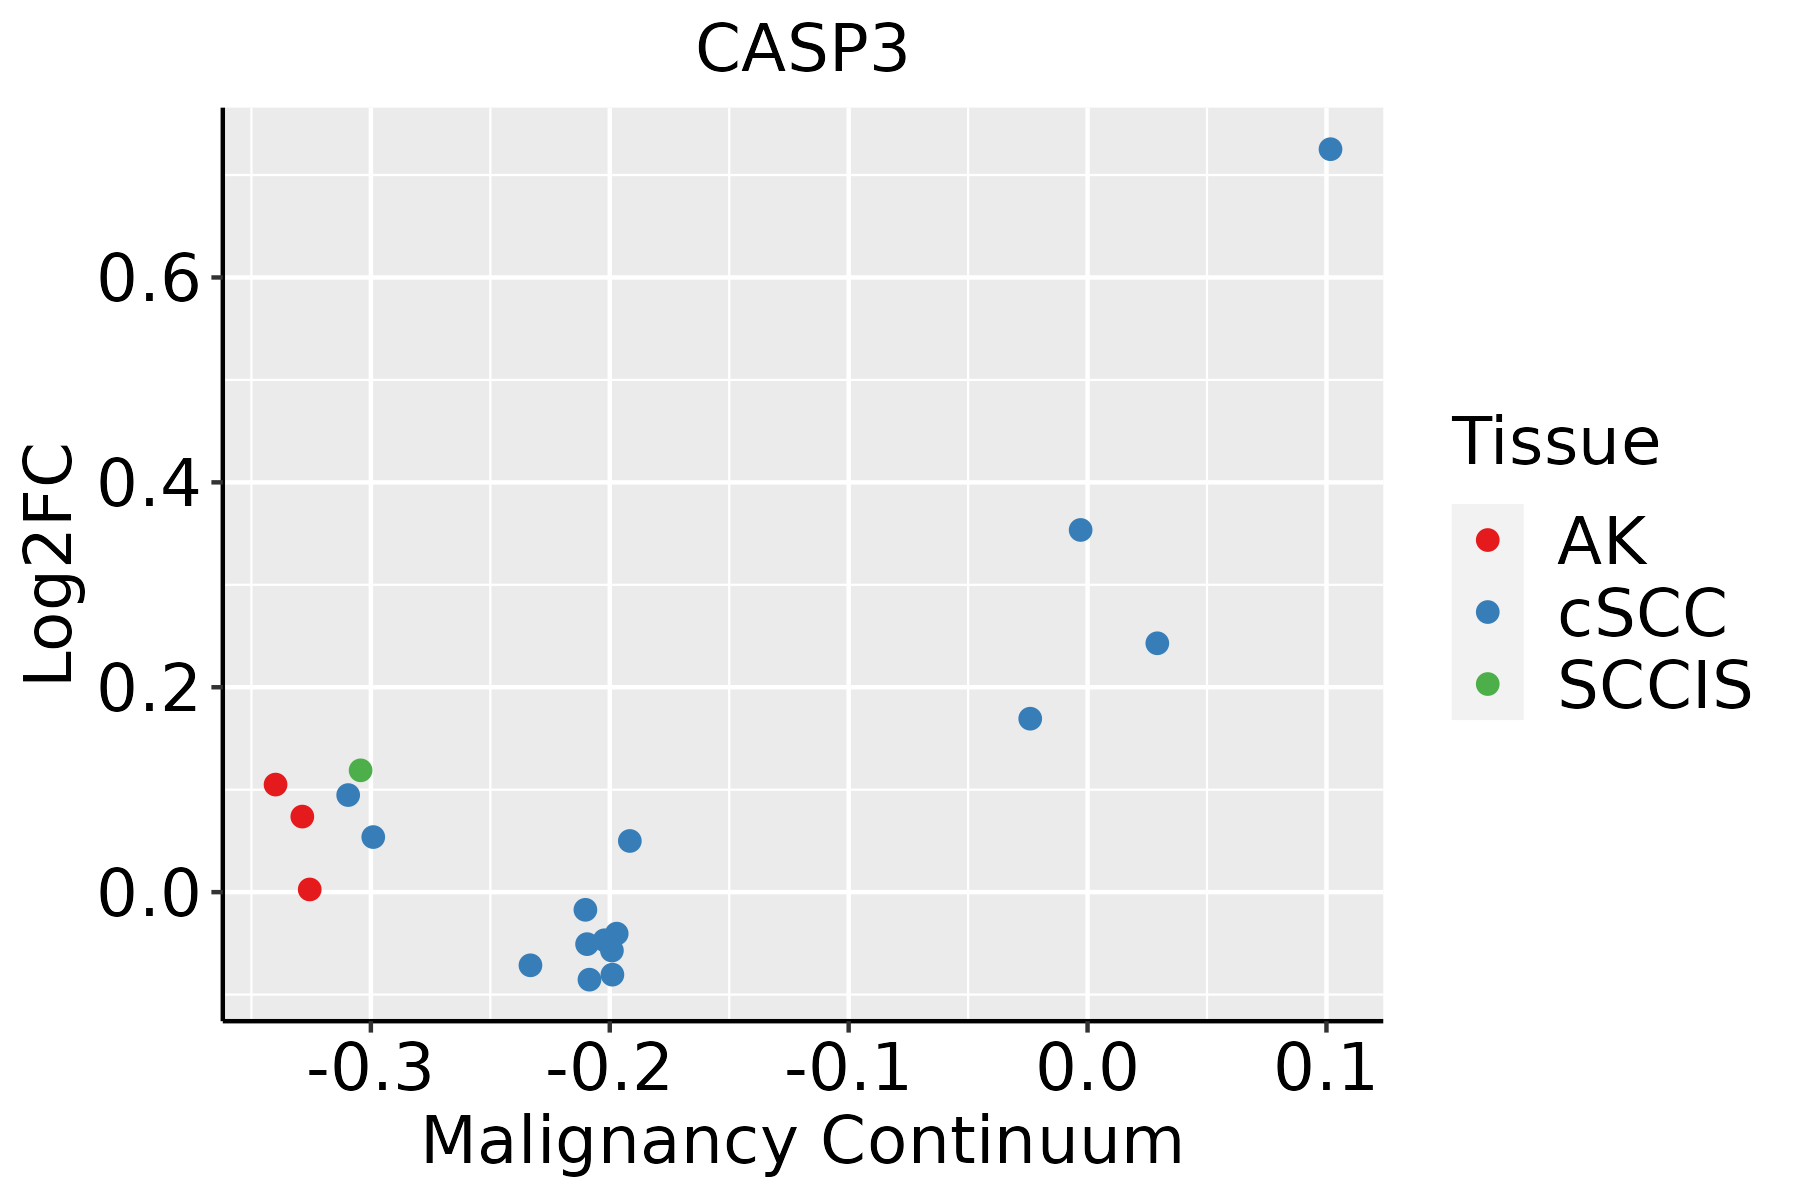 | AK: Actinic keratosis |
| cSCC: Cutaneous squamous cell carcinoma | ||
| SCCIS:squamous cell carcinoma in situ | ||
| Thyroid | 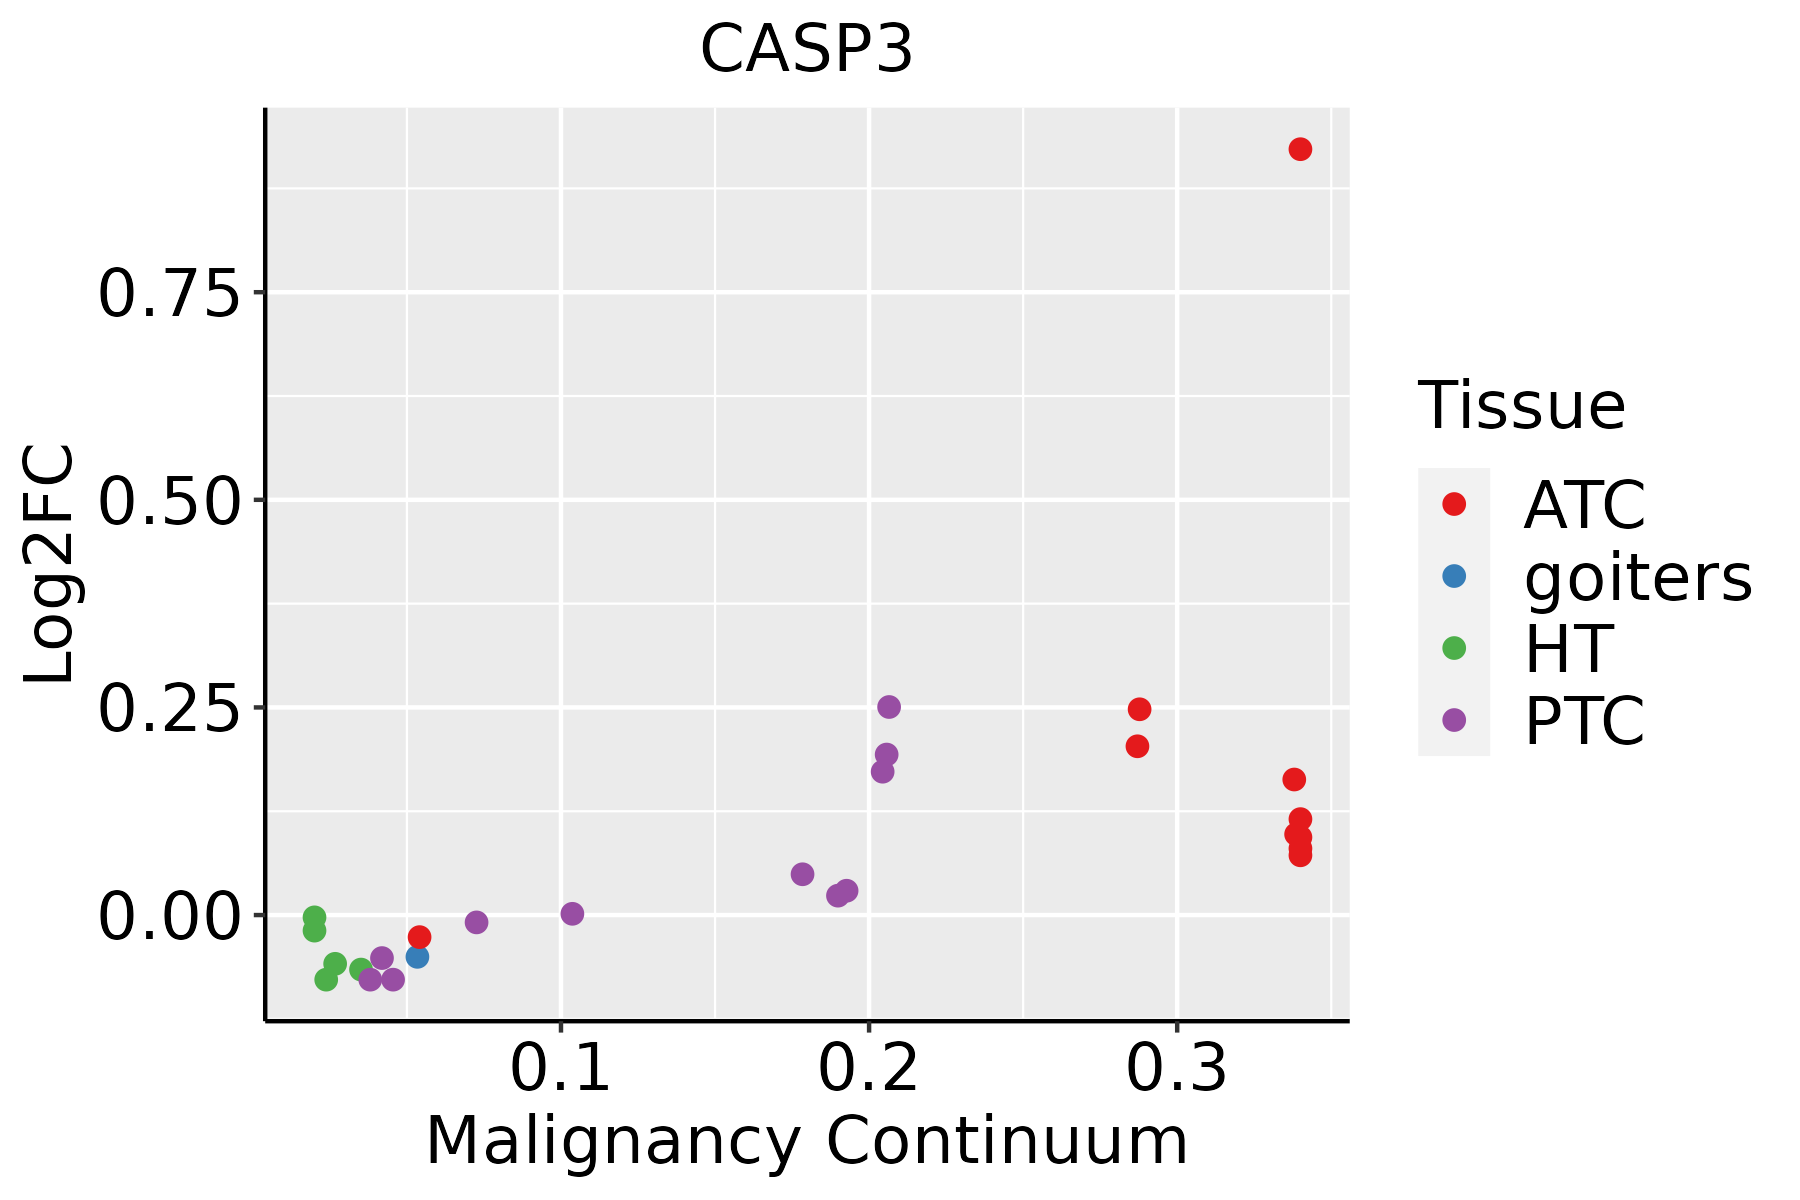 | ATC: Anaplastic thyroid cancer |
| HT: Hashimoto's thyroiditis | ||
| PTC: Papillary thyroid cancer |
| ∗log2FC in expression of this searched gene in stem-like cells from each diseased tissue sample relative to stem-like cells in normal samples in each tissue plotted against the malignancy continuum. Samples are colored based on if they are from different disease stage. |
Top |
Malignant transformation related pathway analysis |
| Find out the enriched GO biological processes and KEGG pathways involved in transition from healthy to precancer to cancer |
| Tissue | Disease Stage | Enriched GO biological Processes |
| Colorectum | AD |  |
| Colorectum | SER |  |
| Colorectum | MSS |  |
| Colorectum | MSI-H |  |
| Colorectum | FAP |  |
| ∗Top 15 enriched GO BP terms are showed in the bar plot of each disease state in each tissue. Each row represents a significant GO biological process which is colored according to the -log10(p.adjust). |
| Page: 1 2 3 4 5 6 7 8 9 |
| GO ID | Tissue | Disease Stage | Description | Gene Ratio | Bg Ratio | pvalue | p.adjust | Count |
| GO:0097193111 | Esophagus | ESCC | intrinsic apoptotic signaling pathway | 222/8552 | 288/18723 | 5.87e-28 | 2.02e-25 | 222 |
| GO:0031647111 | Esophagus | ESCC | regulation of protein stability | 223/8552 | 298/18723 | 5.76e-25 | 1.52e-22 | 223 |
| GO:001623617 | Esophagus | ESCC | macroautophagy | 216/8552 | 291/18723 | 1.94e-23 | 4.57e-21 | 216 |
| GO:0006979111 | Esophagus | ESCC | response to oxidative stress | 303/8552 | 446/18723 | 7.15e-22 | 1.30e-19 | 303 |
| GO:0062197111 | Esophagus | ESCC | cellular response to chemical stress | 234/8552 | 337/18723 | 5.37e-19 | 5.97e-17 | 234 |
| GO:001050617 | Esophagus | ESCC | regulation of autophagy | 220/8552 | 317/18723 | 6.72e-18 | 6.36e-16 | 220 |
| GO:000941113 | Esophagus | ESCC | response to UV | 115/8552 | 149/18723 | 3.29e-15 | 1.93e-13 | 115 |
| GO:0034250111 | Esophagus | ESCC | positive regulation of cellular amide metabolic process | 123/8552 | 162/18723 | 3.32e-15 | 1.93e-13 | 123 |
| GO:001021217 | Esophagus | ESCC | response to ionizing radiation | 110/8552 | 148/18723 | 1.11e-12 | 4.78e-11 | 110 |
| GO:0010563111 | Esophagus | ESCC | negative regulation of phosphorus metabolic process | 274/8552 | 442/18723 | 2.32e-12 | 9.41e-11 | 274 |
| GO:0045936111 | Esophagus | ESCC | negative regulation of phosphate metabolic process | 273/8552 | 441/18723 | 3.18e-12 | 1.25e-10 | 273 |
| GO:0051348111 | Esophagus | ESCC | negative regulation of transferase activity | 177/8552 | 268/18723 | 1.08e-11 | 4.00e-10 | 177 |
| GO:007190016 | Esophagus | ESCC | regulation of protein serine/threonine kinase activity | 227/8552 | 359/18723 | 1.12e-11 | 4.10e-10 | 227 |
| GO:0000302111 | Esophagus | ESCC | response to reactive oxygen species | 150/8552 | 222/18723 | 3.06e-11 | 1.02e-09 | 150 |
| GO:000931419 | Esophagus | ESCC | response to radiation | 277/8552 | 456/18723 | 4.42e-11 | 1.43e-09 | 277 |
| GO:0070482111 | Esophagus | ESCC | response to oxygen levels | 218/8552 | 347/18723 | 6.91e-11 | 2.17e-09 | 218 |
| GO:005160418 | Esophagus | ESCC | protein maturation | 189/8552 | 294/18723 | 7.64e-11 | 2.39e-09 | 189 |
| GO:001624114 | Esophagus | ESCC | regulation of macroautophagy | 102/8552 | 141/18723 | 1.09e-10 | 3.27e-09 | 102 |
| GO:0042326111 | Esophagus | ESCC | negative regulation of phosphorylation | 237/8552 | 385/18723 | 1.86e-10 | 5.33e-09 | 237 |
| GO:0001933111 | Esophagus | ESCC | negative regulation of protein phosphorylation | 213/8552 | 342/18723 | 3.54e-10 | 9.76e-09 | 213 |
| Page: 1 2 3 4 5 6 7 8 9 10 11 12 13 14 15 16 17 18 19 20 21 22 23 24 25 26 27 |
| Pathway ID | Tissue | Disease Stage | Description | Gene Ratio | Bg Ratio | pvalue | p.adjust | qvalue | Count |
| hsa05014210 | Esophagus | ESCC | Amyotrophic lateral sclerosis | 266/4205 | 364/8465 | 1.31e-20 | 2.20e-18 | 1.13e-18 | 266 |
| hsa05132211 | Esophagus | ESCC | Salmonella infection | 191/4205 | 249/8465 | 6.51e-19 | 5.45e-17 | 2.79e-17 | 191 |
| hsa05016210 | Esophagus | ESCC | Huntington disease | 226/4205 | 306/8465 | 1.38e-18 | 8.72e-17 | 4.46e-17 | 226 |
| hsa05012211 | Esophagus | ESCC | Parkinson disease | 201/4205 | 266/8465 | 1.56e-18 | 8.72e-17 | 4.46e-17 | 201 |
| hsa05022210 | Esophagus | ESCC | Pathways of neurodegeneration - multiple diseases | 318/4205 | 476/8465 | 6.10e-15 | 2.04e-13 | 1.05e-13 | 318 |
| hsa05010210 | Esophagus | ESCC | Alzheimer disease | 263/4205 | 384/8465 | 1.80e-14 | 5.47e-13 | 2.80e-13 | 263 |
| hsa04932210 | Esophagus | ESCC | Non-alcoholic fatty liver disease | 122/4205 | 155/8465 | 5.69e-14 | 1.59e-12 | 8.14e-13 | 122 |
| hsa05169210 | Esophagus | ESCC | Epstein-Barr virus infection | 151/4205 | 202/8465 | 1.55e-13 | 3.45e-12 | 1.77e-12 | 151 |
| hsa05020210 | Esophagus | ESCC | Prion disease | 193/4205 | 273/8465 | 6.42e-13 | 1.34e-11 | 6.89e-12 | 193 |
| hsa0411524 | Esophagus | ESCC | p53 signaling pathway | 65/4205 | 74/8465 | 3.88e-12 | 6.50e-11 | 3.33e-11 | 65 |
| hsa05130211 | Esophagus | ESCC | Pathogenic Escherichia coli infection | 142/4205 | 197/8465 | 8.21e-11 | 1.06e-09 | 5.42e-10 | 142 |
| hsa0466810 | Esophagus | ESCC | TNF signaling pathway | 89/4205 | 114/8465 | 3.36e-10 | 4.01e-09 | 2.06e-09 | 89 |
| hsa0421027 | Esophagus | ESCC | Apoptosis | 102/4205 | 136/8465 | 1.05e-09 | 1.21e-08 | 6.21e-09 | 102 |
| hsa05170210 | Esophagus | ESCC | Human immunodeficiency virus 1 infection | 147/4205 | 212/8465 | 3.37e-09 | 3.53e-08 | 1.81e-08 | 147 |
| hsa0521020 | Esophagus | ESCC | Colorectal cancer | 69/4205 | 86/8465 | 4.06e-09 | 4.13e-08 | 2.11e-08 | 69 |
| hsa05167211 | Esophagus | ESCC | Kaposi sarcoma-associated herpesvirus infection | 136/4205 | 194/8465 | 4.28e-09 | 4.22e-08 | 2.16e-08 | 136 |
| hsa0516425 | Esophagus | ESCC | Influenza A | 122/4205 | 171/8465 | 5.01e-09 | 4.79e-08 | 2.45e-08 | 122 |
| hsa0516510 | Esophagus | ESCC | Human papillomavirus infection | 215/4205 | 331/8465 | 7.86e-09 | 7.12e-08 | 3.65e-08 | 215 |
| hsa0520529 | Esophagus | ESCC | Proteoglycans in cancer | 138/4205 | 205/8465 | 1.79e-07 | 1.40e-06 | 7.15e-07 | 138 |
| hsa0520325 | Esophagus | ESCC | Viral carcinogenesis | 137/4205 | 204/8465 | 2.47e-07 | 1.88e-06 | 9.62e-07 | 137 |
| Page: 1 2 3 4 5 6 7 8 9 10 11 |
Top |
Cell-cell communication analysis |
| Identification of potential cell-cell interactions between two cell types and their ligand-receptor pairs for different disease states |
| Ligand | Receptor | LRpair | Pathway | Tissue | Disease Stage |
| Page: 1 |
Top |
Single-cell gene regulatory network inference analysis |
| Find out the significant the regulons (TFs) and the target genes of each regulon across cell types for different disease states |
| TF | Cell Type | Tissue | Disease Stage | Target Gene | RSS | Regulon Activity |
| ∗The dot plots of a searched regulon are shown for all cell subpopulations in each disease state of each tissue based on the regulon specific score inferred using pySCENIC and by calculating the average expression. |
| Page: 1 |
Top |
Somatic mutation of malignant transformation related genes |
| Annotation of somatic variants for genes involved in malignant transformation |
| Hugo Symbol | Variant Class | Variant Classification | dbSNP RS | HGVSc | HGVSp | HGVSp Short | SWISSPROT | BIOTYPE | SIFT | PolyPhen | Tumor Sample Barcode | Tissue | Histology | Sex | Age | Stage | Therapy Types | Drugs | Outcome |
| CASP3 | SNV | Missense_Mutation | novel | c.576N>A | p.Asp192Glu | p.D192E | P42574 | protein_coding | deleterious(0) | probably_damaging(0.992) | TCGA-A7-A6VW-01 | Breast | breast invasive carcinoma | Female | <65 | I/II | Chemotherapy | doxorubicin | CR |
| CASP3 | deletion | Frame_Shift_Del | c.768_799delNNNNNNNNNNNNNNNNNNNNNNNNNNNNNNNN | p.Lys259HisfsTer19 | p.K259Hfs*19 | P42574 | protein_coding | TCGA-AN-A0XN-01 | Breast | breast invasive carcinoma | Female | >=65 | III/IV | Unknown | Unknown | SD | |||
| CASP3 | SNV | Missense_Mutation | c.768T>G | p.Phe256Leu | p.F256L | P42574 | protein_coding | tolerated(0.07) | benign(0.232) | TCGA-2W-A8YY-01 | Cervix | cervical & endocervical cancer | Female | <65 | I/II | Chemotherapy | cisplatin | CR | |
| CASP3 | SNV | Missense_Mutation | c.517N>C | p.Glu173Gln | p.E173Q | P42574 | protein_coding | tolerated(0.37) | possibly_damaging(0.585) | TCGA-JW-A5VL-01 | Cervix | cervical & endocervical cancer | Female | <65 | I/II | Unknown | Unknown | SD | |
| CASP3 | SNV | Missense_Mutation | c.159G>T | p.Lys53Asn | p.K53N | P42574 | protein_coding | deleterious(0) | probably_damaging(0.99) | TCGA-A6-6141-01 | Colorectum | colon adenocarcinoma | Male | <65 | I/II | Chemotherapy | 5-fu | SD | |
| CASP3 | SNV | Missense_Mutation | novel | c.428N>C | p.Phe143Ser | p.F143S | P42574 | protein_coding | deleterious(0) | probably_damaging(0.993) | TCGA-AG-A002-01 | Colorectum | rectum adenocarcinoma | Male | <65 | I/II | Unknown | Unknown | SD |
| CASP3 | SNV | Missense_Mutation | c.491G>A | p.Arg164His | p.R164H | P42574 | protein_coding | deleterious(0) | possibly_damaging(0.811) | TCGA-A5-A0GG-01 | Endometrium | uterine corpus endometrioid carcinoma | Female | >=65 | I/II | Unknown | Unknown | SD | |
| CASP3 | SNV | Missense_Mutation | novel | c.184N>G | p.Thr62Ala | p.T62A | P42574 | protein_coding | tolerated(0.74) | benign(0.001) | TCGA-AJ-A3EL-01 | Endometrium | uterine corpus endometrioid carcinoma | Female | <65 | I/II | Unknown | Unknown | SD |
| CASP3 | SNV | Missense_Mutation | rs776881401 | c.73N>A | p.Glu25Lys | p.E25K | P42574 | protein_coding | tolerated(1) | benign(0) | TCGA-AJ-A3EL-01 | Endometrium | uterine corpus endometrioid carcinoma | Female | <65 | I/II | Unknown | Unknown | SD |
| CASP3 | SNV | Missense_Mutation | novel | c.34N>G | p.Ser12Ala | p.S12A | P42574 | protein_coding | tolerated(0.07) | benign(0.001) | TCGA-AJ-A3EL-01 | Endometrium | uterine corpus endometrioid carcinoma | Female | <65 | I/II | Unknown | Unknown | SD |
| Page: 1 2 3 4 |
Top |
Related drugs of malignant transformation related genes |
| Identification of chemicals and drugs interact with genes involved in malignant transfromation |
| (DGIdb 4.0) |
| Entrez ID | Symbol | Category | Interaction Types | Drug Claim Name | Drug Name | PMIDs |
| 836 | CASP3 | DRUGGABLE GENOME, PROTEASE, ENZYME | celecoxib | CELECOXIB | 22336956 | |
| 836 | CASP3 | DRUGGABLE GENOME, PROTEASE, ENZYME | SPERMINE | SPERMINE | 18366176 | |
| 836 | CASP3 | DRUGGABLE GENOME, PROTEASE, ENZYME | activator | 178101922 | ||
| 836 | CASP3 | DRUGGABLE GENOME, PROTEASE, ENZYME | PACLITAXEL | PACLITAXEL | 9067280 | |
| 836 | CASP3 | DRUGGABLE GENOME, PROTEASE, ENZYME | AICAR | CHEMBL483849 | 17181154 | |
| 836 | CASP3 | DRUGGABLE GENOME, PROTEASE, ENZYME | WITHAFERIN A | WITHAFERIN A | 22705001 | |
| 836 | CASP3 | DRUGGABLE GENOME, PROTEASE, ENZYME | inhibitor | 178103141 | ||
| 836 | CASP3 | DRUGGABLE GENOME, PROTEASE, ENZYME | IPRIFLAVONE | IPRIFLAVONE | ||
| 836 | CASP3 | DRUGGABLE GENOME, PROTEASE, ENZYME | 1,4-DICHLOROBENZENE | 1,4-DICHLOROBENZENE | 16699520 | |
| 836 | CASP3 | DRUGGABLE GENOME, PROTEASE, ENZYME | 5,6,7-TRIBROMOISATIN | CHEMBL376616 | 17088067 |
| Page: 1 2 3 4 5 |

Copyright 2023-Present -The University of Texas Health Science Center at Houston |