
|
|||||
|
 | |
| |
| |
| |
| |
| |
|
Gene: CASP14 |
Gene summary for CASP14 |
| Gene information | Species | Human | Gene symbol | CASP14 | Gene ID | 23581 |
| Gene name | caspase 14 | |
| Gene Alias | ARCI12 | |
| Cytomap | 19p13.12 | |
| Gene Type | protein-coding | GO ID | GO:0006508 | UniProtAcc | B2CIS9 |
Top |
Malignant transformation analysis |
| Identification of the aberrant gene expression in precancerous and cancerous lesions by comparing the gene expression of stem-like cells in diseased tissues with normal stem cells |
| Entrez ID | Symbol | Replicates | Species | Organ | Tissue | Adj P-value | Log2FC | Malignancy |
| 23581 | CASP14 | GSM4909292 | Human | Breast | IDC | 1.62e-13 | 8.86e-01 | 0.1236 |
| 23581 | CASP14 | GSM4909315 | Human | Breast | IDC | 7.40e-17 | 5.49e-01 | 0.21 |
| 23581 | CASP14 | GSM4909317 | Human | Breast | IDC | 8.05e-05 | 2.25e-01 | 0.1355 |
| 23581 | CASP14 | brca3 | Human | Breast | Precancer | 5.00e-03 | 1.46e-01 | -0.0263 |
| 23581 | CASP14 | M2 | Human | Breast | IDC | 2.55e-10 | 6.47e-01 | 0.21 |
| 23581 | CASP14 | P2 | Human | Breast | IDC | 5.71e-08 | 3.01e-01 | 0.21 |
| 23581 | CASP14 | P4_S8_cSCC | Human | Skin | cSCC | 9.32e-05 | 2.02e-01 | -0.3095 |
| 23581 | CASP14 | P5_S10_cSCC | Human | Skin | cSCC | 7.10e-09 | 3.14e-01 | -0.299 |
| 23581 | CASP14 | P4_cSCC | Human | Skin | cSCC | 6.97e-22 | 7.55e-01 | -0.00290000000000005 |
| 23581 | CASP14 | P10_cSCC | Human | Skin | cSCC | 2.01e-02 | 4.85e-01 | 0.1017 |
| Page: 1 |
| Tissue | Expression Dynamics | Abbreviation |
| Breast | 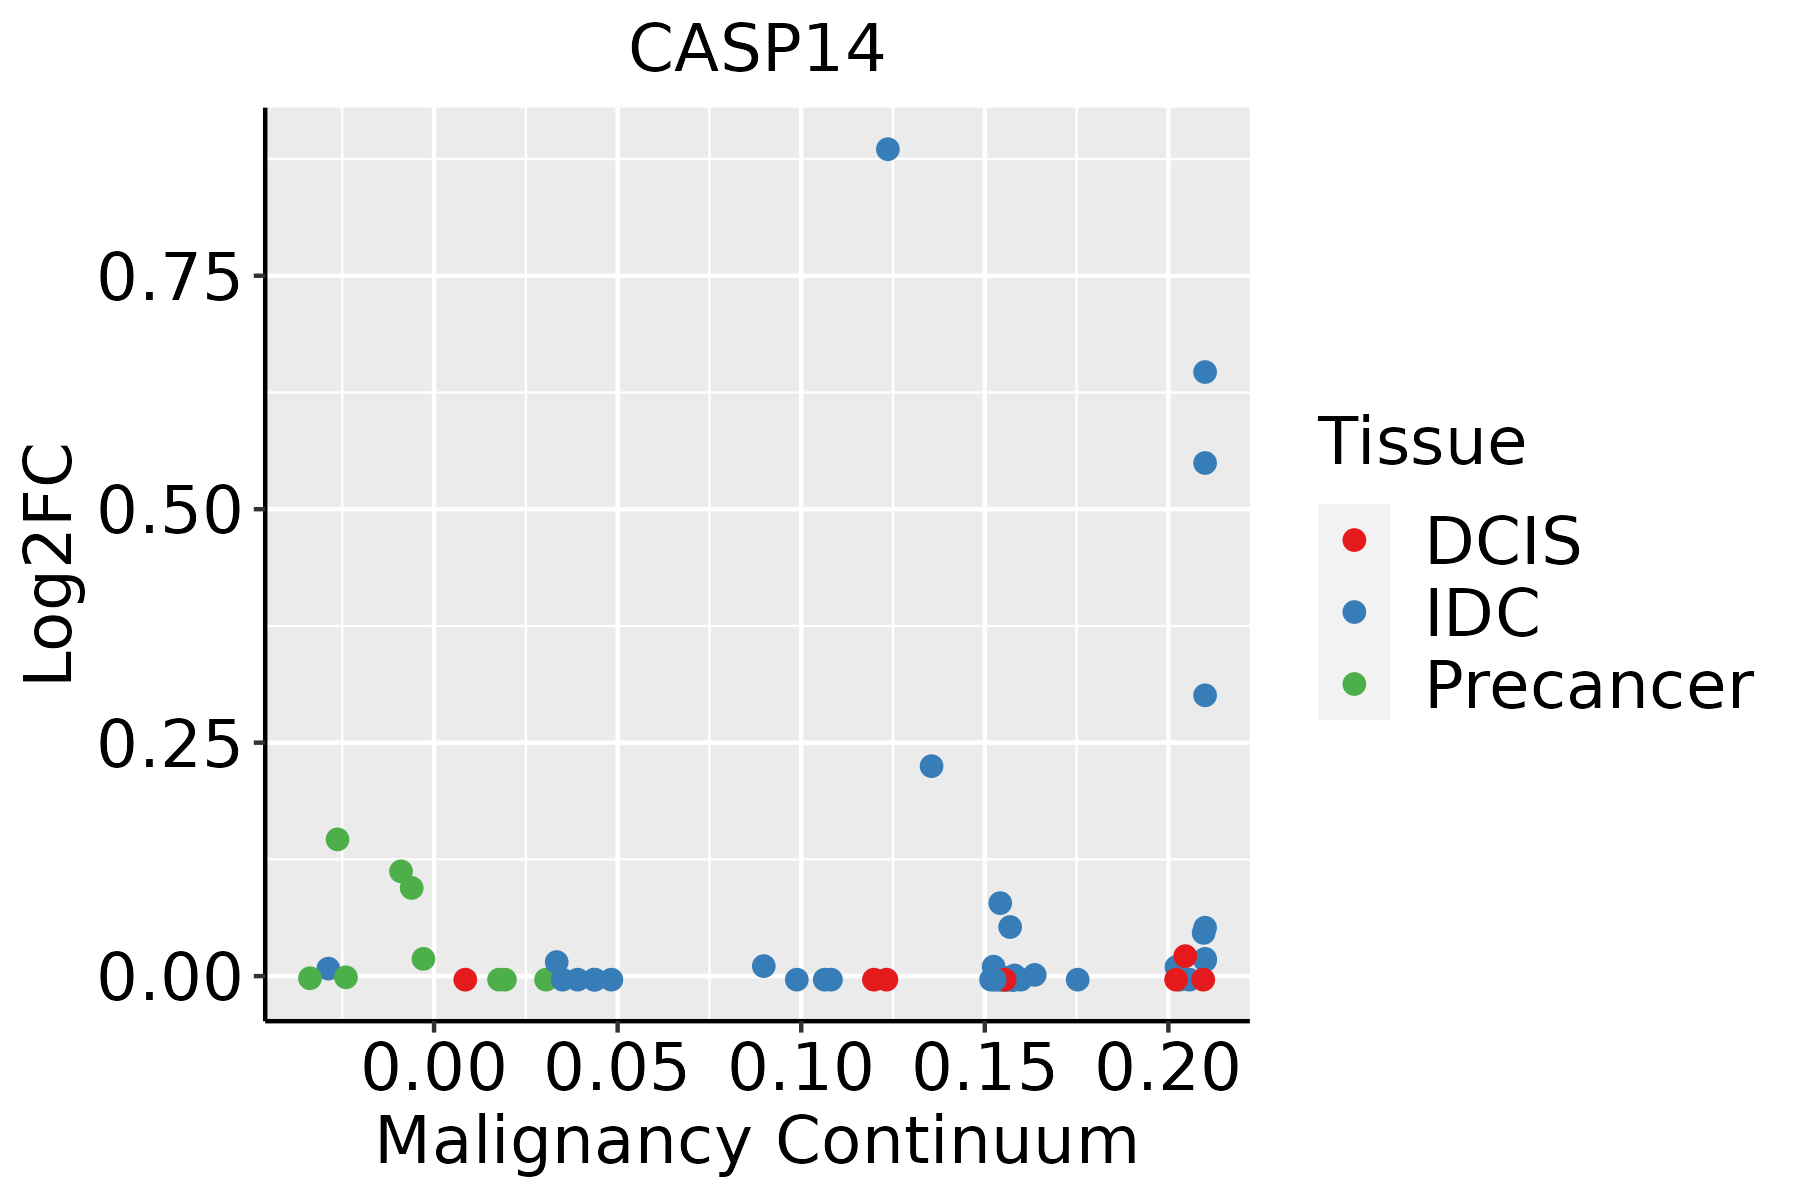 | IDC: Invasive ductal carcinoma |
| DCIS: Ductal carcinoma in situ | ||
| Precancer(BRCA1-mut): Precancerous lesion from BRCA1 mutation carriers | ||
| Skin |  | AK: Actinic keratosis |
| cSCC: Cutaneous squamous cell carcinoma | ||
| SCCIS:squamous cell carcinoma in situ |
| ∗log2FC in expression of this searched gene in stem-like cells from each diseased tissue sample relative to stem-like cells in normal samples in each tissue plotted against the malignancy continuum. Samples are colored based on if they are from different disease stage. |
Top |
Malignant transformation related pathway analysis |
| Find out the enriched GO biological processes and KEGG pathways involved in transition from healthy to precancer to cancer |
| Tissue | Disease Stage | Enriched GO biological Processes |
| Colorectum | AD |  |
| Colorectum | SER |  |
| Colorectum | MSS |  |
| Colorectum | MSI-H |  |
| Colorectum | FAP |  |
| ∗Top 15 enriched GO BP terms are showed in the bar plot of each disease state in each tissue. Each row represents a significant GO biological process which is colored according to the -log10(p.adjust). |
| Page: 1 2 3 4 5 6 7 8 9 |
| GO ID | Tissue | Disease Stage | Description | Gene Ratio | Bg Ratio | pvalue | p.adjust | Count |
| GO:00085445 | Breast | Precancer | epidermis development | 35/1080 | 324/18723 | 2.71e-04 | 3.96e-03 | 35 |
| GO:00099136 | Breast | Precancer | epidermal cell differentiation | 23/1080 | 202/18723 | 1.43e-03 | 1.50e-02 | 23 |
| GO:00302163 | Breast | Precancer | keratinocyte differentiation | 17/1080 | 139/18723 | 2.71e-03 | 2.39e-02 | 17 |
| GO:000854412 | Breast | IDC | epidermis development | 41/1434 | 324/18723 | 1.03e-03 | 1.14e-02 | 41 |
| GO:000991312 | Breast | IDC | epidermal cell differentiation | 28/1434 | 202/18723 | 1.62e-03 | 1.60e-02 | 28 |
| GO:00302161 | Breast | IDC | keratinocyte differentiation | 21/1434 | 139/18723 | 2.06e-03 | 1.95e-02 | 21 |
| GO:00435883 | Breast | IDC | skin development | 33/1434 | 263/18723 | 3.46e-03 | 2.87e-02 | 33 |
| GO:004358823 | Skin | cSCC | skin development | 111/4864 | 263/18723 | 6.35e-09 | 2.10e-07 | 111 |
| GO:000854425 | Skin | cSCC | epidermis development | 131/4864 | 324/18723 | 7.38e-09 | 2.39e-07 | 131 |
| GO:003021622 | Skin | cSCC | keratinocyte differentiation | 59/4864 | 139/18723 | 1.70e-05 | 2.07e-04 | 59 |
| GO:000991324 | Skin | cSCC | epidermal cell differentiation | 78/4864 | 202/18723 | 5.12e-05 | 5.28e-04 | 78 |
| Page: 1 |
| Pathway ID | Tissue | Disease Stage | Description | Gene Ratio | Bg Ratio | pvalue | p.adjust | qvalue | Count |
| Page: 1 |
Top |
Cell-cell communication analysis |
| Identification of potential cell-cell interactions between two cell types and their ligand-receptor pairs for different disease states |
| Ligand | Receptor | LRpair | Pathway | Tissue | Disease Stage |
| Page: 1 |
Top |
Single-cell gene regulatory network inference analysis |
| Find out the significant the regulons (TFs) and the target genes of each regulon across cell types for different disease states |
| TF | Cell Type | Tissue | Disease Stage | Target Gene | RSS | Regulon Activity |
| ∗The dot plots of a searched regulon are shown for all cell subpopulations in each disease state of each tissue based on the regulon specific score inferred using pySCENIC and by calculating the average expression. |
| Page: 1 |
Top |
Somatic mutation of malignant transformation related genes |
| Annotation of somatic variants for genes involved in malignant transformation |
| Hugo Symbol | Variant Class | Variant Classification | dbSNP RS | HGVSc | HGVSp | HGVSp Short | SWISSPROT | BIOTYPE | SIFT | PolyPhen | Tumor Sample Barcode | Tissue | Histology | Sex | Age | Stage | Therapy Types | Drugs | Outcome |
| CASP14 | SNV | Missense_Mutation | c.457N>G | p.Lys153Glu | p.K153E | P31944 | protein_coding | tolerated(1) | benign(0.003) | TCGA-AN-A046-01 | Breast | breast invasive carcinoma | Female | >=65 | I/II | Unknown | Unknown | SD | |
| CASP14 | SNV | Missense_Mutation | c.208N>A | p.Gln70Lys | p.Q70K | P31944 | protein_coding | tolerated(0.18) | benign(0.353) | TCGA-FU-A3HZ-01 | Cervix | cervical & endocervical cancer | Female | <65 | I/II | Chemotherapy | cisplatin | CR | |
| CASP14 | SNV | Missense_Mutation | rs746084490 | c.250G>A | p.Val84Met | p.V84M | P31944 | protein_coding | deleterious(0) | probably_damaging(0.999) | TCGA-FU-A770-01 | Cervix | cervical & endocervical cancer | Female | <65 | III/IV | Unknown | Unknown | SD |
| CASP14 | SNV | Missense_Mutation | c.265N>T | p.His89Tyr | p.H89Y | P31944 | protein_coding | deleterious(0) | probably_damaging(0.995) | TCGA-IR-A3LA-01 | Cervix | cervical & endocervical cancer | Female | <65 | I/II | Chemotherapy | cisplatin | CR | |
| CASP14 | SNV | Missense_Mutation | novel | c.622G>A | p.Glu208Lys | p.E208K | P31944 | protein_coding | tolerated(0.22) | probably_damaging(0.936) | TCGA-VS-A8EJ-01 | Cervix | cervical & endocervical cancer | Female | <65 | I/II | Chemotherapy | cisplatin | PD |
| CASP14 | SNV | Missense_Mutation | rs201635146 | c.11C>T | p.Pro4Leu | p.P4L | P31944 | protein_coding | tolerated_low_confidence(0.07) | benign(0) | TCGA-AA-A00N-01 | Colorectum | colon adenocarcinoma | Male | >=65 | I/II | Unknown | Unknown | PD |
| CASP14 | SNV | Missense_Mutation | rs751321912 | c.706C>T | p.Arg236Trp | p.R236W | P31944 | protein_coding | deleterious(0) | benign(0.118) | TCGA-AA-A01P-01 | Colorectum | colon adenocarcinoma | Female | >=65 | III/IV | Unknown | Unknown | PD |
| CASP14 | SNV | Missense_Mutation | rs771317945 | c.53N>A | p.Arg18His | p.R18H | P31944 | protein_coding | deleterious(0) | probably_damaging(0.971) | TCGA-AG-4007-01 | Colorectum | rectum adenocarcinoma | Male | >=65 | III/IV | Unknown | Unknown | SD |
| CASP14 | SNV | Missense_Mutation | rs61731993 | c.130N>T | p.Arg44Trp | p.R44W | P31944 | protein_coding | deleterious(0) | benign(0.326) | TCGA-AG-A002-01 | Colorectum | rectum adenocarcinoma | Male | <65 | I/II | Unknown | Unknown | SD |
| CASP14 | SNV | Missense_Mutation | novel | c.345N>T | p.Lys115Asn | p.K115N | P31944 | protein_coding | deleterious(0) | probably_damaging(0.998) | TCGA-AG-A002-01 | Colorectum | rectum adenocarcinoma | Male | <65 | I/II | Unknown | Unknown | SD |
| Page: 1 2 3 |
Top |
Related drugs of malignant transformation related genes |
| Identification of chemicals and drugs interact with genes involved in malignant transfromation |
| (DGIdb 4.0) |
| Entrez ID | Symbol | Category | Interaction Types | Drug Claim Name | Drug Name | PMIDs |
| 23581 | CASP14 | PROTEASE, DRUGGABLE GENOME, ENZYME | inhibitor | 252166874 | ||
| 23581 | CASP14 | PROTEASE, DRUGGABLE GENOME, ENZYME | inhibitor | CHEMBL197672 | EMRICASAN |
| Page: 1 |

Copyright 2023-Present -The University of Texas Health Science Center at Houston |