
|
|||||
|
 | |
| |
| |
| |
| |
| |
|
Gene: CASP1 |
Gene summary for CASP1 |
| Gene information | Species | Human | Gene symbol | CASP1 | Gene ID | 834 |
| Gene name | caspase 1 | |
| Gene Alias | ICE | |
| Cytomap | 11q22.3 | |
| Gene Type | protein-coding | GO ID | GO:0001666 | UniProtAcc | P29466 |
Top |
Malignant transformation analysis |
| Identification of the aberrant gene expression in precancerous and cancerous lesions by comparing the gene expression of stem-like cells in diseased tissues with normal stem cells |
| Entrez ID | Symbol | Replicates | Species | Organ | Tissue | Adj P-value | Log2FC | Malignancy |
| 834 | CASP1 | LZE4T | Human | Esophagus | ESCC | 6.72e-07 | 3.67e-01 | 0.0811 |
| 834 | CASP1 | LZE8T | Human | Esophagus | ESCC | 3.51e-15 | 5.03e-01 | 0.067 |
| 834 | CASP1 | LZE20T | Human | Esophagus | ESCC | 4.12e-03 | 1.60e-01 | 0.0662 |
| 834 | CASP1 | LZE22D1 | Human | Esophagus | HGIN | 5.52e-06 | 2.19e-01 | 0.0595 |
| 834 | CASP1 | LZE22T | Human | Esophagus | ESCC | 3.19e-02 | 4.48e-01 | 0.068 |
| 834 | CASP1 | LZE24T | Human | Esophagus | ESCC | 1.03e-12 | 4.22e-01 | 0.0596 |
| 834 | CASP1 | LZE6T | Human | Esophagus | ESCC | 1.38e-09 | 5.83e-01 | 0.0845 |
| 834 | CASP1 | P1T-E | Human | Esophagus | ESCC | 4.30e-02 | 1.32e-01 | 0.0875 |
| 834 | CASP1 | P2T-E | Human | Esophagus | ESCC | 5.16e-22 | 2.64e-01 | 0.1177 |
| 834 | CASP1 | P4T-E | Human | Esophagus | ESCC | 3.59e-27 | 7.51e-01 | 0.1323 |
| 834 | CASP1 | P5T-E | Human | Esophagus | ESCC | 4.83e-12 | 1.19e-01 | 0.1327 |
| 834 | CASP1 | P8T-E | Human | Esophagus | ESCC | 2.63e-37 | 8.08e-01 | 0.0889 |
| 834 | CASP1 | P9T-E | Human | Esophagus | ESCC | 8.77e-20 | 3.00e-01 | 0.1131 |
| 834 | CASP1 | P10T-E | Human | Esophagus | ESCC | 7.11e-04 | 1.13e-01 | 0.116 |
| 834 | CASP1 | P11T-E | Human | Esophagus | ESCC | 1.52e-06 | 5.40e-01 | 0.1426 |
| 834 | CASP1 | P12T-E | Human | Esophagus | ESCC | 3.67e-08 | 6.57e-02 | 0.1122 |
| 834 | CASP1 | P15T-E | Human | Esophagus | ESCC | 4.54e-05 | 1.89e-01 | 0.1149 |
| 834 | CASP1 | P16T-E | Human | Esophagus | ESCC | 1.49e-18 | 1.76e-01 | 0.1153 |
| 834 | CASP1 | P17T-E | Human | Esophagus | ESCC | 7.24e-09 | 4.19e-01 | 0.1278 |
| 834 | CASP1 | P20T-E | Human | Esophagus | ESCC | 1.20e-20 | 3.52e-01 | 0.1124 |
| Page: 1 2 3 4 |
| Tissue | Expression Dynamics | Abbreviation |
| Esophagus | 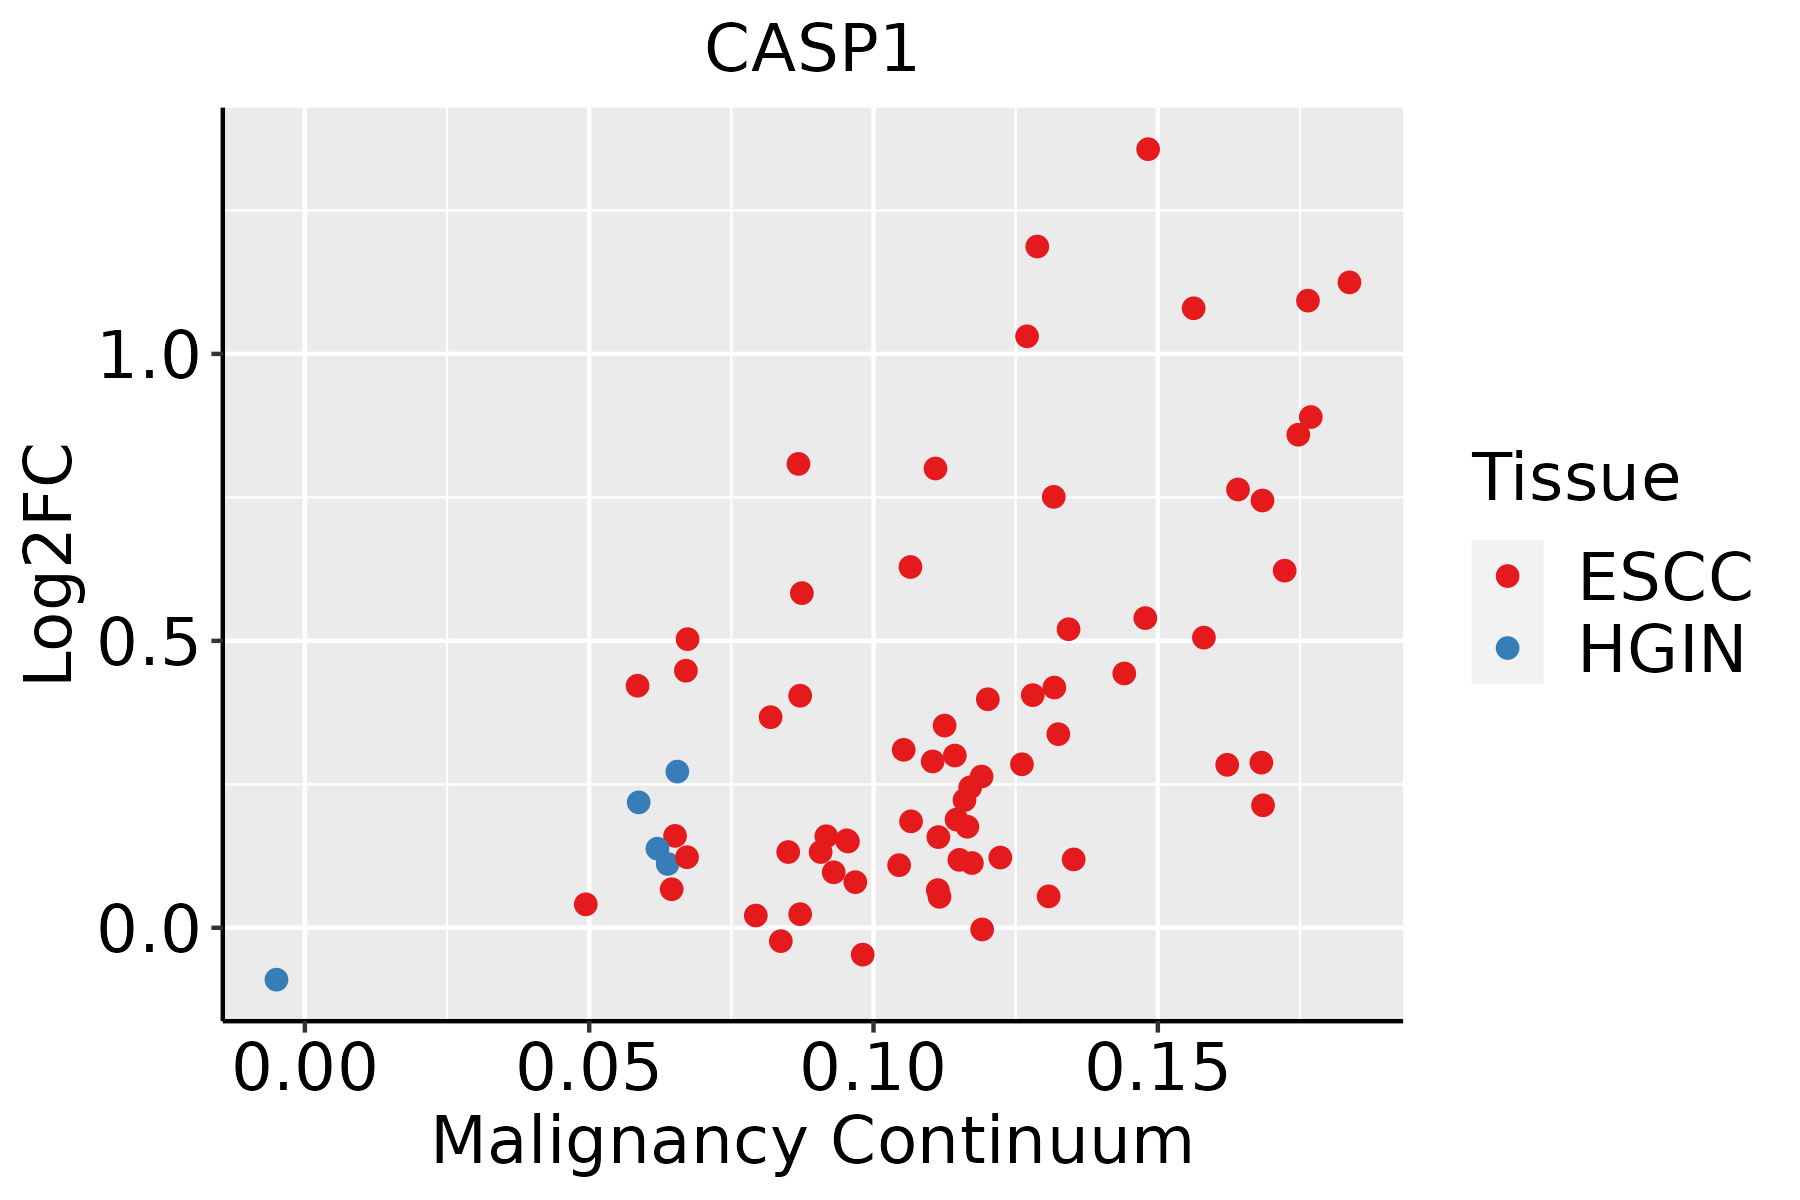 | ESCC: Esophageal squamous cell carcinoma |
| HGIN: High-grade intraepithelial neoplasias | ||
| LGIN: Low-grade intraepithelial neoplasias | ||
| Oral Cavity |  | EOLP: Erosive Oral lichen planus |
| LP: leukoplakia | ||
| NEOLP: Non-erosive oral lichen planus | ||
| OSCC: Oral squamous cell carcinoma | ||
| Skin |  | AK: Actinic keratosis |
| cSCC: Cutaneous squamous cell carcinoma | ||
| SCCIS:squamous cell carcinoma in situ | ||
| Thyroid | 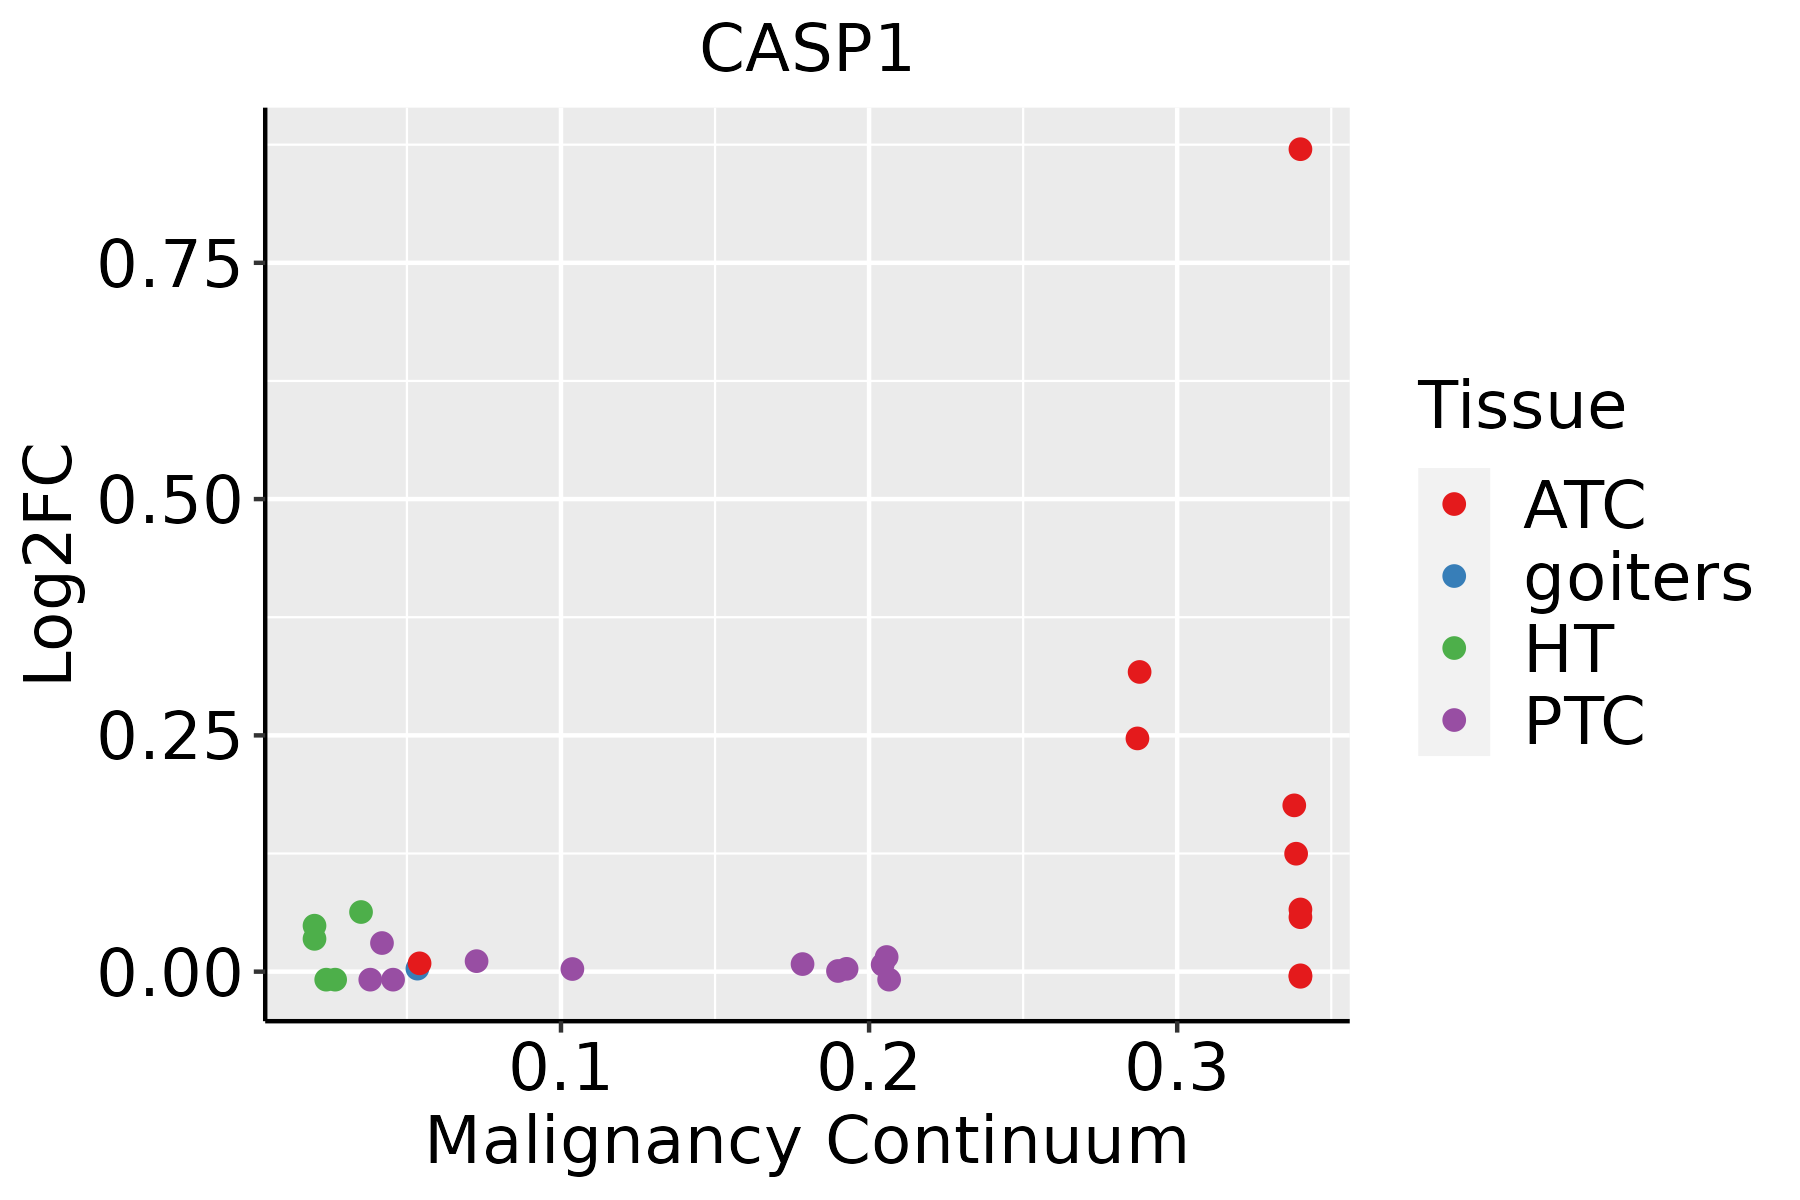 | ATC: Anaplastic thyroid cancer |
| HT: Hashimoto's thyroiditis | ||
| PTC: Papillary thyroid cancer |
| ∗log2FC in expression of this searched gene in stem-like cells from each diseased tissue sample relative to stem-like cells in normal samples in each tissue plotted against the malignancy continuum. Samples are colored based on if they are from different disease stage. |
Top |
Malignant transformation related pathway analysis |
| Find out the enriched GO biological processes and KEGG pathways involved in transition from healthy to precancer to cancer |
| Tissue | Disease Stage | Enriched GO biological Processes |
| Colorectum | AD |  |
| Colorectum | SER |  |
| Colorectum | MSS |  |
| Colorectum | MSI-H |  |
| Colorectum | FAP |  |
| ∗Top 15 enriched GO BP terms are showed in the bar plot of each disease state in each tissue. Each row represents a significant GO biological process which is colored according to the -log10(p.adjust). |
| Page: 1 2 3 4 5 6 7 8 9 |
| GO ID | Tissue | Disease Stage | Description | Gene Ratio | Bg Ratio | pvalue | p.adjust | Count |
| GO:00085445 | Breast | Precancer | epidermis development | 35/1080 | 324/18723 | 2.71e-04 | 3.96e-03 | 35 |
| GO:00099136 | Breast | Precancer | epidermal cell differentiation | 23/1080 | 202/18723 | 1.43e-03 | 1.50e-02 | 23 |
| GO:00302163 | Breast | Precancer | keratinocyte differentiation | 17/1080 | 139/18723 | 2.71e-03 | 2.39e-02 | 17 |
| GO:000854412 | Breast | IDC | epidermis development | 41/1434 | 324/18723 | 1.03e-03 | 1.14e-02 | 41 |
| GO:000991312 | Breast | IDC | epidermal cell differentiation | 28/1434 | 202/18723 | 1.62e-03 | 1.60e-02 | 28 |
| GO:00302161 | Breast | IDC | keratinocyte differentiation | 21/1434 | 139/18723 | 2.06e-03 | 1.95e-02 | 21 |
| GO:00435883 | Breast | IDC | skin development | 33/1434 | 263/18723 | 3.46e-03 | 2.87e-02 | 33 |
| GO:004586227 | Esophagus | HGIN | positive regulation of proteolysis | 107/2587 | 372/18723 | 2.61e-14 | 4.60e-12 | 107 |
| GO:001050616 | Esophagus | HGIN | regulation of autophagy | 84/2587 | 317/18723 | 1.39e-09 | 1.08e-07 | 84 |
| GO:004328126 | Esophagus | HGIN | regulation of cysteine-type endopeptidase activity involved in apoptotic process | 59/2587 | 209/18723 | 3.39e-08 | 1.97e-06 | 59 |
| GO:200011626 | Esophagus | HGIN | regulation of cysteine-type endopeptidase activity | 63/2587 | 235/18723 | 9.71e-08 | 5.02e-06 | 63 |
| GO:005254726 | Esophagus | HGIN | regulation of peptidase activity | 102/2587 | 461/18723 | 6.29e-07 | 2.72e-05 | 102 |
| GO:001095225 | Esophagus | HGIN | positive regulation of peptidase activity | 53/2587 | 197/18723 | 8.70e-07 | 3.59e-05 | 53 |
| GO:004312220 | Esophagus | HGIN | regulation of I-kappaB kinase/NF-kappaB signaling | 63/2587 | 249/18723 | 8.91e-07 | 3.61e-05 | 63 |
| GO:005254826 | Esophagus | HGIN | regulation of endopeptidase activity | 96/2587 | 432/18723 | 1.09e-06 | 4.30e-05 | 96 |
| GO:004328020 | Esophagus | HGIN | positive regulation of cysteine-type endopeptidase activity involved in apoptotic process | 38/2587 | 129/18723 | 2.92e-06 | 1.01e-04 | 38 |
| GO:000724918 | Esophagus | HGIN | I-kappaB kinase/NF-kappaB signaling | 67/2587 | 281/18723 | 3.84e-06 | 1.29e-04 | 67 |
| GO:004312317 | Esophagus | HGIN | positive regulation of I-kappaB kinase/NF-kappaB signaling | 49/2587 | 186/18723 | 4.22e-06 | 1.40e-04 | 49 |
| GO:200105620 | Esophagus | HGIN | positive regulation of cysteine-type endopeptidase activity | 41/2587 | 148/18723 | 6.65e-06 | 2.07e-04 | 41 |
| GO:001095020 | Esophagus | HGIN | positive regulation of endopeptidase activity | 47/2587 | 179/18723 | 7.23e-06 | 2.20e-04 | 47 |
| Page: 1 2 3 4 5 6 7 8 9 10 11 12 |
| Pathway ID | Tissue | Disease Stage | Description | Gene Ratio | Bg Ratio | pvalue | p.adjust | qvalue | Count |
| hsa0517139 | Esophagus | HGIN | Coronavirus disease - COVID-19 | 105/1383 | 232/8465 | 7.84e-26 | 5.11e-24 | 4.06e-24 | 105 |
| hsa0501430 | Esophagus | HGIN | Amyotrophic lateral sclerosis | 140/1383 | 364/8465 | 2.13e-25 | 1.16e-23 | 9.19e-24 | 140 |
| hsa0513139 | Esophagus | HGIN | Shigellosis | 71/1383 | 247/8465 | 4.89e-07 | 7.98e-06 | 6.34e-06 | 71 |
| hsa0513239 | Esophagus | HGIN | Salmonella infection | 69/1383 | 249/8465 | 3.02e-06 | 4.47e-05 | 3.55e-05 | 69 |
| hsa0513039 | Esophagus | HGIN | Pathogenic Escherichia coli infection | 54/1383 | 197/8465 | 4.91e-05 | 6.15e-04 | 4.89e-04 | 54 |
| hsa0541739 | Esophagus | HGIN | Lipid and atherosclerosis | 51/1383 | 215/8465 | 2.95e-03 | 2.41e-02 | 1.91e-02 | 51 |
| hsa0513427 | Esophagus | HGIN | Legionellosis | 18/1383 | 57/8465 | 3.20e-03 | 2.54e-02 | 2.02e-02 | 18 |
| hsa046219 | Esophagus | HGIN | NOD-like receptor signaling pathway | 45/1383 | 186/8465 | 3.40e-03 | 2.54e-02 | 2.02e-02 | 45 |
| hsa0516420 | Esophagus | HGIN | Influenza A | 42/1383 | 171/8465 | 3.41e-03 | 2.54e-02 | 2.02e-02 | 42 |
| hsa05171115 | Esophagus | HGIN | Coronavirus disease - COVID-19 | 105/1383 | 232/8465 | 7.84e-26 | 5.11e-24 | 4.06e-24 | 105 |
| hsa05014113 | Esophagus | HGIN | Amyotrophic lateral sclerosis | 140/1383 | 364/8465 | 2.13e-25 | 1.16e-23 | 9.19e-24 | 140 |
| hsa05131114 | Esophagus | HGIN | Shigellosis | 71/1383 | 247/8465 | 4.89e-07 | 7.98e-06 | 6.34e-06 | 71 |
| hsa05132115 | Esophagus | HGIN | Salmonella infection | 69/1383 | 249/8465 | 3.02e-06 | 4.47e-05 | 3.55e-05 | 69 |
| hsa05130115 | Esophagus | HGIN | Pathogenic Escherichia coli infection | 54/1383 | 197/8465 | 4.91e-05 | 6.15e-04 | 4.89e-04 | 54 |
| hsa05417114 | Esophagus | HGIN | Lipid and atherosclerosis | 51/1383 | 215/8465 | 2.95e-03 | 2.41e-02 | 1.91e-02 | 51 |
| hsa05134112 | Esophagus | HGIN | Legionellosis | 18/1383 | 57/8465 | 3.20e-03 | 2.54e-02 | 2.02e-02 | 18 |
| hsa0462114 | Esophagus | HGIN | NOD-like receptor signaling pathway | 45/1383 | 186/8465 | 3.40e-03 | 2.54e-02 | 2.02e-02 | 45 |
| hsa05164110 | Esophagus | HGIN | Influenza A | 42/1383 | 171/8465 | 3.41e-03 | 2.54e-02 | 2.02e-02 | 42 |
| hsa05014210 | Esophagus | ESCC | Amyotrophic lateral sclerosis | 266/4205 | 364/8465 | 1.31e-20 | 2.20e-18 | 1.13e-18 | 266 |
| hsa05132211 | Esophagus | ESCC | Salmonella infection | 191/4205 | 249/8465 | 6.51e-19 | 5.45e-17 | 2.79e-17 | 191 |
| Page: 1 2 3 4 5 |
Top |
Cell-cell communication analysis |
| Identification of potential cell-cell interactions between two cell types and their ligand-receptor pairs for different disease states |
| Ligand | Receptor | LRpair | Pathway | Tissue | Disease Stage |
| Page: 1 |
Top |
Single-cell gene regulatory network inference analysis |
| Find out the significant the regulons (TFs) and the target genes of each regulon across cell types for different disease states |
| TF | Cell Type | Tissue | Disease Stage | Target Gene | RSS | Regulon Activity |
| ∗The dot plots of a searched regulon are shown for all cell subpopulations in each disease state of each tissue based on the regulon specific score inferred using pySCENIC and by calculating the average expression. |
| Page: 1 |
Top |
Somatic mutation of malignant transformation related genes |
| Annotation of somatic variants for genes involved in malignant transformation |
| Hugo Symbol | Variant Class | Variant Classification | dbSNP RS | HGVSc | HGVSp | HGVSp Short | SWISSPROT | BIOTYPE | SIFT | PolyPhen | Tumor Sample Barcode | Tissue | Histology | Sex | Age | Stage | Therapy Types | Drugs | Outcome |
| CASP1 | SNV | Missense_Mutation | c.116N>G | p.Glu39Gly | p.E39G | P29466 | protein_coding | deleterious(0.02) | probably_damaging(0.987) | TCGA-A2-A04U-01 | Breast | breast invasive carcinoma | Female | <65 | I/II | Chemotherapy | adriamycin | SD | |
| CASP1 | SNV | Missense_Mutation | c.1121N>T | p.Arg374Leu | p.R374L | P29466 | protein_coding | deleterious(0) | benign(0.057) | TCGA-A8-A083-01 | Breast | breast invasive carcinoma | Female | >=65 | I/II | Unknown | Unknown | SD | |
| CASP1 | SNV | Missense_Mutation | rs780735624 | c.985G>A | p.Ala329Thr | p.A329T | P29466 | protein_coding | deleterious(0.05) | possibly_damaging(0.69) | TCGA-LL-A7SZ-01 | Breast | breast invasive carcinoma | Female | <65 | I/II | Chemotherapy | adriamycin | CR |
| CASP1 | SNV | Missense_Mutation | novel | c.123N>T | p.Glu41Asp | p.E41D | P29466 | protein_coding | tolerated(0.07) | benign(0.074) | TCGA-2W-A8YY-01 | Cervix | cervical & endocervical cancer | Female | <65 | I/II | Chemotherapy | cisplatin | CR |
| CASP1 | SNV | Missense_Mutation | c.889N>C | p.Asp297His | p.D297H | P29466 | protein_coding | deleterious(0) | probably_damaging(1) | TCGA-Q1-A73O-01 | Cervix | cervical & endocervical cancer | Female | <65 | I/II | Chemotherapy | cisplatin | CR | |
| CASP1 | SNV | Missense_Mutation | rs199932541 | c.370N>T | p.Pro124Ser | p.P124S | P29466 | protein_coding | tolerated(0.56) | benign(0.005) | TCGA-AA-3663-01 | Colorectum | colon adenocarcinoma | Male | <65 | I/II | Unknown | Unknown | SD |
| CASP1 | SNV | Missense_Mutation | rs202211771 | c.804G>T | p.Lys268Asn | p.K268N | P29466 | protein_coding | tolerated(0.15) | benign(0.024) | TCGA-AA-3977-01 | Colorectum | colon adenocarcinoma | Male | >=65 | I/II | Unknown | Unknown | SD |
| CASP1 | SNV | Missense_Mutation | novel | c.1081G>T | p.Ala361Ser | p.A361S | P29466 | protein_coding | tolerated(0.79) | benign(0.215) | TCGA-AA-A00O-01 | Colorectum | colon adenocarcinoma | Female | >=65 | III/IV | Unknown | Unknown | SD |
| CASP1 | deletion | Frame_Shift_Del | rs746543598 | c.614delN | p.Asn205IlefsTer7 | p.N205Ifs*7 | P29466 | protein_coding | TCGA-5M-AAT6-01 | Colorectum | colon adenocarcinoma | Female | <65 | III/IV | Unknown | Unknown | PD | ||
| CASP1 | deletion | Frame_Shift_Del | rs746543598 | c.614delN | p.Asn205IlefsTer7 | p.N205Ifs*7 | P29466 | protein_coding | TCGA-CK-6746-01 | Colorectum | colon adenocarcinoma | Female | >=65 | I/II | Unknown | Unknown | SD |
| Page: 1 2 3 4 5 6 7 |
Top |
Related drugs of malignant transformation related genes |
| Identification of chemicals and drugs interact with genes involved in malignant transfromation |
| (DGIdb 4.0) |
| Entrez ID | Symbol | Category | Interaction Types | Drug Claim Name | Drug Name | PMIDs |
| 834 | CASP1 | DRUGGABLE GENOME, ENZYME, PROTEASE | BERKELEYDIONE | BERKELEYDIONE | 17970594 | |
| 834 | CASP1 | DRUGGABLE GENOME, ENZYME, PROTEASE | Belnacasan | BELNACASAN | ||
| 834 | CASP1 | DRUGGABLE GENOME, ENZYME, PROTEASE | Ac-YVAD-cmk | |||
| 834 | CASP1 | DRUGGABLE GENOME, ENZYME, PROTEASE | inhibitor | 178103081 | PRALNACASAN | |
| 834 | CASP1 | DRUGGABLE GENOME, ENZYME, PROTEASE | inhibitor | 252166854 | ||
| 834 | CASP1 | DRUGGABLE GENOME, ENZYME, PROTEASE | BERKELEYACETAL C | BERKELEYACETAL C | 17970594 | |
| 834 | CASP1 | DRUGGABLE GENOME, ENZYME, PROTEASE | inhibitor | 178101984 | ||
| 834 | CASP1 | DRUGGABLE GENOME, ENZYME, PROTEASE | VERMISTATIN | VERMISTATIN | 22295871 | |
| 834 | CASP1 | DRUGGABLE GENOME, ENZYME, PROTEASE | PD-194035 | CHEMBL415893 | 10386941 | |
| 834 | CASP1 | DRUGGABLE GENOME, ENZYME, PROTEASE | inhibitor | CHEMBL2105721 | NIVOCASAN |
| Page: 1 2 3 4 |

Copyright 2023-Present -The University of Texas Health Science Center at Houston |