| Tissue | Expression Dynamics | Abbreviation |
| Cervix | 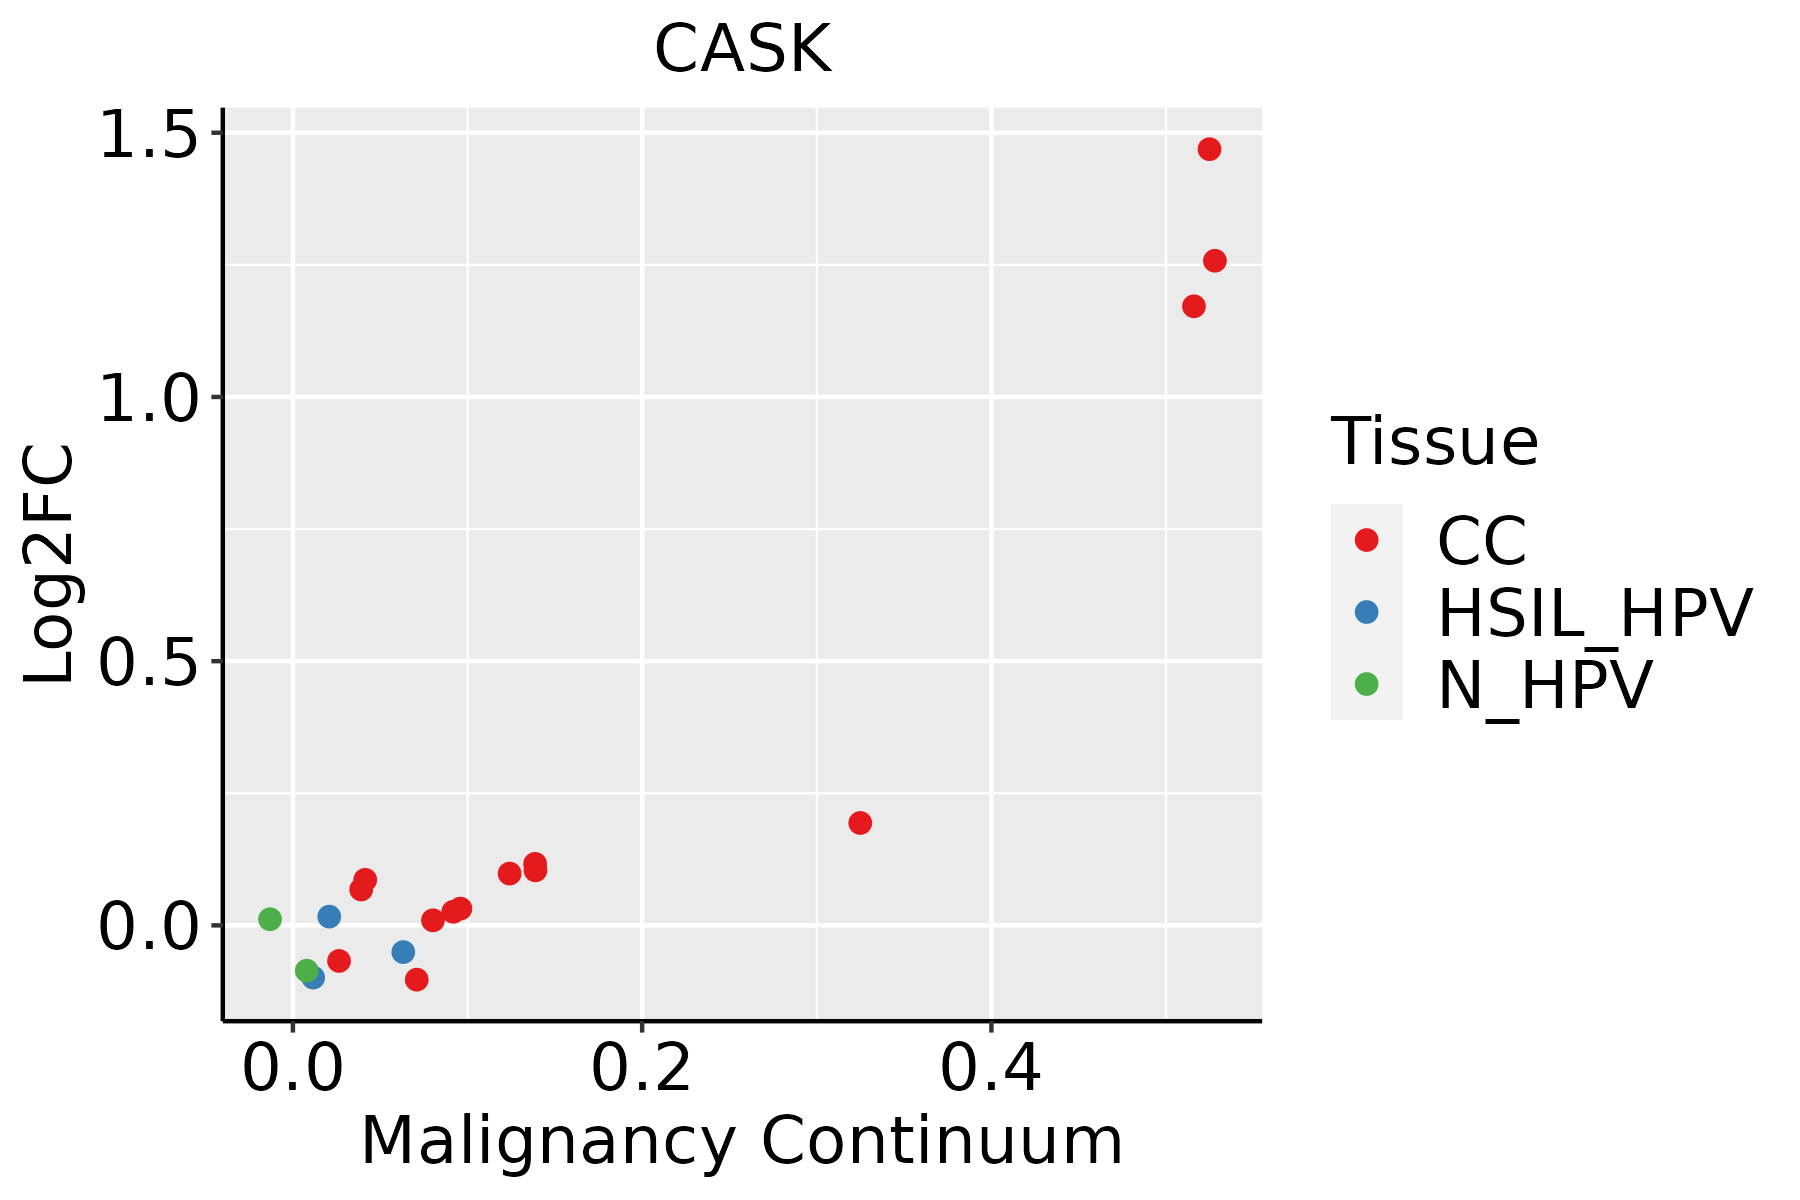 | CC: Cervix cancer |
| HSIL_HPV: HPV-infected high-grade squamous intraepithelial lesions |
| N_HPV: HPV-infected normal cervix |
| Colorectum (GSE201348) | 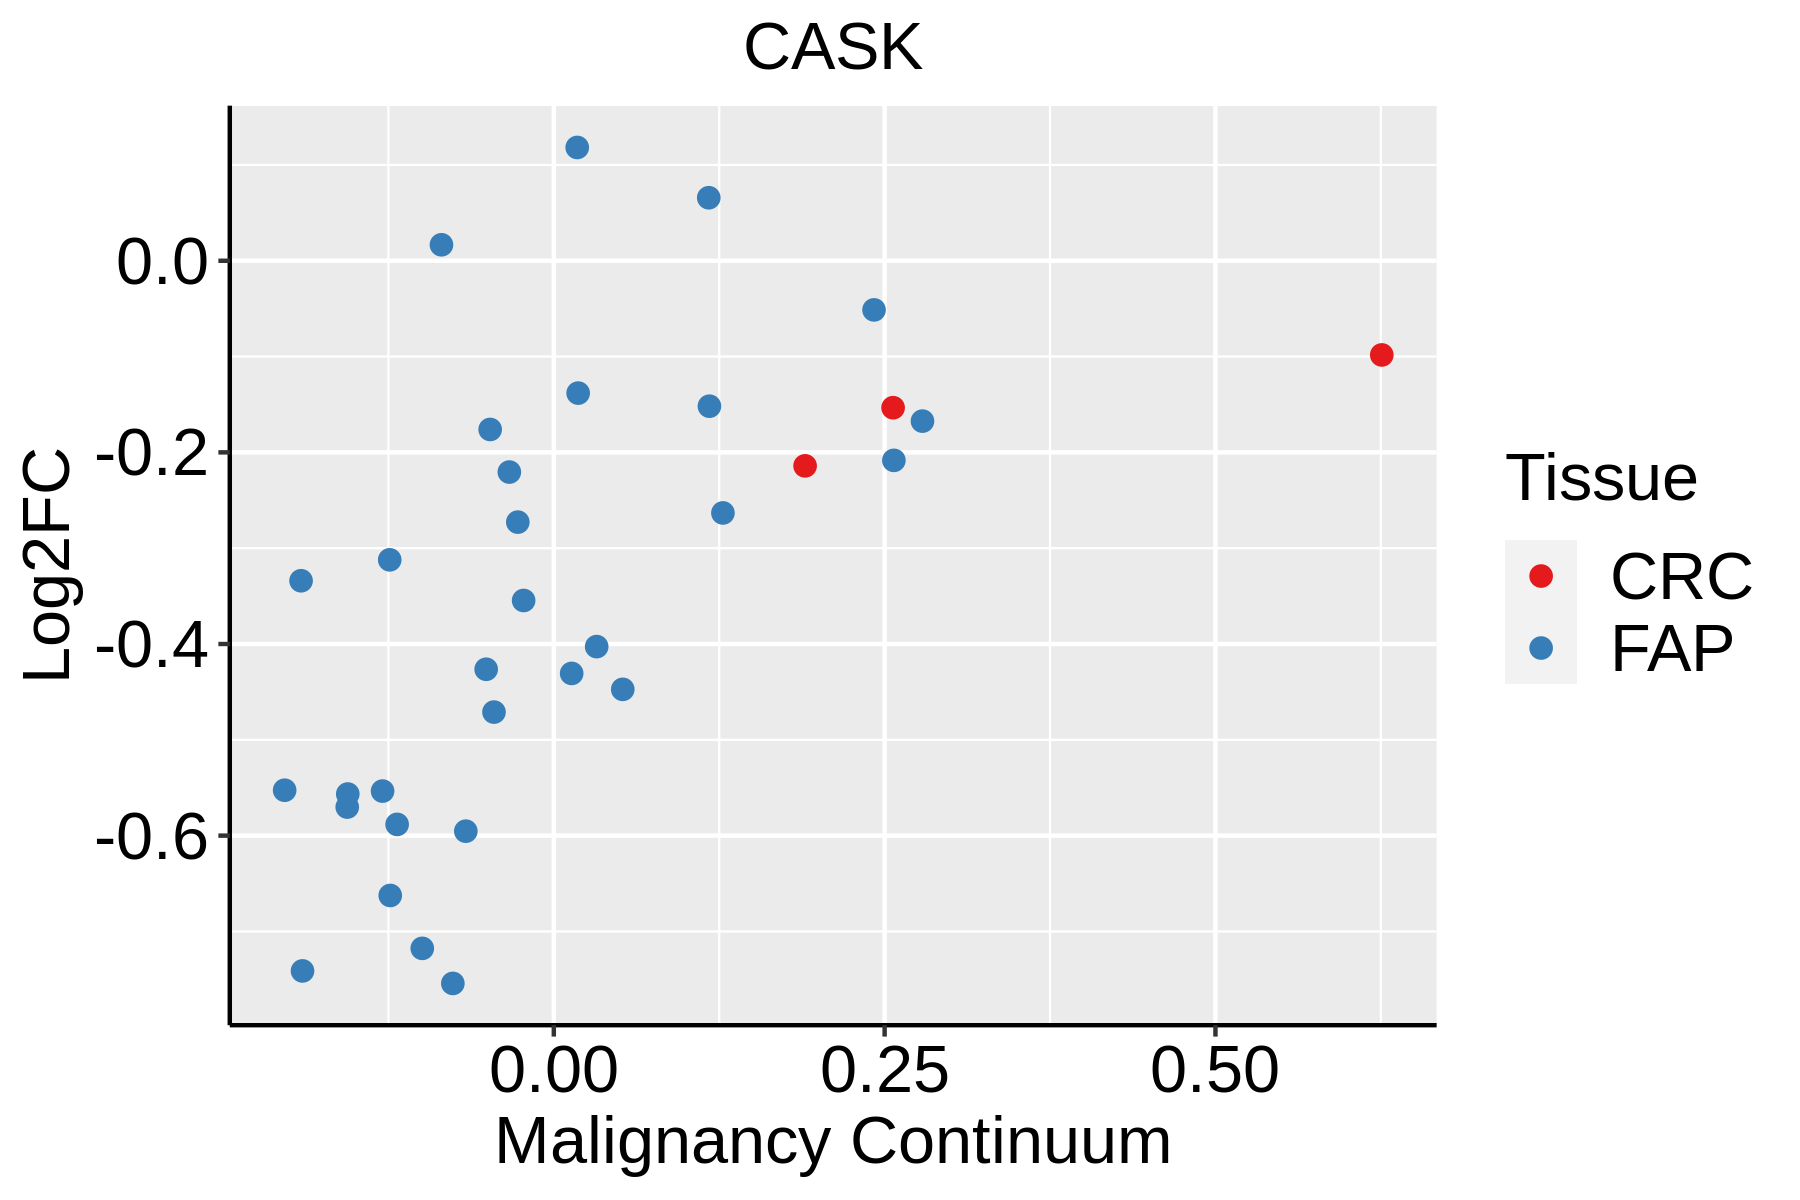 | FAP: Familial adenomatous polyposis |
| CRC: Colorectal cancer |
| Colorectum (HTA11) | 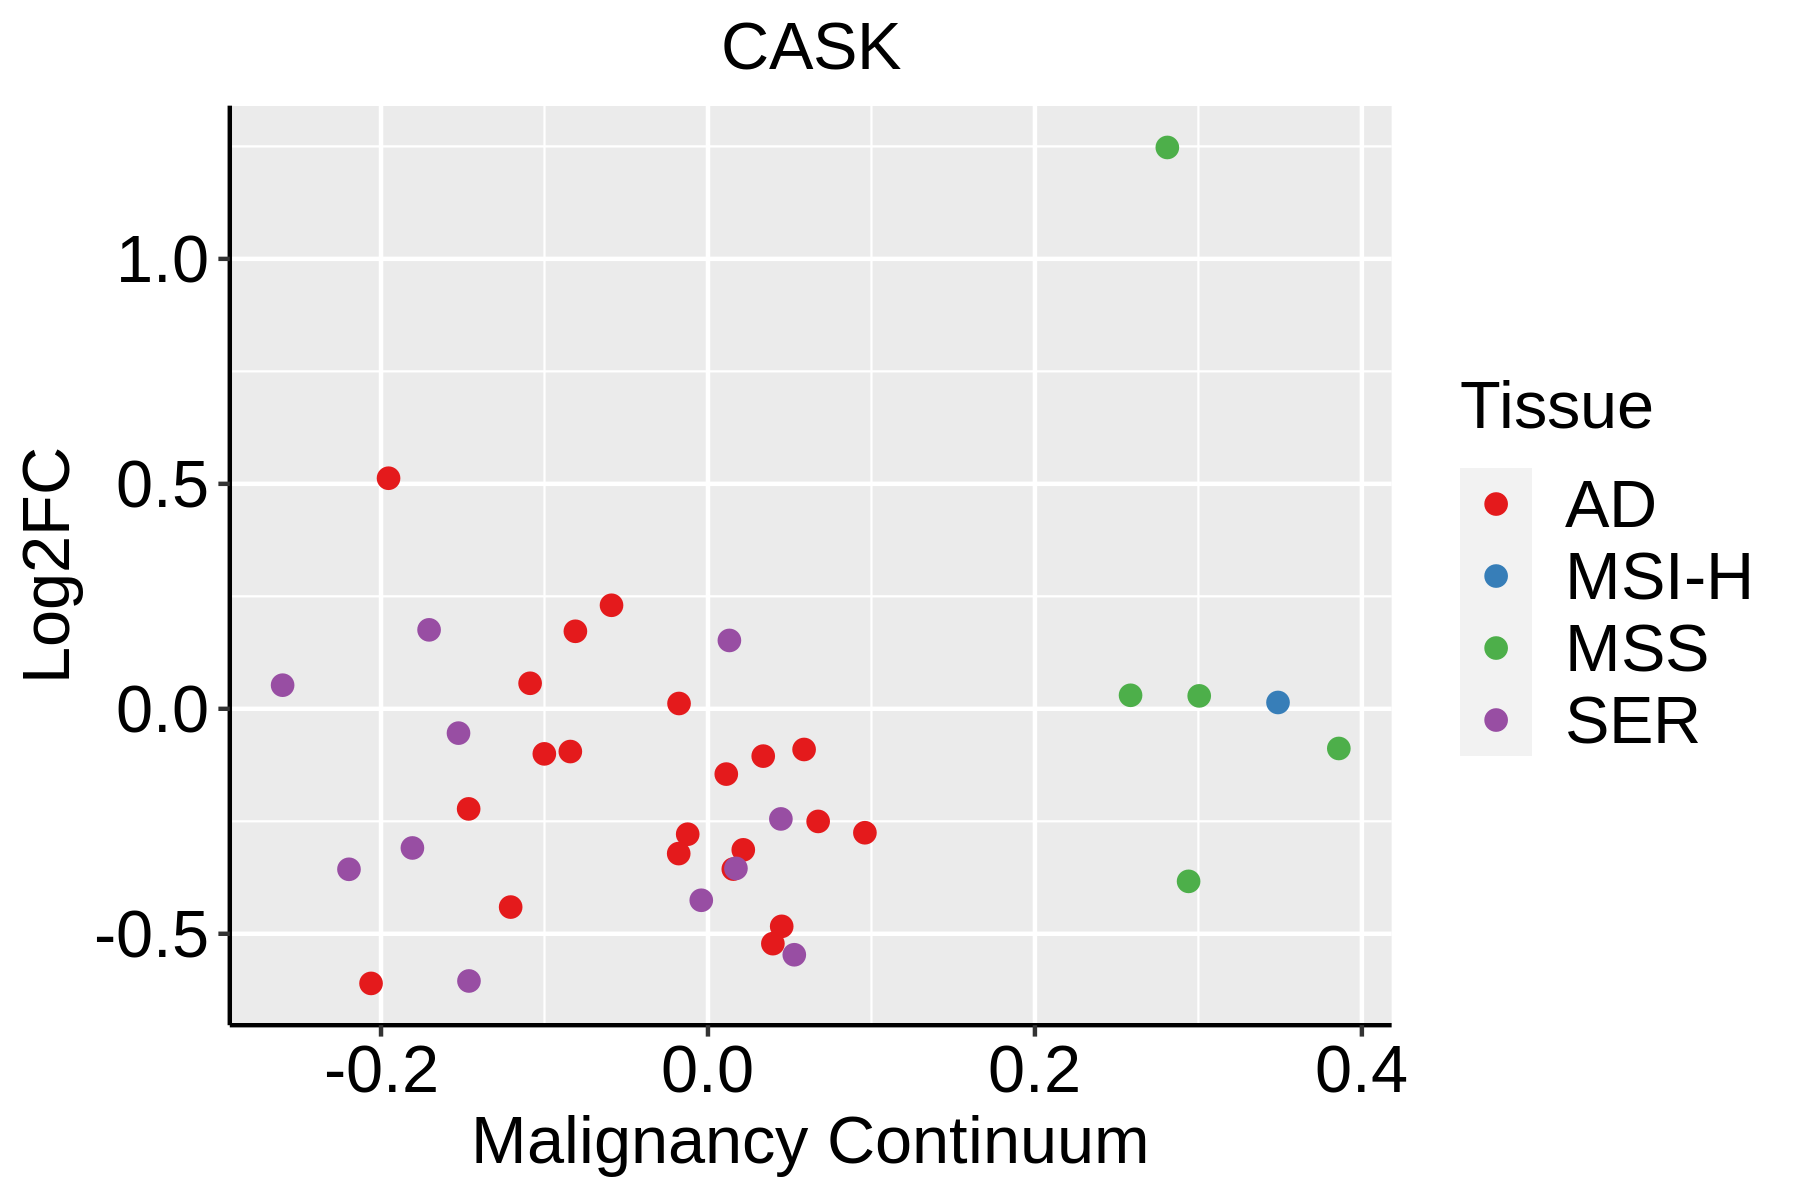 | AD: Adenomas |
| SER: Sessile serrated lesions |
| MSI-H: Microsatellite-high colorectal cancer |
| MSS: Microsatellite stable colorectal cancer |
| Esophagus | 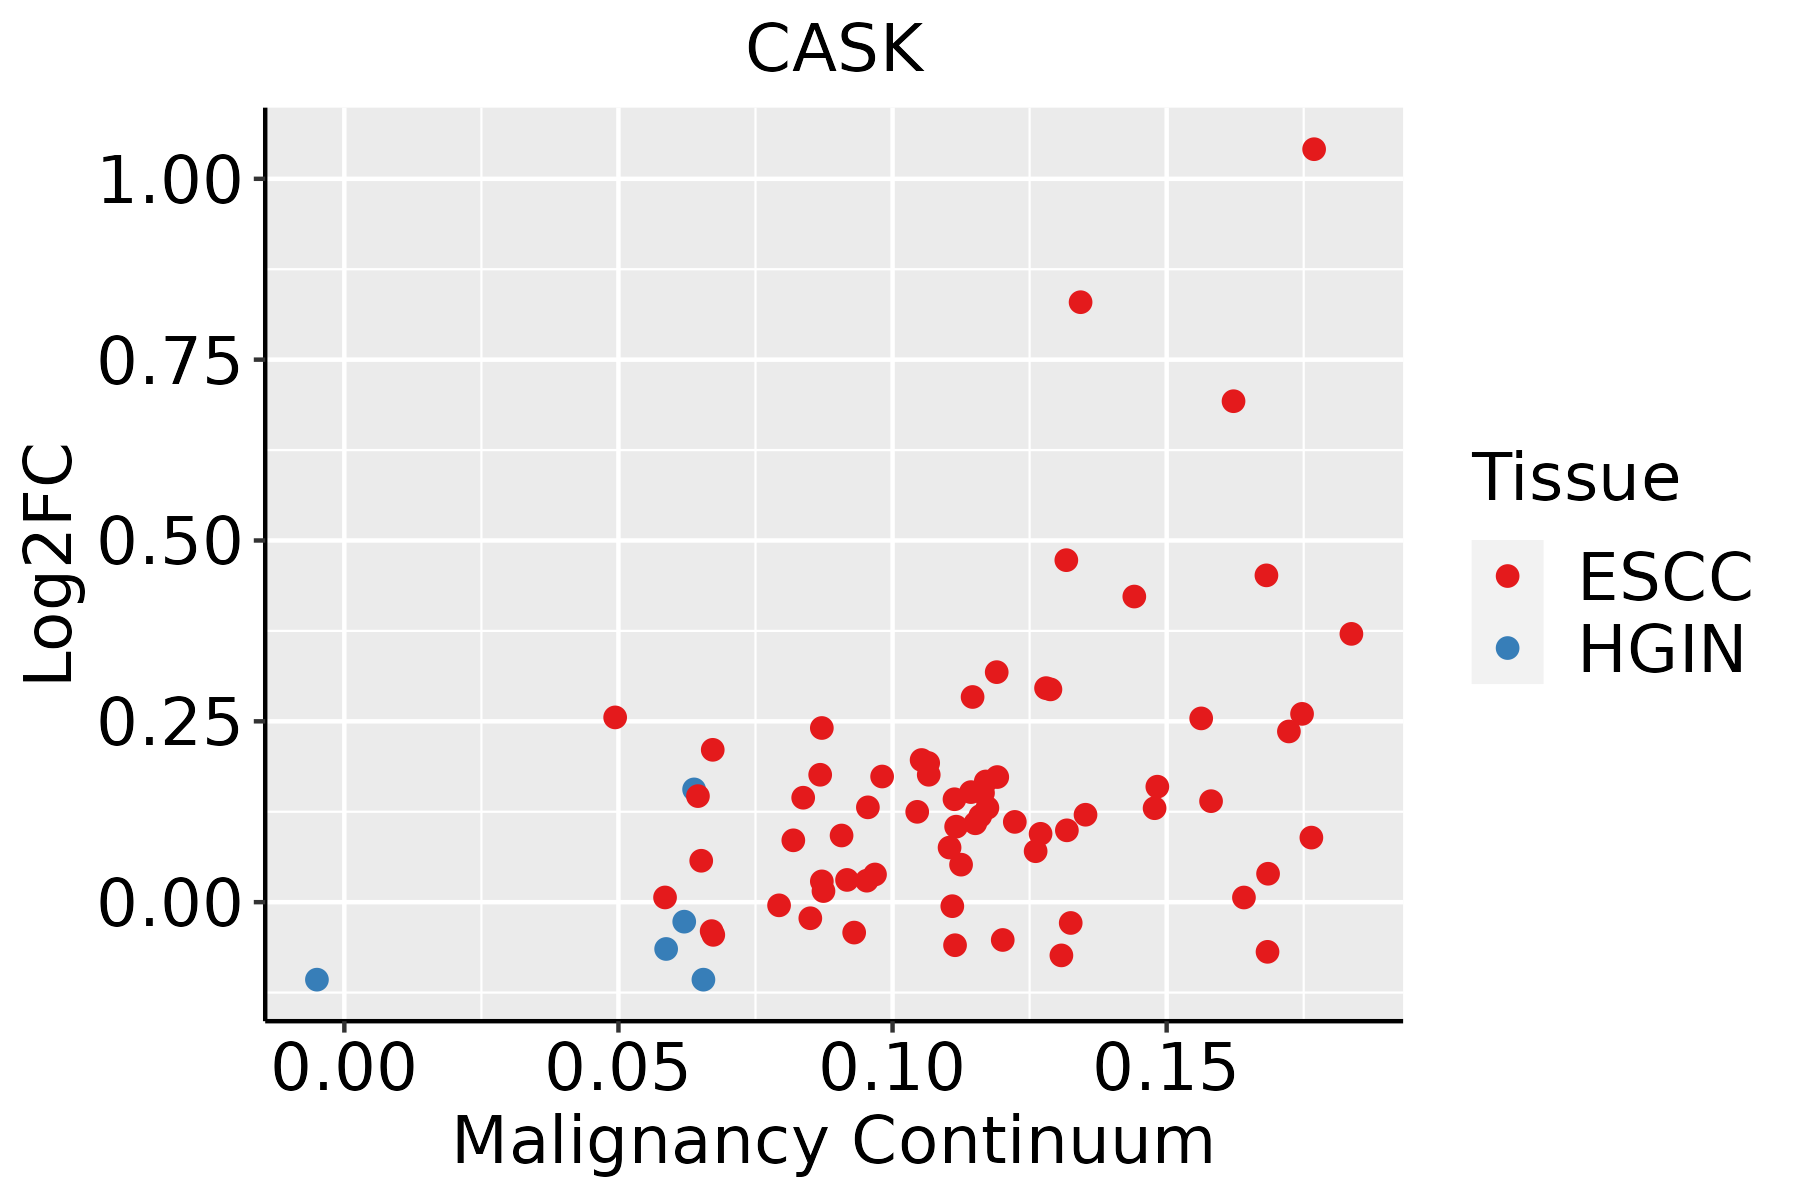 | ESCC: Esophageal squamous cell carcinoma |
| HGIN: High-grade intraepithelial neoplasias |
| LGIN: Low-grade intraepithelial neoplasias |
| GC | 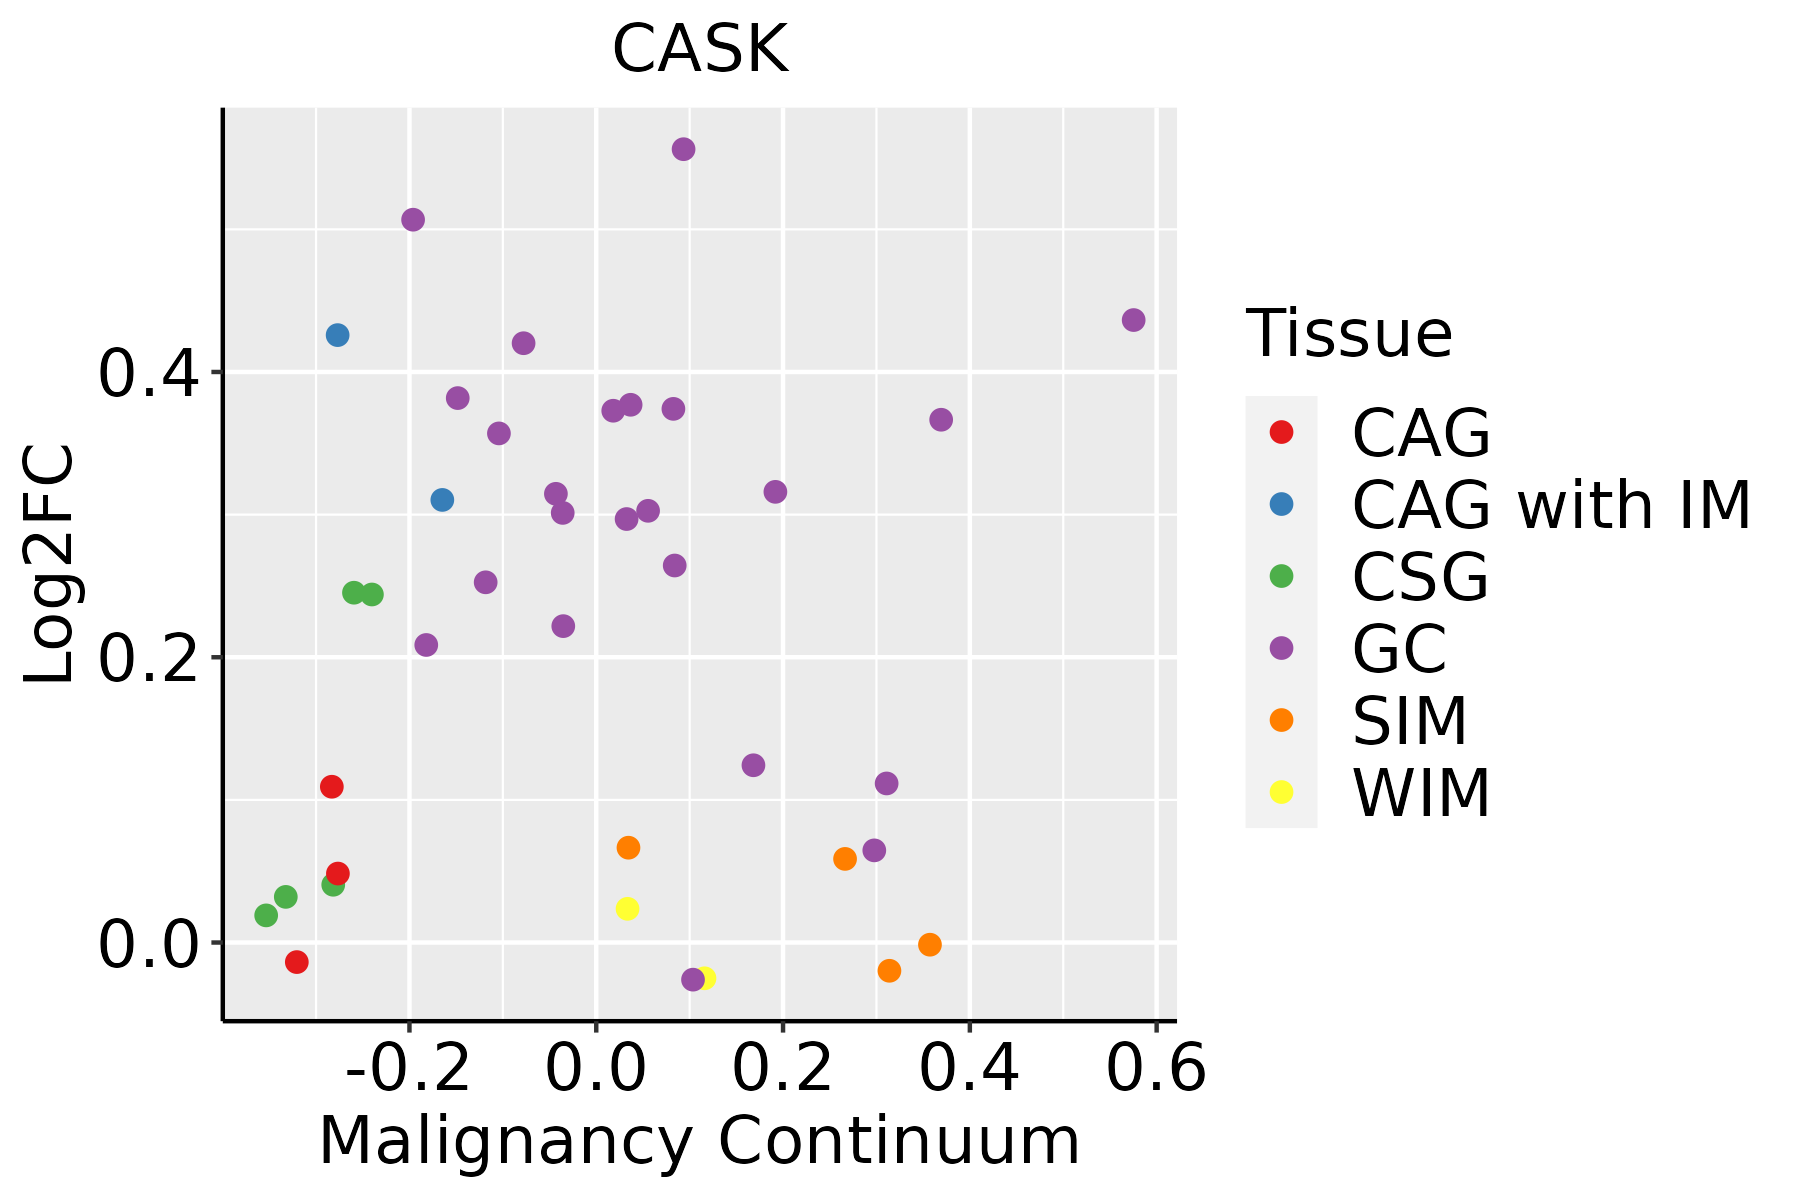 | CAG: Chronic atrophic gastritis |
| CAG with IM: Chronic atrophic gastritis with intestinal metaplasia |
| CSG: Chronic superficial gastritis |
| GC: Gastric cancer |
| SIM: Severe intestinal metaplasia |
| WIM: Wild intestinal metaplasia |
| Liver |  | HCC: Hepatocellular carcinoma |
| NAFLD: Non-alcoholic fatty liver disease |
| Lung | 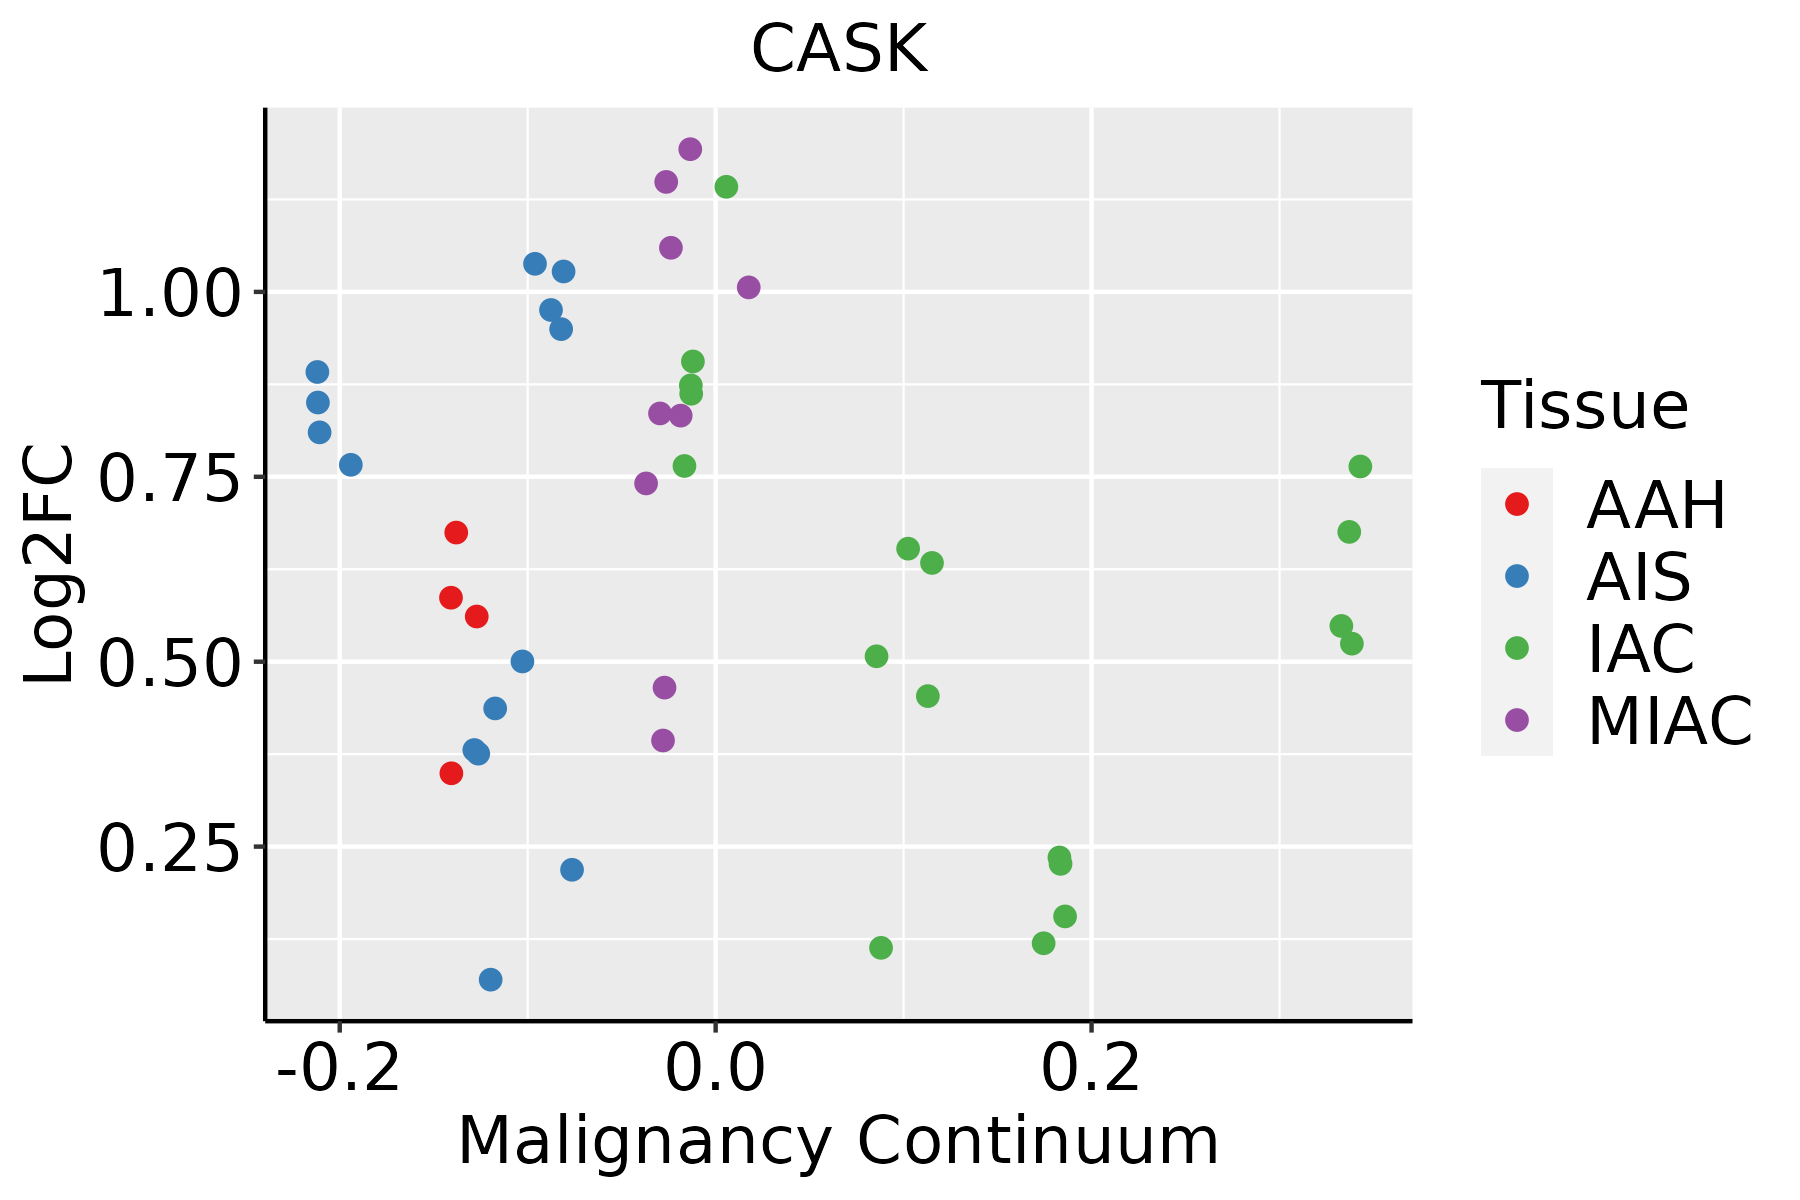 | AAH: Atypical adenomatous hyperplasia |
| AIS: Adenocarcinoma in situ |
| IAC: Invasive lung adenocarcinoma |
| MIA: Minimally invasive adenocarcinoma |
| Oral Cavity | 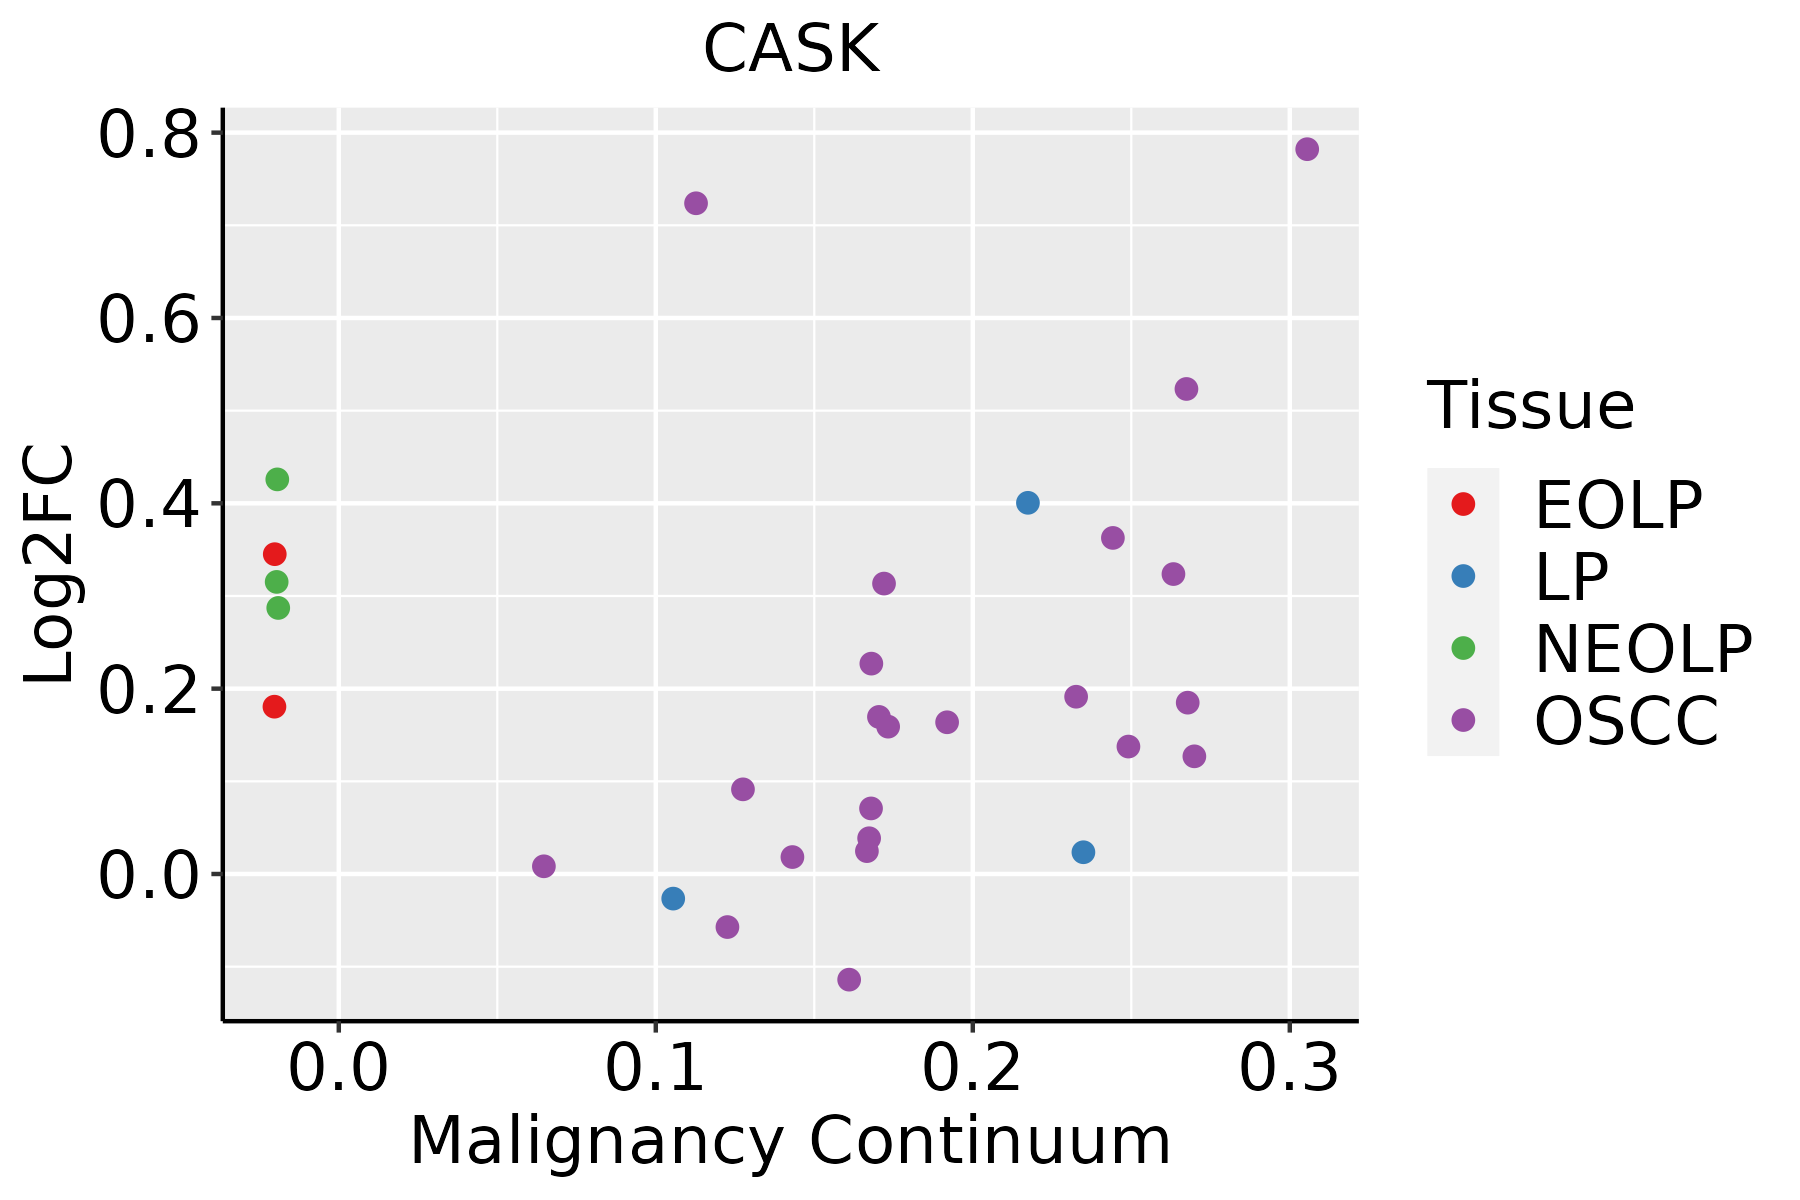 | EOLP: Erosive Oral lichen planus |
| LP: leukoplakia |
| NEOLP: Non-erosive oral lichen planus |
| OSCC: Oral squamous cell carcinoma |
| Prostate | 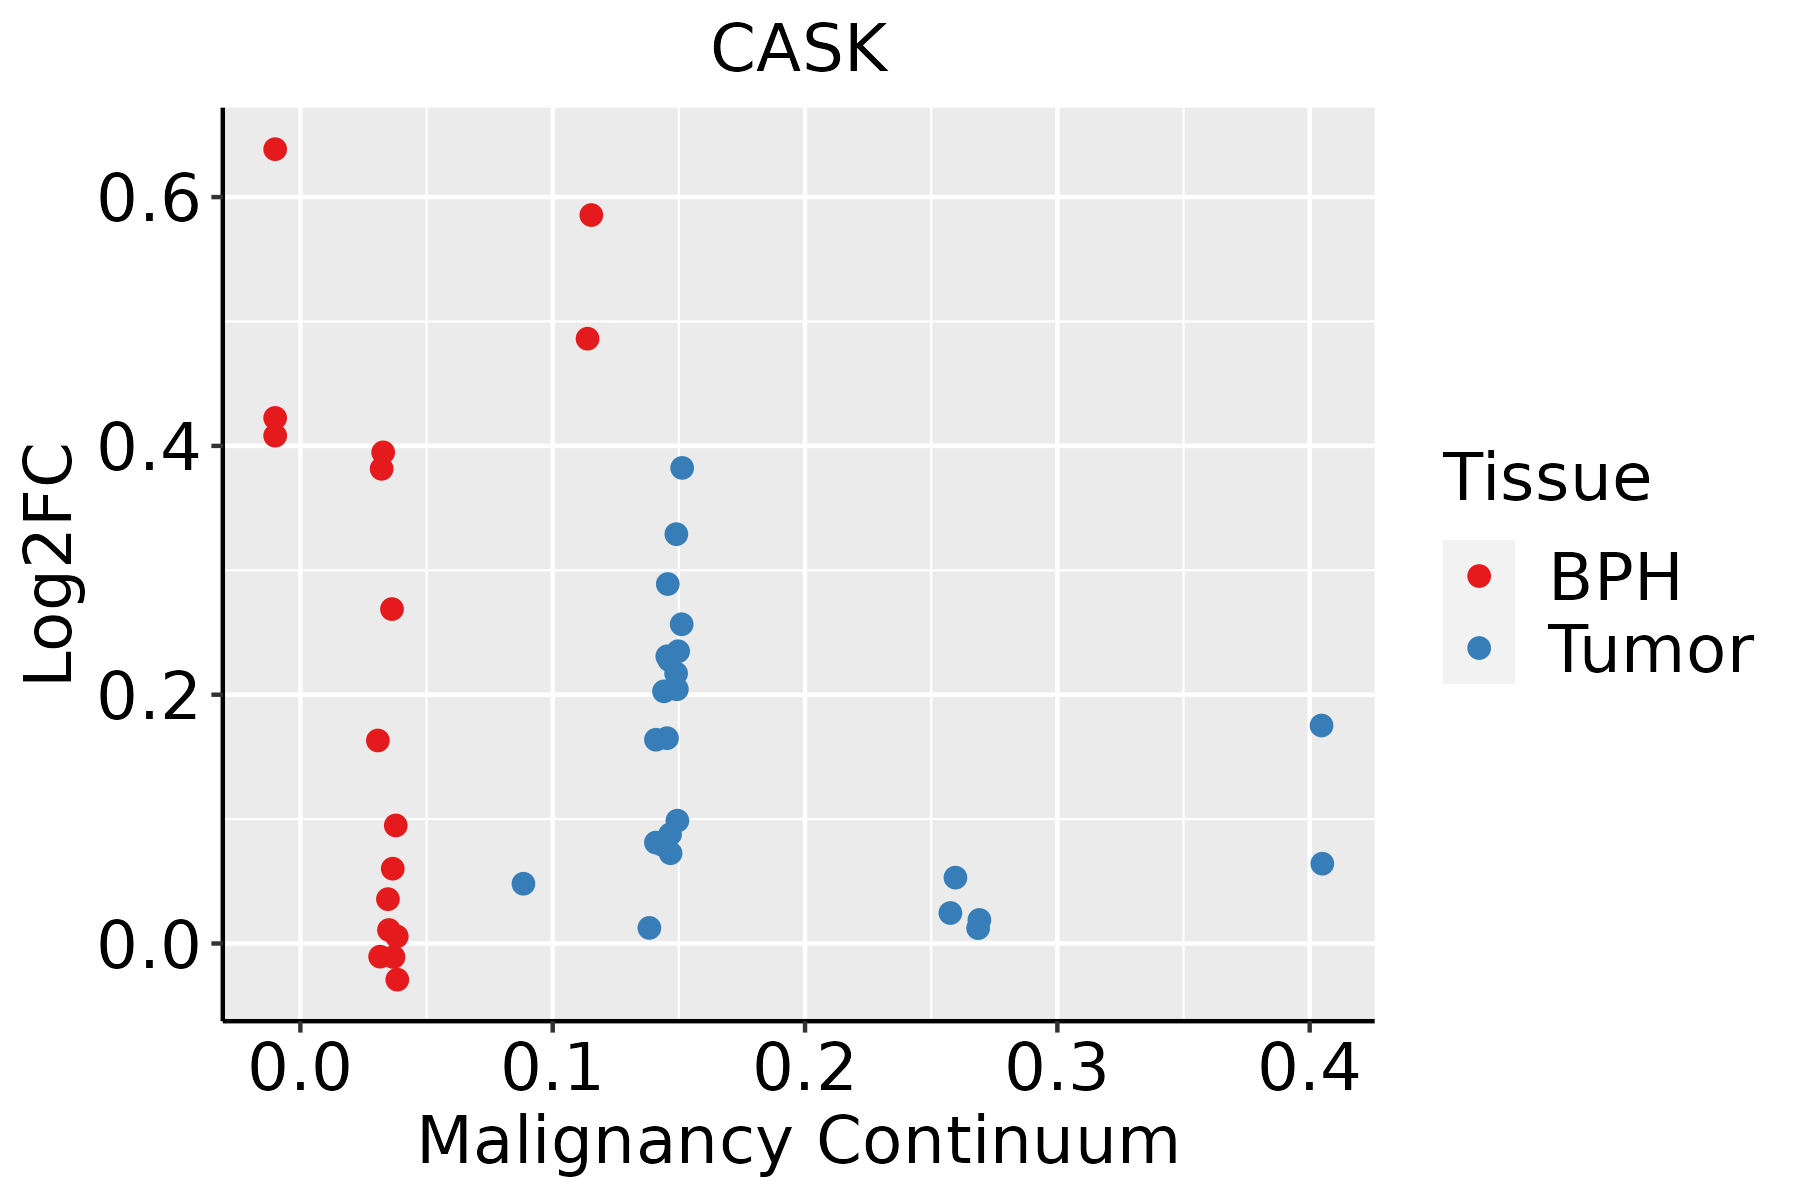 | BPH: Benign Prostatic Hyperplasia |
| Skin | 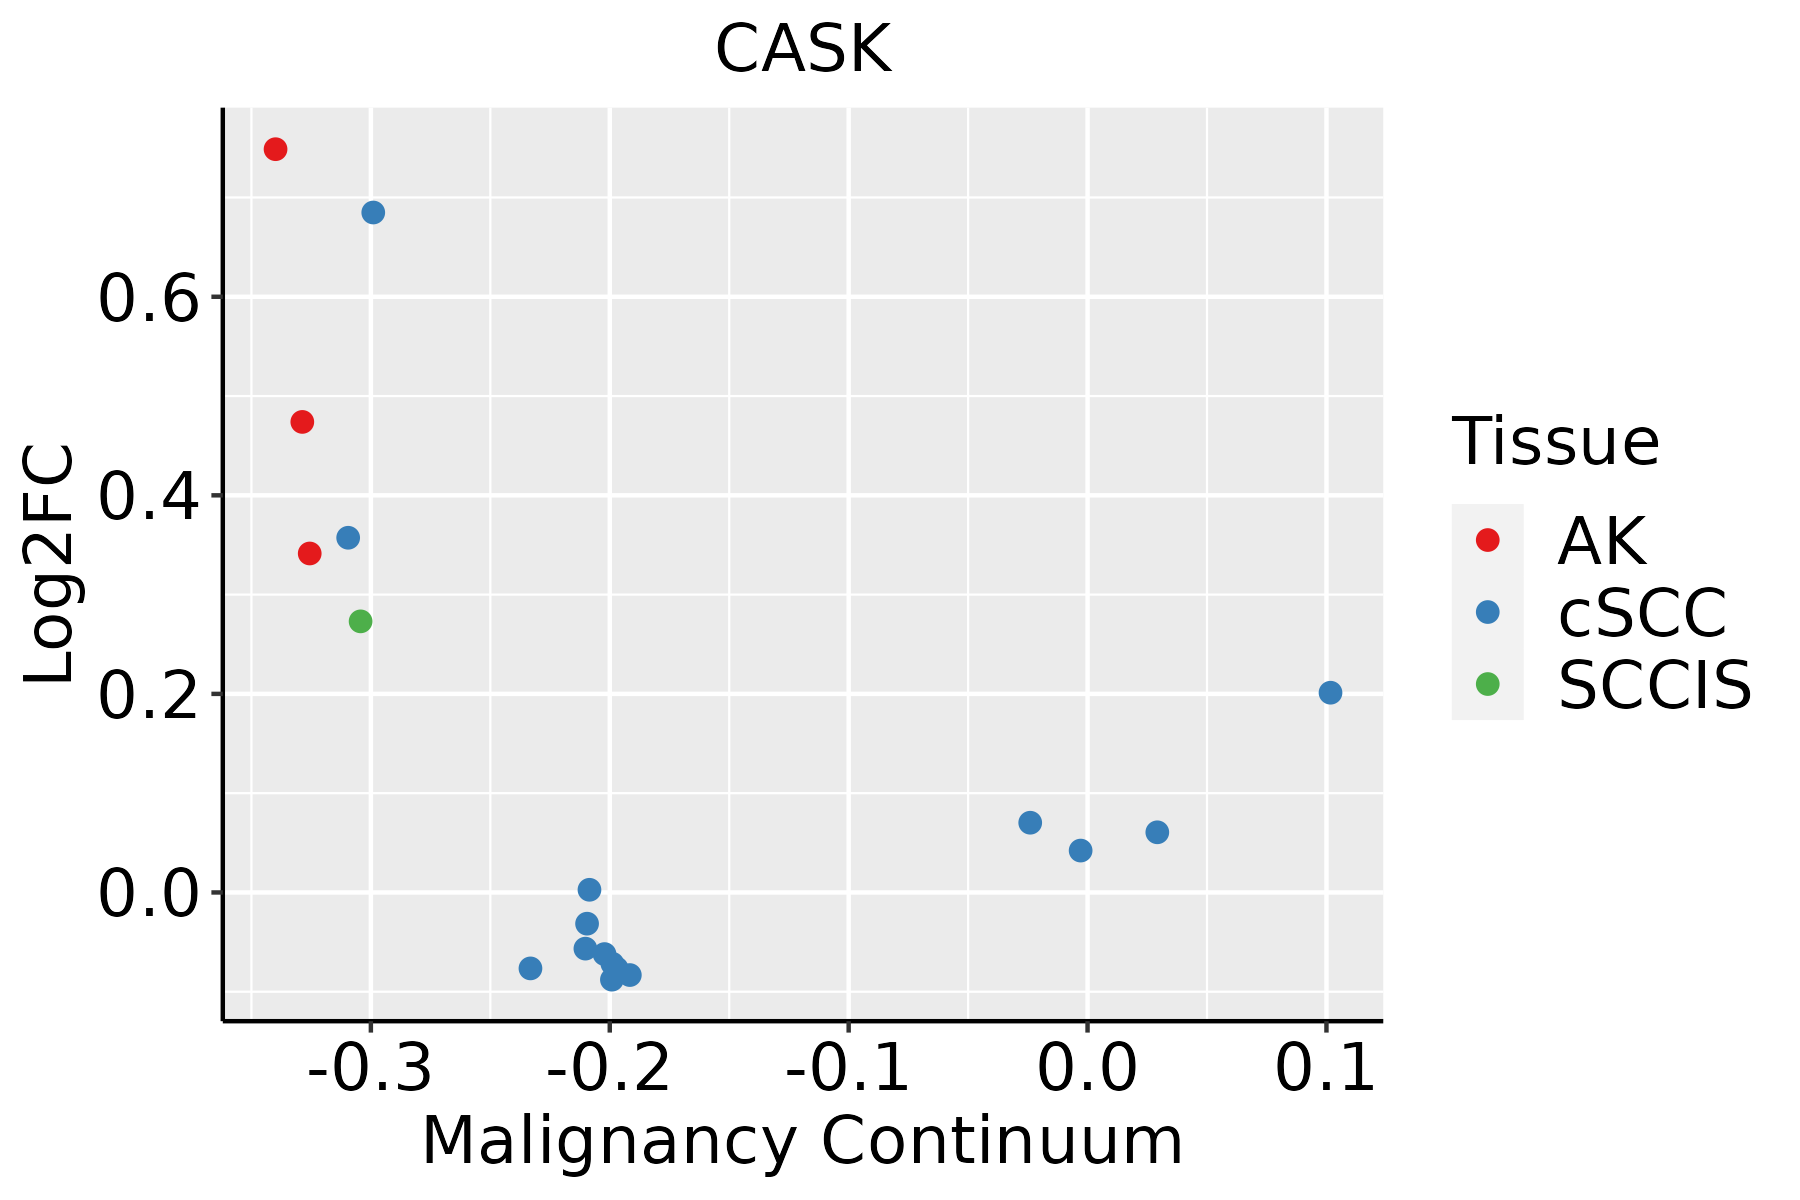 | AK: Actinic keratosis |
| cSCC: Cutaneous squamous cell carcinoma |
| SCCIS:squamous cell carcinoma in situ |
| GO ID | Tissue | Disease Stage | Description | Gene Ratio | Bg Ratio | pvalue | p.adjust | Count |
| GO:004206010 | Cervix | CC | wound healing | 109/2311 | 422/18723 | 1.84e-14 | 1.57e-11 | 109 |
| GO:001081010 | Cervix | CC | regulation of cell-substrate adhesion | 69/2311 | 221/18723 | 8.57e-14 | 5.69e-11 | 69 |
| GO:00315898 | Cervix | CC | cell-substrate adhesion | 96/2311 | 363/18723 | 1.48e-13 | 8.85e-11 | 96 |
| GO:00506737 | Cervix | CC | epithelial cell proliferation | 98/2311 | 437/18723 | 2.01e-09 | 2.15e-07 | 98 |
| GO:00019528 | Cervix | CC | regulation of cell-matrix adhesion | 40/2311 | 128/18723 | 1.32e-08 | 1.04e-06 | 40 |
| GO:00071608 | Cervix | CC | cell-matrix adhesion | 60/2311 | 233/18723 | 1.58e-08 | 1.23e-06 | 60 |
| GO:00071626 | Cervix | CC | negative regulation of cell adhesion | 72/2311 | 303/18723 | 2.36e-08 | 1.70e-06 | 72 |
| GO:00506787 | Cervix | CC | regulation of epithelial cell proliferation | 83/2311 | 381/18723 | 1.31e-07 | 6.42e-06 | 83 |
| GO:19030349 | Cervix | CC | regulation of response to wounding | 44/2311 | 167/18723 | 6.33e-07 | 2.31e-05 | 44 |
| GO:00610418 | Cervix | CC | regulation of wound healing | 34/2311 | 134/18723 | 2.70e-05 | 4.52e-04 | 34 |
| GO:00108122 | Cervix | CC | negative regulation of cell-substrate adhesion | 21/2311 | 68/18723 | 4.35e-05 | 6.66e-04 | 21 |
| GO:00436164 | Cervix | CC | keratinocyte proliferation | 15/2311 | 46/18723 | 2.70e-04 | 2.97e-03 | 15 |
| GO:00196939 | Cervix | CC | ribose phosphate metabolic process | 72/2311 | 396/18723 | 4.49e-04 | 4.48e-03 | 72 |
| GO:00092599 | Cervix | CC | ribonucleotide metabolic process | 70/2311 | 385/18723 | 5.35e-04 | 5.18e-03 | 70 |
| GO:00321022 | Cervix | CC | negative regulation of response to external stimulus | 75/2311 | 420/18723 | 5.96e-04 | 5.61e-03 | 75 |
| GO:00108376 | Cervix | CC | regulation of keratinocyte proliferation | 12/2311 | 35/18723 | 6.55e-04 | 6.05e-03 | 12 |
| GO:000915010 | Cervix | CC | purine ribonucleotide metabolic process | 66/2311 | 368/18723 | 1.09e-03 | 9.07e-03 | 66 |
| GO:00171574 | Cervix | CC | regulation of exocytosis | 39/2311 | 202/18723 | 2.90e-03 | 1.93e-02 | 39 |
| GO:000616310 | Cervix | CC | purine nucleotide metabolic process | 67/2311 | 396/18723 | 4.41e-03 | 2.69e-02 | 67 |
| GO:007252110 | Cervix | CC | purine-containing compound metabolic process | 69/2311 | 416/18723 | 6.27e-03 | 3.54e-02 | 69 |
| Hugo Symbol | Variant Class | Variant Classification | dbSNP RS | HGVSc | HGVSp | HGVSp Short | SWISSPROT | BIOTYPE | SIFT | PolyPhen | Tumor Sample Barcode | Tissue | Histology | Sex | Age | Stage | Therapy Types | Drugs | Outcome |
| CASK | SNV | Missense_Mutation | | c.2668N>G | p.Ile890Val | p.I890V | O14936 | protein_coding | tolerated(1) | benign(0) | TCGA-A1-A0SD-01 | Breast | breast invasive carcinoma | Female | <65 | I/II | Unknown | Unknown | SD |
| CASK | SNV | Missense_Mutation | | c.1870G>C | p.Asp624His | p.D624H | O14936 | protein_coding | deleterious(0) | probably_damaging(0.965) | TCGA-A2-A04R-01 | Breast | breast invasive carcinoma | Female | <65 | I/II | Chemotherapy | taxol | SD |
| CASK | SNV | Missense_Mutation | | c.1727N>T | p.Ser576Leu | p.S576L | O14936 | protein_coding | tolerated(0.17) | benign(0) | TCGA-A2-A0YT-01 | Breast | breast invasive carcinoma | Female | <65 | III/IV | Hormone Therapy | arimidex | SD |
| CASK | SNV | Missense_Mutation | novel | c.527N>G | p.Ala176Gly | p.A176G | O14936 | protein_coding | tolerated(0.25) | benign(0.017) | TCGA-A2-A4S1-01 | Breast | breast invasive carcinoma | Female | >=65 | I/II | Unknown | Unknown | SD |
| CASK | SNV | Missense_Mutation | | c.847G>A | p.Ala283Thr | p.A283T | O14936 | protein_coding | deleterious(0.02) | benign(0.098) | TCGA-AO-A128-01 | Breast | breast invasive carcinoma | Female | <65 | I/II | Chemotherapy | doxorubicin | SD |
| CASK | SNV | Missense_Mutation | novel | c.1521G>A | p.Met507Ile | p.M507I | O14936 | protein_coding | tolerated(0.25) | benign(0.015) | TCGA-BH-A2L8-01 | Breast | breast invasive carcinoma | Female | <65 | I/II | Chemotherapy | cytoxan | CR |
| CASK | SNV | Missense_Mutation | | c.2454N>G | p.Ile818Met | p.I818M | O14936 | protein_coding | deleterious(0) | probably_damaging(0.996) | TCGA-C8-A26Y-01 | Breast | breast invasive carcinoma | Female | >=65 | I/II | Unknown | Unknown | SD |
| CASK | SNV | Missense_Mutation | | c.1916N>A | p.Arg639Gln | p.R639Q | O14936 | protein_coding | tolerated(0.52) | benign(0.313) | TCGA-D8-A27G-01 | Breast | breast invasive carcinoma | Female | >=65 | I/II | Unknown | Unknown | SD |
| CASK | insertion | Frame_Shift_Ins | novel | c.14_15insGTTGGGGTTATTGTTACCTTGCATGTACCATAGACCATTTTTGAAAC | p.Asp5GlufsTer29 | p.D5Efs*29 | O14936 | protein_coding | | | TCGA-AN-A0FX-01 | Breast | breast invasive carcinoma | Female | <65 | I/II | Unknown | Unknown | SD |
| CASK | insertion | Frame_Shift_Ins | novel | c.1519dupA | p.Met507AsnfsTer3 | p.M507Nfs*3 | O14936 | protein_coding | | | TCGA-BH-A2L8-01 | Breast | breast invasive carcinoma | Female | <65 | I/II | Chemotherapy | cytoxan | CR |


