
|
|||||
|
 | |
| |
| |
| |
| |
| |
|
Gene: CARS2 |
Gene summary for CARS2 |
| Gene information | Species | Human | Gene symbol | CARS2 | Gene ID | 79587 |
| Gene name | cysteinyl-tRNA synthetase 2, mitochondrial | |
| Gene Alias | COXPD27 | |
| Cytomap | 13q34 | |
| Gene Type | protein-coding | GO ID | GO:0006082 | UniProtAcc | B7Z7E6 |
Top |
Malignant transformation analysis |
| Identification of the aberrant gene expression in precancerous and cancerous lesions by comparing the gene expression of stem-like cells in diseased tissues with normal stem cells |
| Entrez ID | Symbol | Replicates | Species | Organ | Tissue | Adj P-value | Log2FC | Malignancy |
| 79587 | CARS2 | HTA11_99999965104_69814 | Human | Colorectum | MSS | 4.95e-06 | 5.89e-01 | 0.281 |
| 79587 | CARS2 | HTA11_99999971662_82457 | Human | Colorectum | MSS | 5.54e-06 | 6.72e-01 | 0.3859 |
| 79587 | CARS2 | HTA11_99999973899_84307 | Human | Colorectum | MSS | 7.96e-16 | 1.57e+00 | 0.2585 |
| 79587 | CARS2 | HTA11_99999974143_84620 | Human | Colorectum | MSS | 1.08e-02 | 3.13e-01 | 0.3005 |
| 79587 | CARS2 | A015-C-203 | Human | Colorectum | FAP | 1.02e-06 | -1.36e-01 | -0.1294 |
| 79587 | CARS2 | A001-C-108 | Human | Colorectum | FAP | 1.93e-02 | -6.90e-02 | -0.0272 |
| 79587 | CARS2 | A002-C-205 | Human | Colorectum | FAP | 1.28e-02 | -5.60e-02 | -0.1236 |
| 79587 | CARS2 | A015-C-006 | Human | Colorectum | FAP | 4.13e-02 | -1.72e-01 | -0.0994 |
| 79587 | CARS2 | A015-C-106 | Human | Colorectum | FAP | 3.04e-03 | -6.41e-02 | -0.0511 |
| 79587 | CARS2 | A002-C-114 | Human | Colorectum | FAP | 2.87e-02 | -1.08e-01 | -0.1561 |
| 79587 | CARS2 | A015-C-104 | Human | Colorectum | FAP | 4.70e-11 | -2.12e-01 | -0.1899 |
| 79587 | CARS2 | A001-C-014 | Human | Colorectum | FAP | 2.35e-03 | -1.25e-01 | 0.0135 |
| 79587 | CARS2 | A002-C-016 | Human | Colorectum | FAP | 2.42e-06 | -1.60e-01 | 0.0521 |
| 79587 | CARS2 | A015-C-002 | Human | Colorectum | FAP | 4.59e-02 | -2.40e-01 | -0.0763 |
| 79587 | CARS2 | A001-C-203 | Human | Colorectum | FAP | 1.85e-03 | -1.79e-02 | -0.0481 |
| 79587 | CARS2 | A002-C-116 | Human | Colorectum | FAP | 1.90e-11 | -1.31e-01 | -0.0452 |
| 79587 | CARS2 | A018-E-020 | Human | Colorectum | FAP | 4.89e-02 | -1.04e-01 | -0.2034 |
| 79587 | CARS2 | F034 | Human | Colorectum | FAP | 1.19e-04 | -1.96e-03 | -0.0665 |
| 79587 | CARS2 | LZE7T | Human | Esophagus | ESCC | 1.09e-03 | 1.55e-01 | 0.0667 |
| 79587 | CARS2 | LZE24T | Human | Esophagus | ESCC | 1.83e-08 | 1.61e-01 | 0.0596 |
| Page: 1 2 3 4 5 6 |
| Tissue | Expression Dynamics | Abbreviation |
| Colorectum (GSE201348) |  | FAP: Familial adenomatous polyposis |
| CRC: Colorectal cancer | ||
| Colorectum (HTA11) |  | AD: Adenomas |
| SER: Sessile serrated lesions | ||
| MSI-H: Microsatellite-high colorectal cancer | ||
| MSS: Microsatellite stable colorectal cancer | ||
| Esophagus | 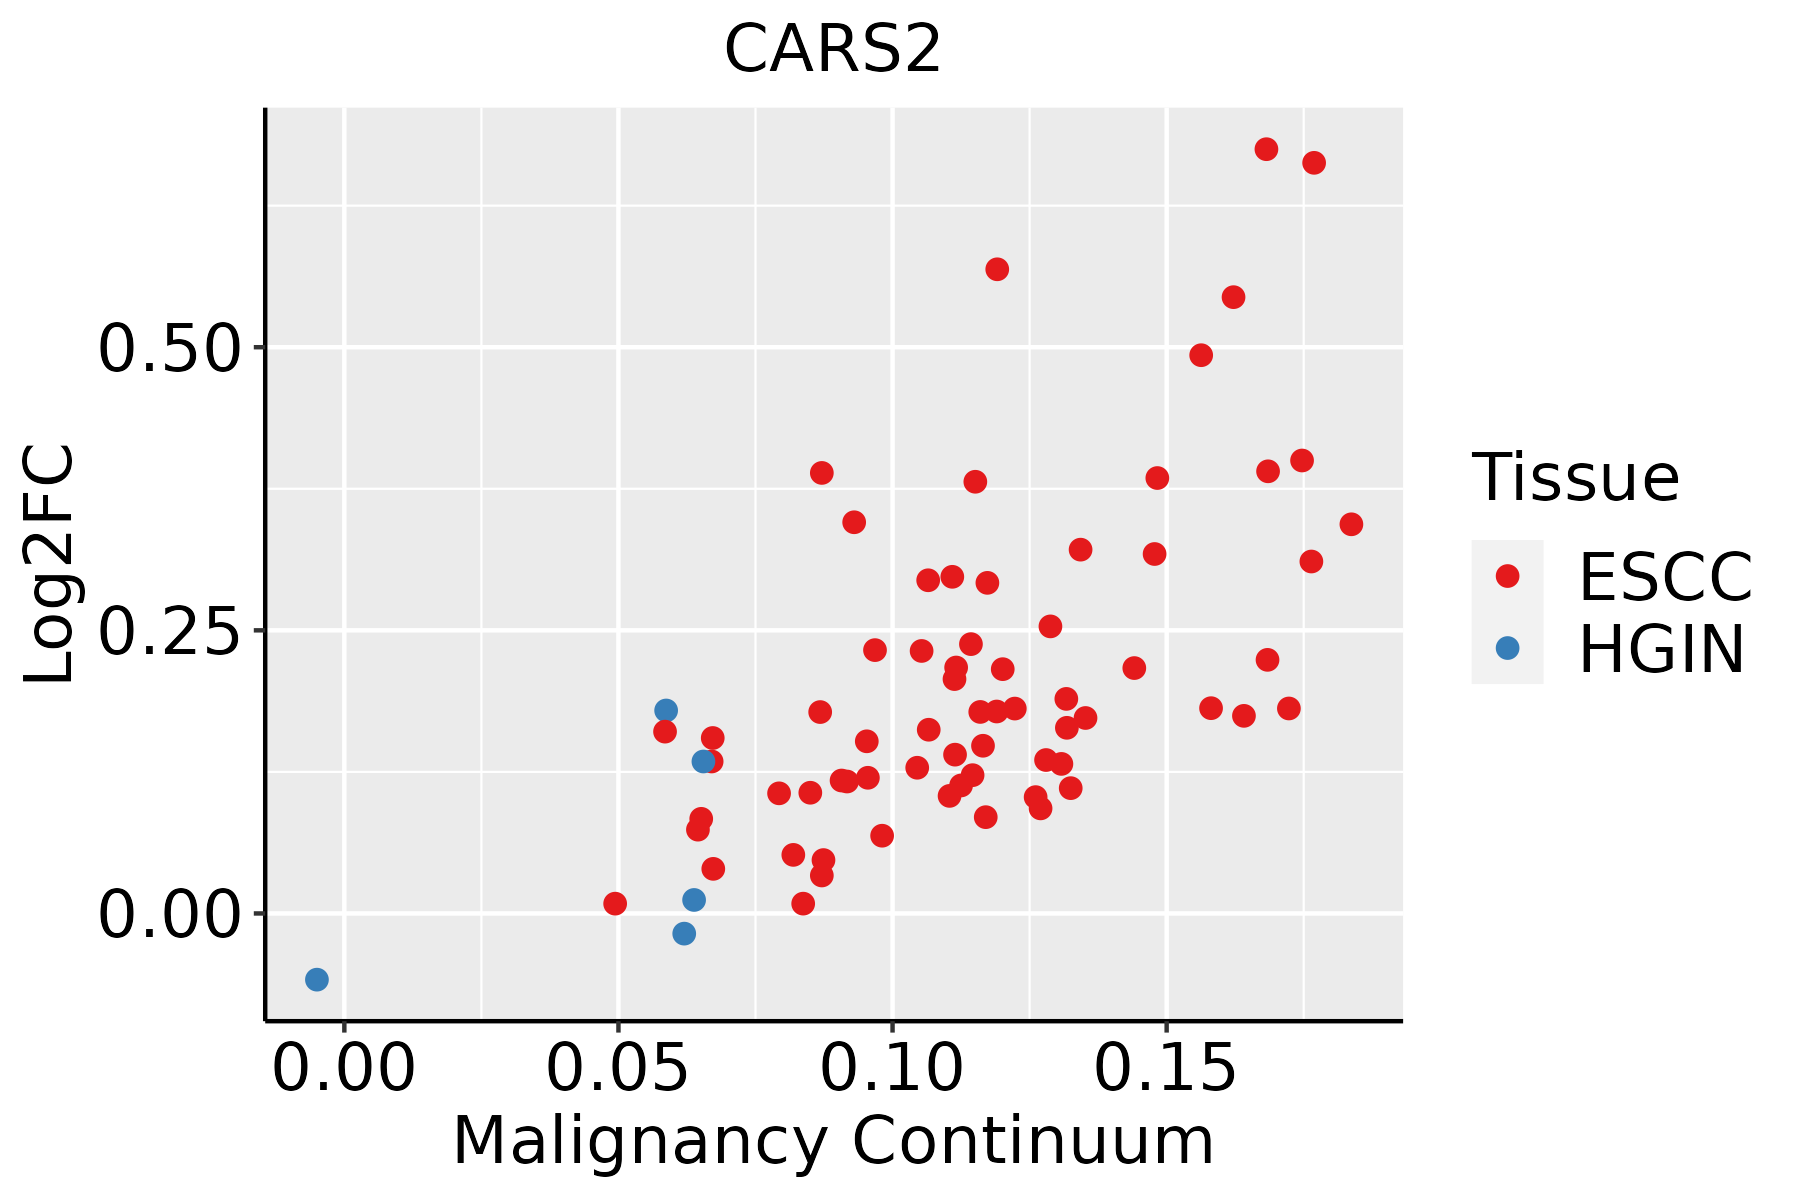 | ESCC: Esophageal squamous cell carcinoma |
| HGIN: High-grade intraepithelial neoplasias | ||
| LGIN: Low-grade intraepithelial neoplasias | ||
| Oral Cavity | 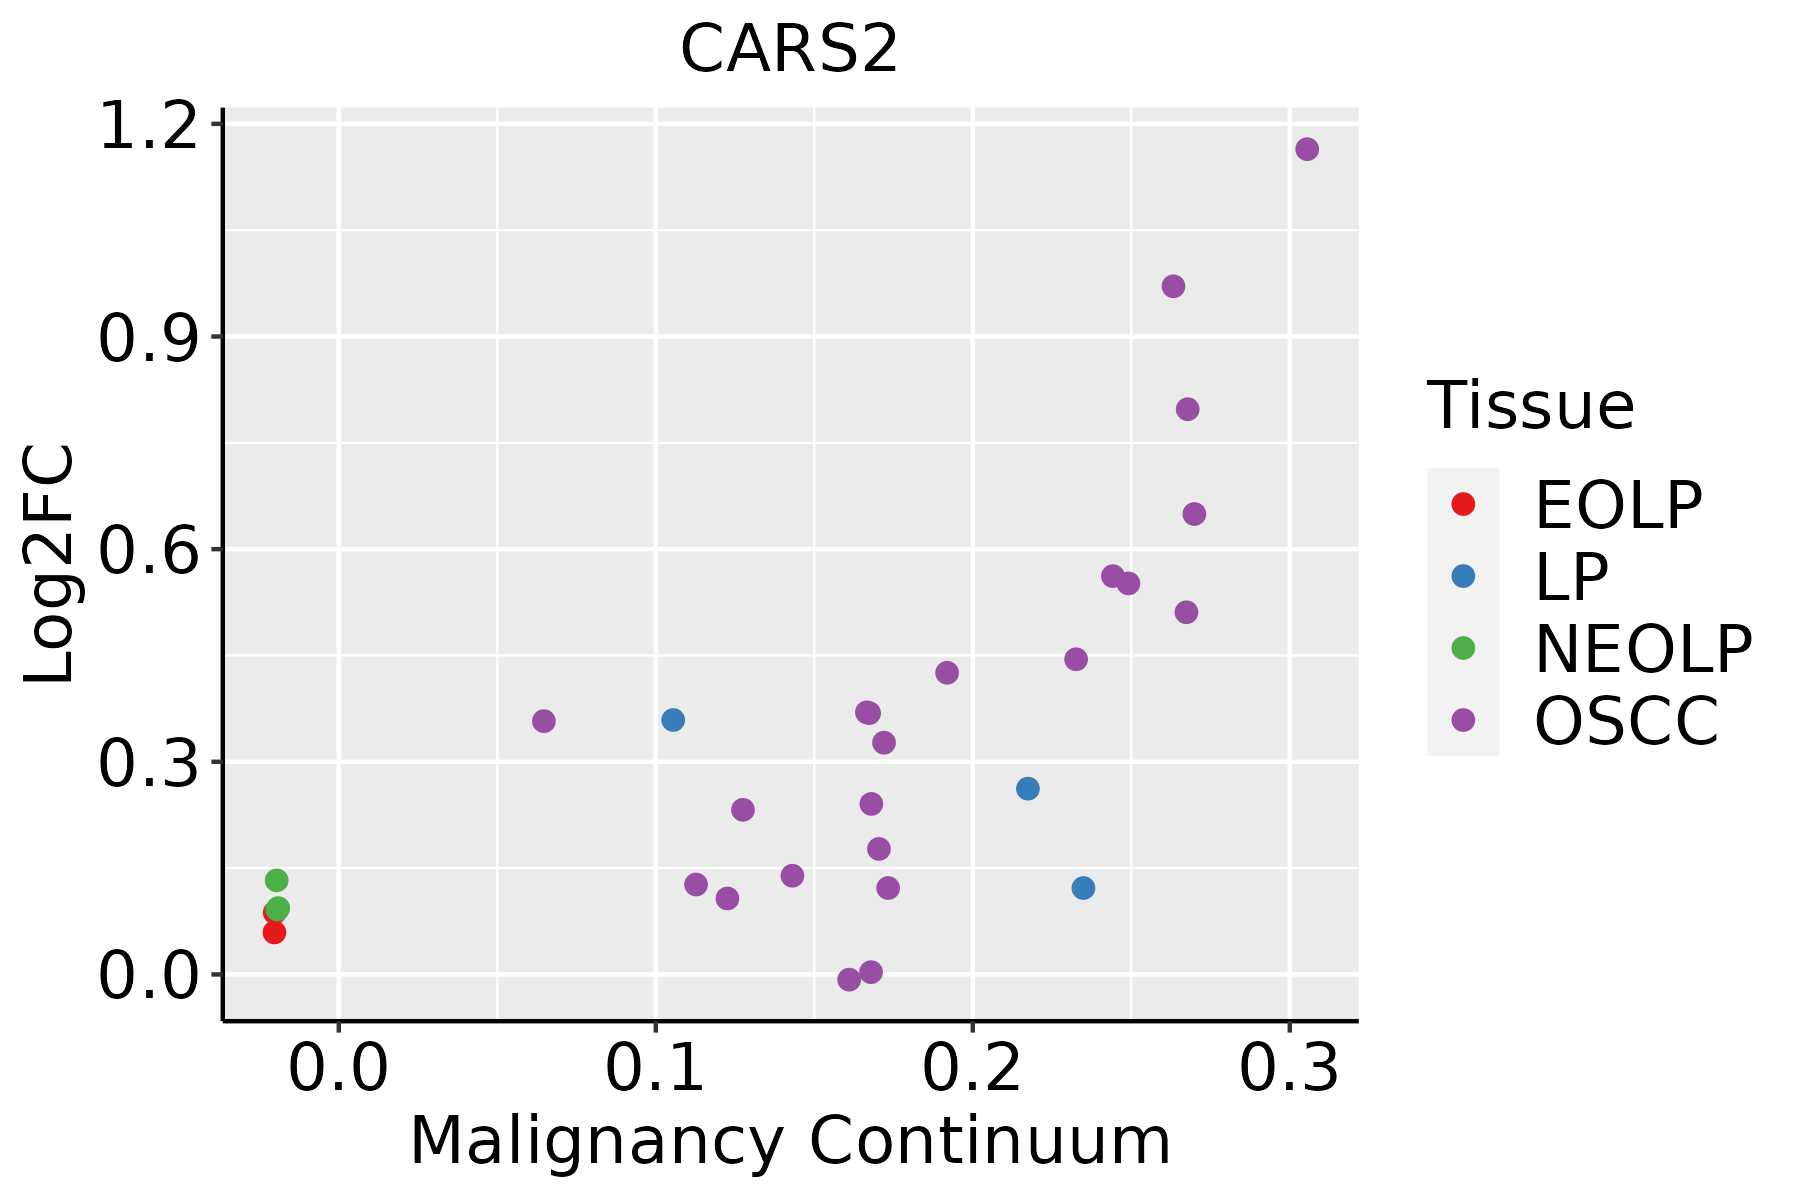 | EOLP: Erosive Oral lichen planus |
| LP: leukoplakia | ||
| NEOLP: Non-erosive oral lichen planus | ||
| OSCC: Oral squamous cell carcinoma | ||
| Skin | 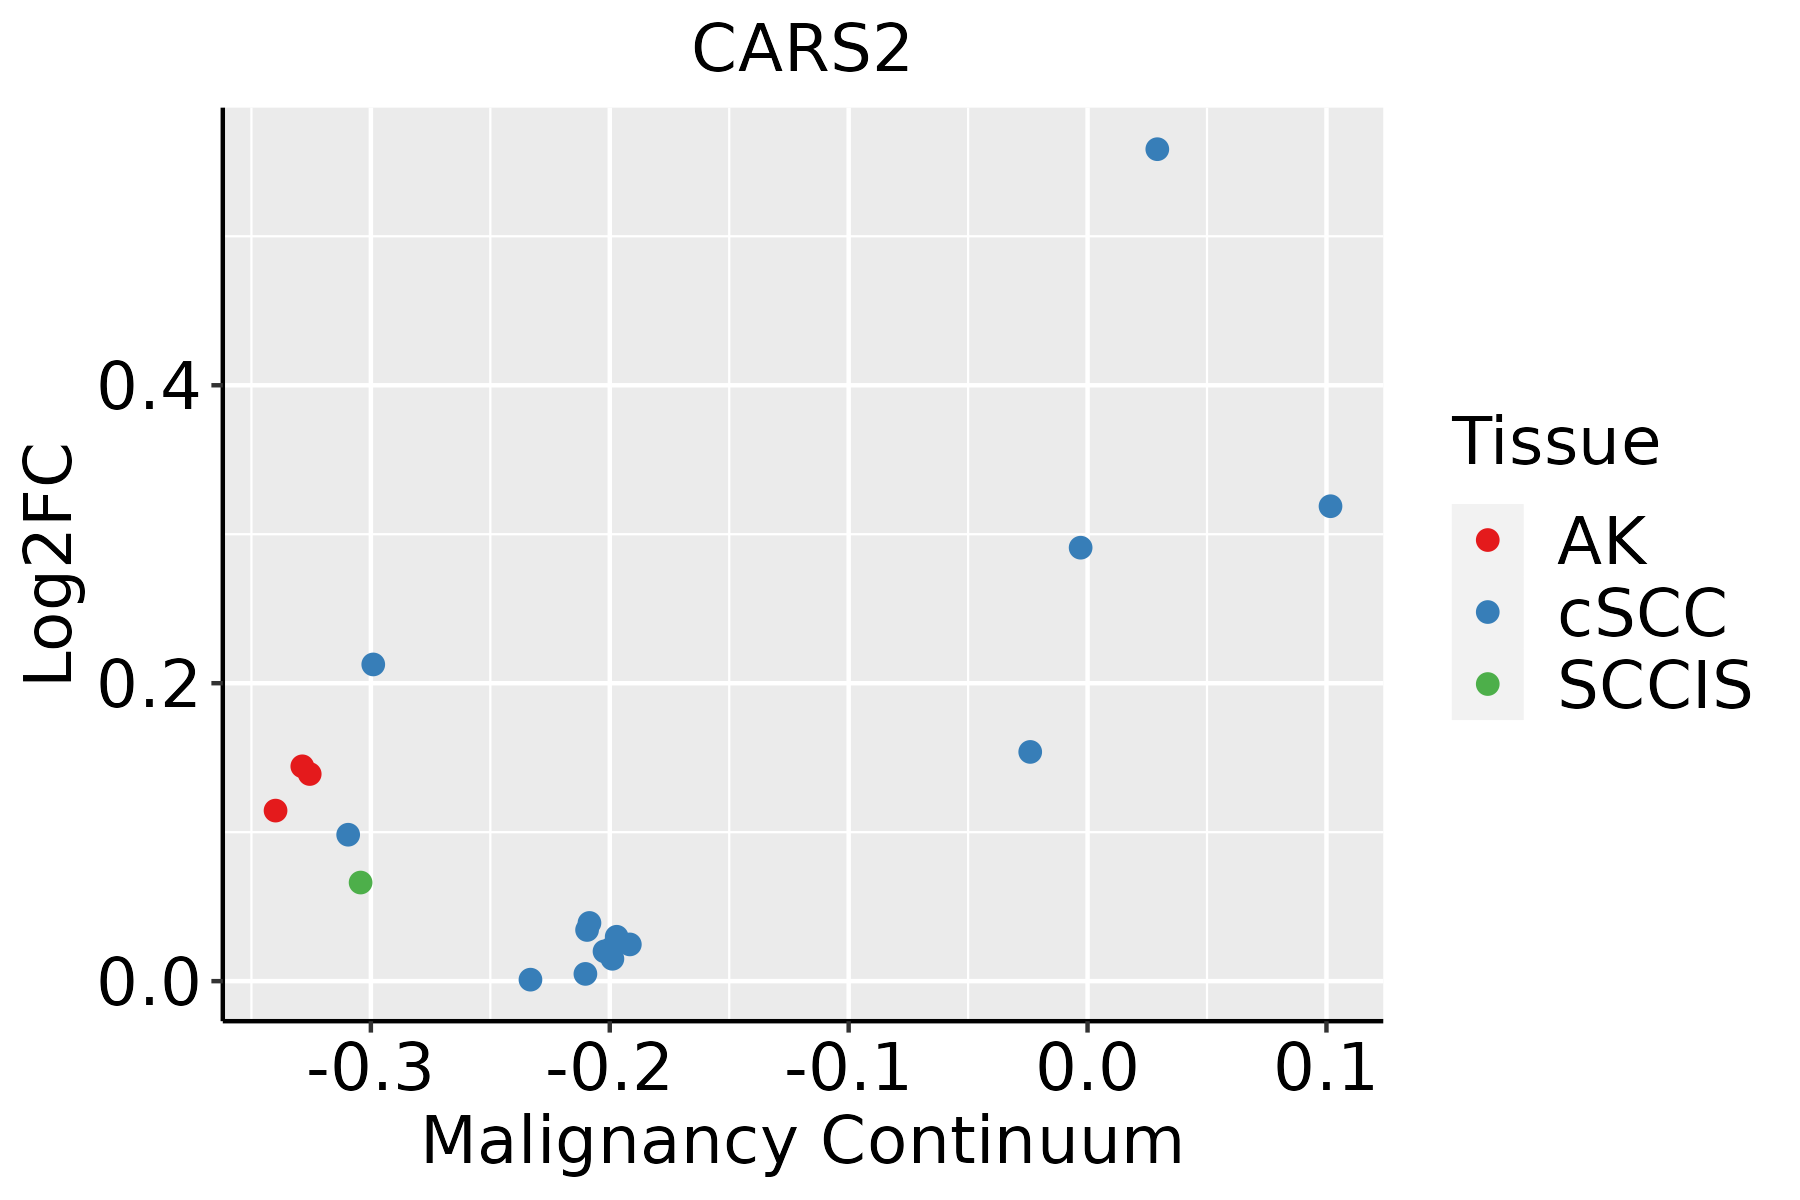 | AK: Actinic keratosis |
| cSCC: Cutaneous squamous cell carcinoma | ||
| SCCIS:squamous cell carcinoma in situ | ||
| Thyroid | 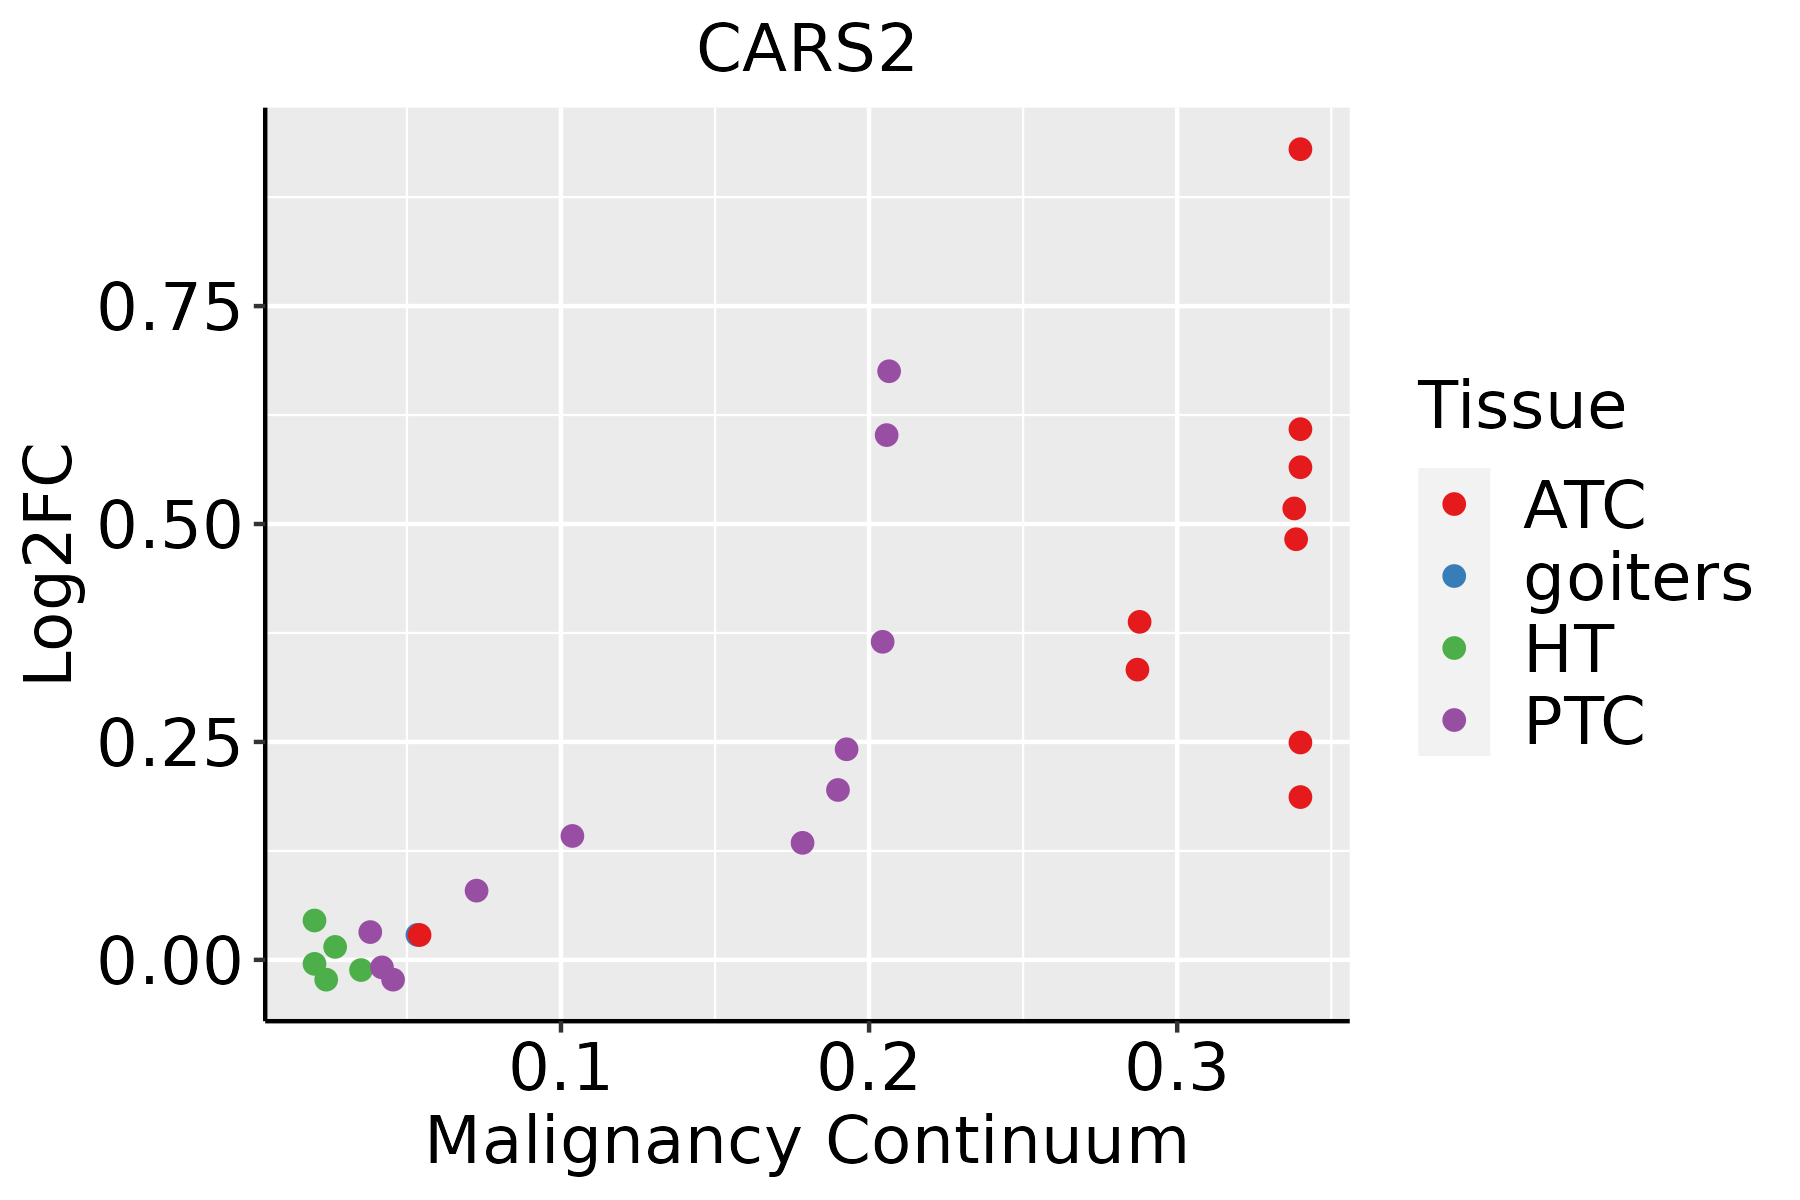 | ATC: Anaplastic thyroid cancer |
| HT: Hashimoto's thyroiditis | ||
| PTC: Papillary thyroid cancer |
| ∗log2FC in expression of this searched gene in stem-like cells from each diseased tissue sample relative to stem-like cells in normal samples in each tissue plotted against the malignancy continuum. Samples are colored based on if they are from different disease stage. |
Top |
Malignant transformation related pathway analysis |
| Find out the enriched GO biological processes and KEGG pathways involved in transition from healthy to precancer to cancer |
| Tissue | Disease Stage | Enriched GO biological Processes |
| Colorectum | AD |  |
| Colorectum | SER |  |
| Colorectum | MSS |  |
| Colorectum | MSI-H |  |
| Colorectum | FAP |  |
| ∗Top 15 enriched GO BP terms are showed in the bar plot of each disease state in each tissue. Each row represents a significant GO biological process which is colored according to the -log10(p.adjust). |
| Page: 1 2 3 4 5 6 7 8 9 |
| GO ID | Tissue | Disease Stage | Description | Gene Ratio | Bg Ratio | pvalue | p.adjust | Count |
| GO:003466012 | Esophagus | ESCC | ncRNA metabolic process | 346/8552 | 485/18723 | 4.35e-31 | 2.51e-28 | 346 |
| GO:00063992 | Esophagus | ESCC | tRNA metabolic process | 122/8552 | 179/18723 | 9.03e-10 | 2.19e-08 | 122 |
| GO:00346605 | Oral cavity | OSCC | ncRNA metabolic process | 296/7305 | 485/18723 | 2.94e-23 | 6.65e-21 | 296 |
| GO:00063991 | Oral cavity | OSCC | tRNA metabolic process | 101/7305 | 179/18723 | 1.65e-06 | 2.15e-05 | 101 |
| GO:00346607 | Skin | AK | ncRNA metabolic process | 75/1910 | 485/18723 | 1.64e-04 | 1.93e-03 | 75 |
| GO:003466013 | Skin | cSCC | ncRNA metabolic process | 234/4864 | 485/18723 | 1.37e-26 | 4.77e-24 | 234 |
| GO:00063993 | Skin | cSCC | tRNA metabolic process | 64/4864 | 179/18723 | 2.34e-03 | 1.36e-02 | 64 |
| GO:00346608 | Thyroid | PTC | ncRNA metabolic process | 239/5968 | 485/18723 | 5.54e-16 | 4.26e-14 | 239 |
| GO:003466021 | Thyroid | ATC | ncRNA metabolic process | 240/6293 | 485/18723 | 2.03e-13 | 9.91e-12 | 240 |
| Page: 1 |
| Pathway ID | Tissue | Disease Stage | Description | Gene Ratio | Bg Ratio | pvalue | p.adjust | qvalue | Count |
| Page: 1 |
Top |
Cell-cell communication analysis |
| Identification of potential cell-cell interactions between two cell types and their ligand-receptor pairs for different disease states |
| Ligand | Receptor | LRpair | Pathway | Tissue | Disease Stage |
| Page: 1 |
Top |
Single-cell gene regulatory network inference analysis |
| Find out the significant the regulons (TFs) and the target genes of each regulon across cell types for different disease states |
| TF | Cell Type | Tissue | Disease Stage | Target Gene | RSS | Regulon Activity |
| ∗The dot plots of a searched regulon are shown for all cell subpopulations in each disease state of each tissue based on the regulon specific score inferred using pySCENIC and by calculating the average expression. |
| Page: 1 |
Top |
Somatic mutation of malignant transformation related genes |
| Annotation of somatic variants for genes involved in malignant transformation |
| Hugo Symbol | Variant Class | Variant Classification | dbSNP RS | HGVSc | HGVSp | HGVSp Short | SWISSPROT | BIOTYPE | SIFT | PolyPhen | Tumor Sample Barcode | Tissue | Histology | Sex | Age | Stage | Therapy Types | Drugs | Outcome |
| CARS2 | SNV | Missense_Mutation | c.1209G>C | p.Lys403Asn | p.K403N | Q9HA77 | protein_coding | deleterious(0) | possibly_damaging(0.729) | TCGA-D8-A1JA-01 | Breast | breast invasive carcinoma | Female | <65 | III/IV | Chemotherapy | adriamycin | PD | |
| CARS2 | SNV | Missense_Mutation | c.1143N>A | p.Met381Ile | p.M381I | Q9HA77 | protein_coding | tolerated(0.73) | benign(0.001) | TCGA-IR-A3LK-01 | Cervix | cervical & endocervical cancer | Female | >=65 | I/II | Chemotherapy | cisplatin | PD | |
| CARS2 | SNV | Missense_Mutation | rs367861934 | c.446N>G | p.Gln149Arg | p.Q149R | Q9HA77 | protein_coding | tolerated(0.16) | benign(0.021) | TCGA-AA-3492-01 | Colorectum | colon adenocarcinoma | Female | >=65 | I/II | Unknown | Unknown | SD |
| CARS2 | SNV | Missense_Mutation | c.272N>A | p.Ala91Asp | p.A91D | Q9HA77 | protein_coding | deleterious(0) | probably_damaging(1) | TCGA-AA-3672-01 | Colorectum | colon adenocarcinoma | Female | >=65 | III/IV | Unknown | Unknown | SD | |
| CARS2 | SNV | Missense_Mutation | c.355A>G | p.Thr119Ala | p.T119A | Q9HA77 | protein_coding | deleterious(0) | probably_damaging(1) | TCGA-AA-3815-01 | Colorectum | colon adenocarcinoma | Female | >=65 | I/II | Unknown | Unknown | SD | |
| CARS2 | SNV | Missense_Mutation | c.1609N>T | p.Gly537Cys | p.G537C | Q9HA77 | protein_coding | deleterious(0) | probably_damaging(1) | TCGA-F4-6570-01 | Colorectum | colon adenocarcinoma | Female | >=65 | I/II | Unknown | Unknown | SD | |
| CARS2 | SNV | Missense_Mutation | rs150780076 | c.1579N>A | p.Asp527Asn | p.D527N | Q9HA77 | protein_coding | deleterious(0) | probably_damaging(1) | TCGA-G4-6588-01 | Colorectum | colon adenocarcinoma | Female | <65 | I/II | Unknown | Unknown | SD |
| CARS2 | deletion | Frame_Shift_Del | c.1011delN | p.Asp338MetfsTer44 | p.D338Mfs*44 | Q9HA77 | protein_coding | TCGA-CM-6171-01 | Colorectum | colon adenocarcinoma | Female | >=65 | I/II | Unknown | Unknown | SD | |||
| CARS2 | SNV | Missense_Mutation | novel | c.1669N>G | p.Thr557Ala | p.T557A | Q9HA77 | protein_coding | tolerated(0.28) | benign(0) | TCGA-A5-A0G2-01 | Endometrium | uterine corpus endometrioid carcinoma | Female | <65 | III/IV | Unknown | Unknown | SD |
| CARS2 | SNV | Missense_Mutation | c.1400C>T | p.Ser467Phe | p.S467F | Q9HA77 | protein_coding | deleterious(0) | possibly_damaging(0.762) | TCGA-A5-A1OF-01 | Endometrium | uterine corpus endometrioid carcinoma | Female | <65 | I/II | Unknown | Unknown | SD |
| Page: 1 2 3 4 |
Top |
Related drugs of malignant transformation related genes |
| Identification of chemicals and drugs interact with genes involved in malignant transfromation |
| (DGIdb 4.0) |
| Entrez ID | Symbol | Category | Interaction Types | Drug Claim Name | Drug Name | PMIDs |
| Page: 1 |

Copyright 2023-Present -The University of Texas Health Science Center at Houston |