
|
|||||
|
 | |
| |
| |
| |
| |
| |
|
Gene: CARS |
Gene summary for CARS |
| Gene information | Species | Human | Gene symbol | CARS | Gene ID | 833 |
| Gene name | cysteinyl-tRNA synthetase 1 | |
| Gene Alias | CARS | |
| Cytomap | 11p15.4 | |
| Gene Type | protein-coding | GO ID | GO:0006082 | UniProtAcc | P49589 |
Top |
Malignant transformation analysis |
| Identification of the aberrant gene expression in precancerous and cancerous lesions by comparing the gene expression of stem-like cells in diseased tissues with normal stem cells |
| Entrez ID | Symbol | Replicates | Species | Organ | Tissue | Adj P-value | Log2FC | Malignancy |
| 833 | CARS | LZE4T | Human | Esophagus | ESCC | 2.83e-10 | 2.14e-01 | 0.0811 |
| 833 | CARS | LZE5T | Human | Esophagus | ESCC | 6.45e-03 | 2.42e-01 | 0.0514 |
| 833 | CARS | LZE7T | Human | Esophagus | ESCC | 1.91e-03 | 1.90e-01 | 0.0667 |
| 833 | CARS | LZE8T | Human | Esophagus | ESCC | 2.39e-05 | 1.82e-01 | 0.067 |
| 833 | CARS | LZE20T | Human | Esophagus | ESCC | 2.93e-04 | 1.25e-01 | 0.0662 |
| 833 | CARS | LZE24T | Human | Esophagus | ESCC | 8.29e-18 | 4.89e-01 | 0.0596 |
| 833 | CARS | LZE21T | Human | Esophagus | ESCC | 5.73e-03 | 1.60e-01 | 0.0655 |
| 833 | CARS | LZE6T | Human | Esophagus | ESCC | 1.85e-04 | 1.87e-01 | 0.0845 |
| 833 | CARS | P1T-E | Human | Esophagus | ESCC | 8.83e-09 | 4.01e-01 | 0.0875 |
| 833 | CARS | P2T-E | Human | Esophagus | ESCC | 1.92e-51 | 1.27e+00 | 0.1177 |
| 833 | CARS | P4T-E | Human | Esophagus | ESCC | 5.76e-16 | 4.09e-01 | 0.1323 |
| 833 | CARS | P5T-E | Human | Esophagus | ESCC | 1.30e-11 | 2.00e-01 | 0.1327 |
| 833 | CARS | P8T-E | Human | Esophagus | ESCC | 1.59e-14 | 2.33e-01 | 0.0889 |
| 833 | CARS | P9T-E | Human | Esophagus | ESCC | 1.98e-11 | 2.09e-01 | 0.1131 |
| 833 | CARS | P10T-E | Human | Esophagus | ESCC | 1.99e-21 | 4.64e-01 | 0.116 |
| 833 | CARS | P11T-E | Human | Esophagus | ESCC | 1.28e-15 | 6.43e-01 | 0.1426 |
| 833 | CARS | P12T-E | Human | Esophagus | ESCC | 4.42e-17 | 3.99e-01 | 0.1122 |
| 833 | CARS | P15T-E | Human | Esophagus | ESCC | 1.47e-13 | 3.21e-01 | 0.1149 |
| 833 | CARS | P16T-E | Human | Esophagus | ESCC | 2.69e-46 | 9.92e-01 | 0.1153 |
| 833 | CARS | P17T-E | Human | Esophagus | ESCC | 8.81e-10 | 5.03e-01 | 0.1278 |
| Page: 1 2 3 4 5 6 7 |
| Tissue | Expression Dynamics | Abbreviation |
| Esophagus |  | ESCC: Esophageal squamous cell carcinoma |
| HGIN: High-grade intraepithelial neoplasias | ||
| LGIN: Low-grade intraepithelial neoplasias | ||
| Liver |  | HCC: Hepatocellular carcinoma |
| NAFLD: Non-alcoholic fatty liver disease | ||
| Oral Cavity | 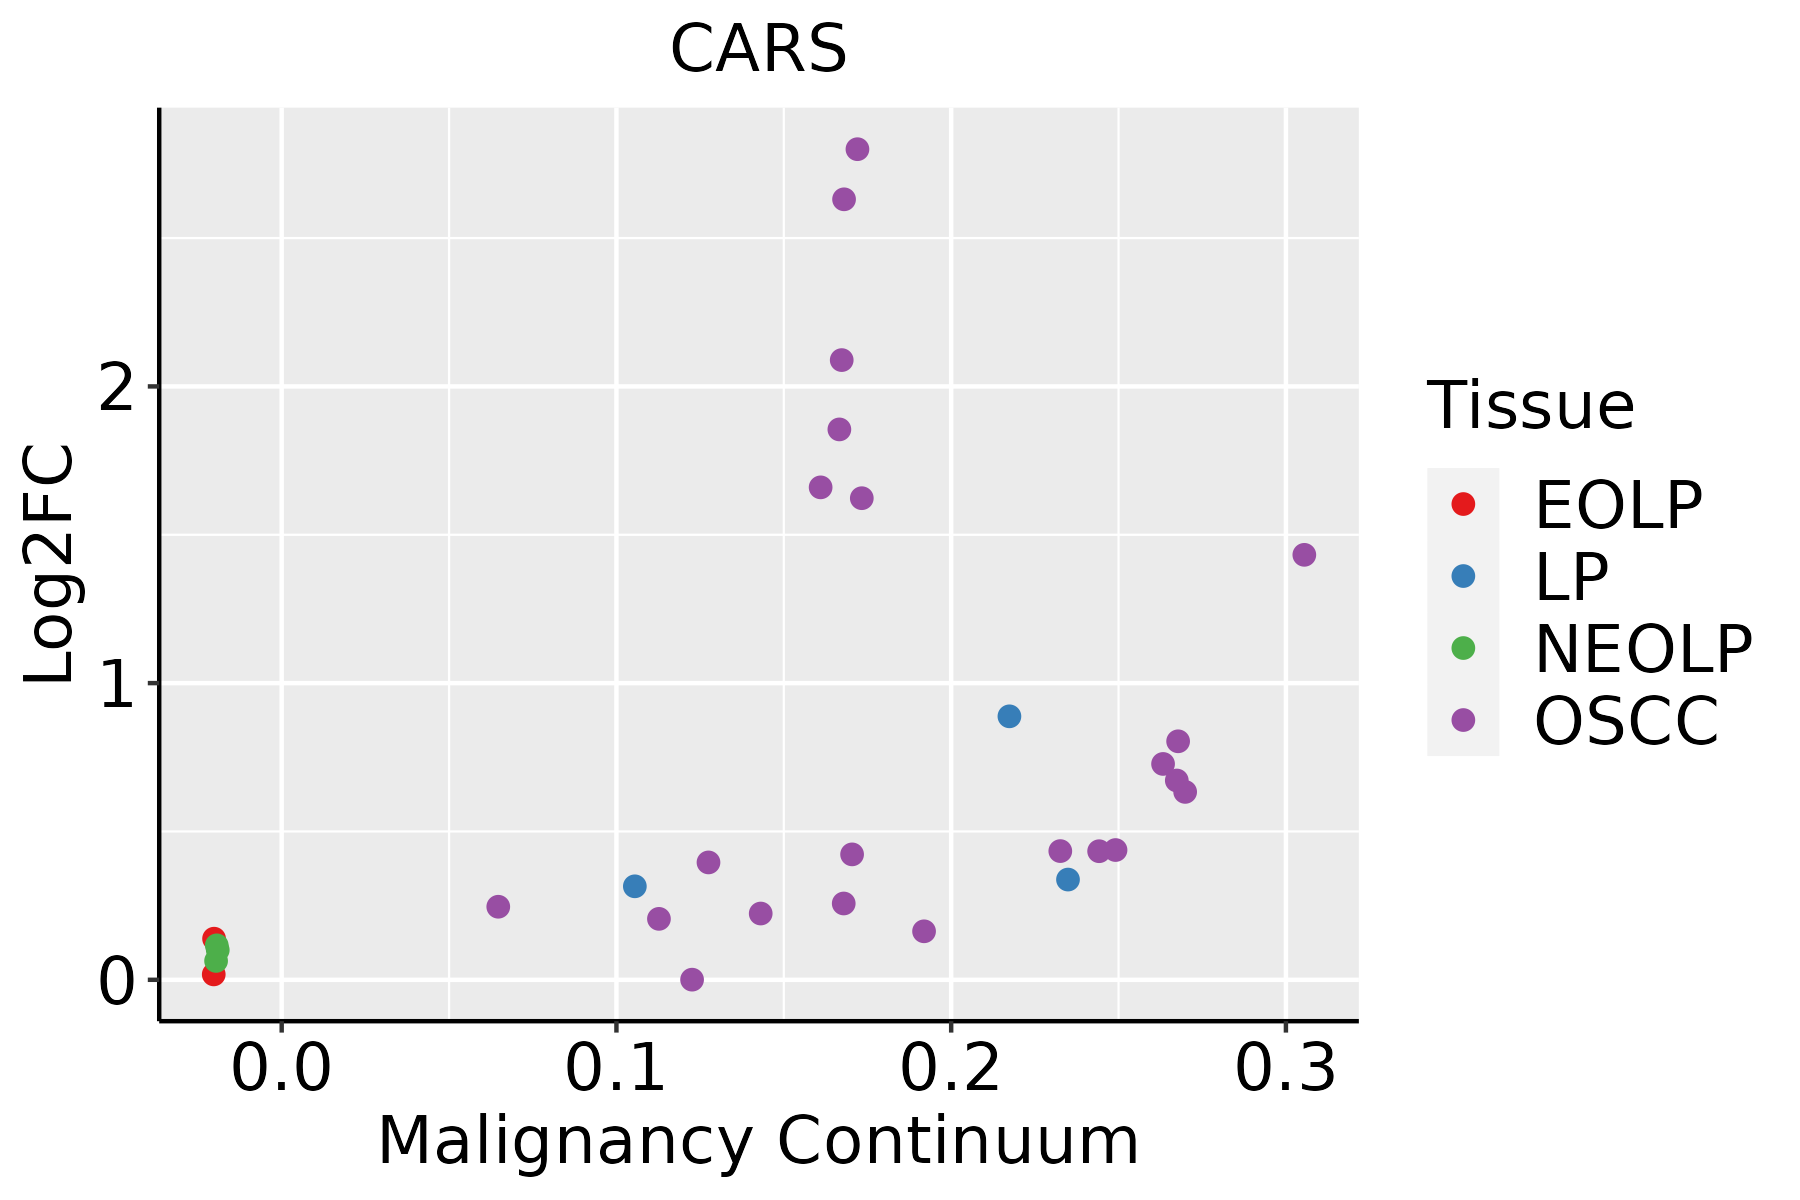 | EOLP: Erosive Oral lichen planus |
| LP: leukoplakia | ||
| NEOLP: Non-erosive oral lichen planus | ||
| OSCC: Oral squamous cell carcinoma | ||
| Prostate | 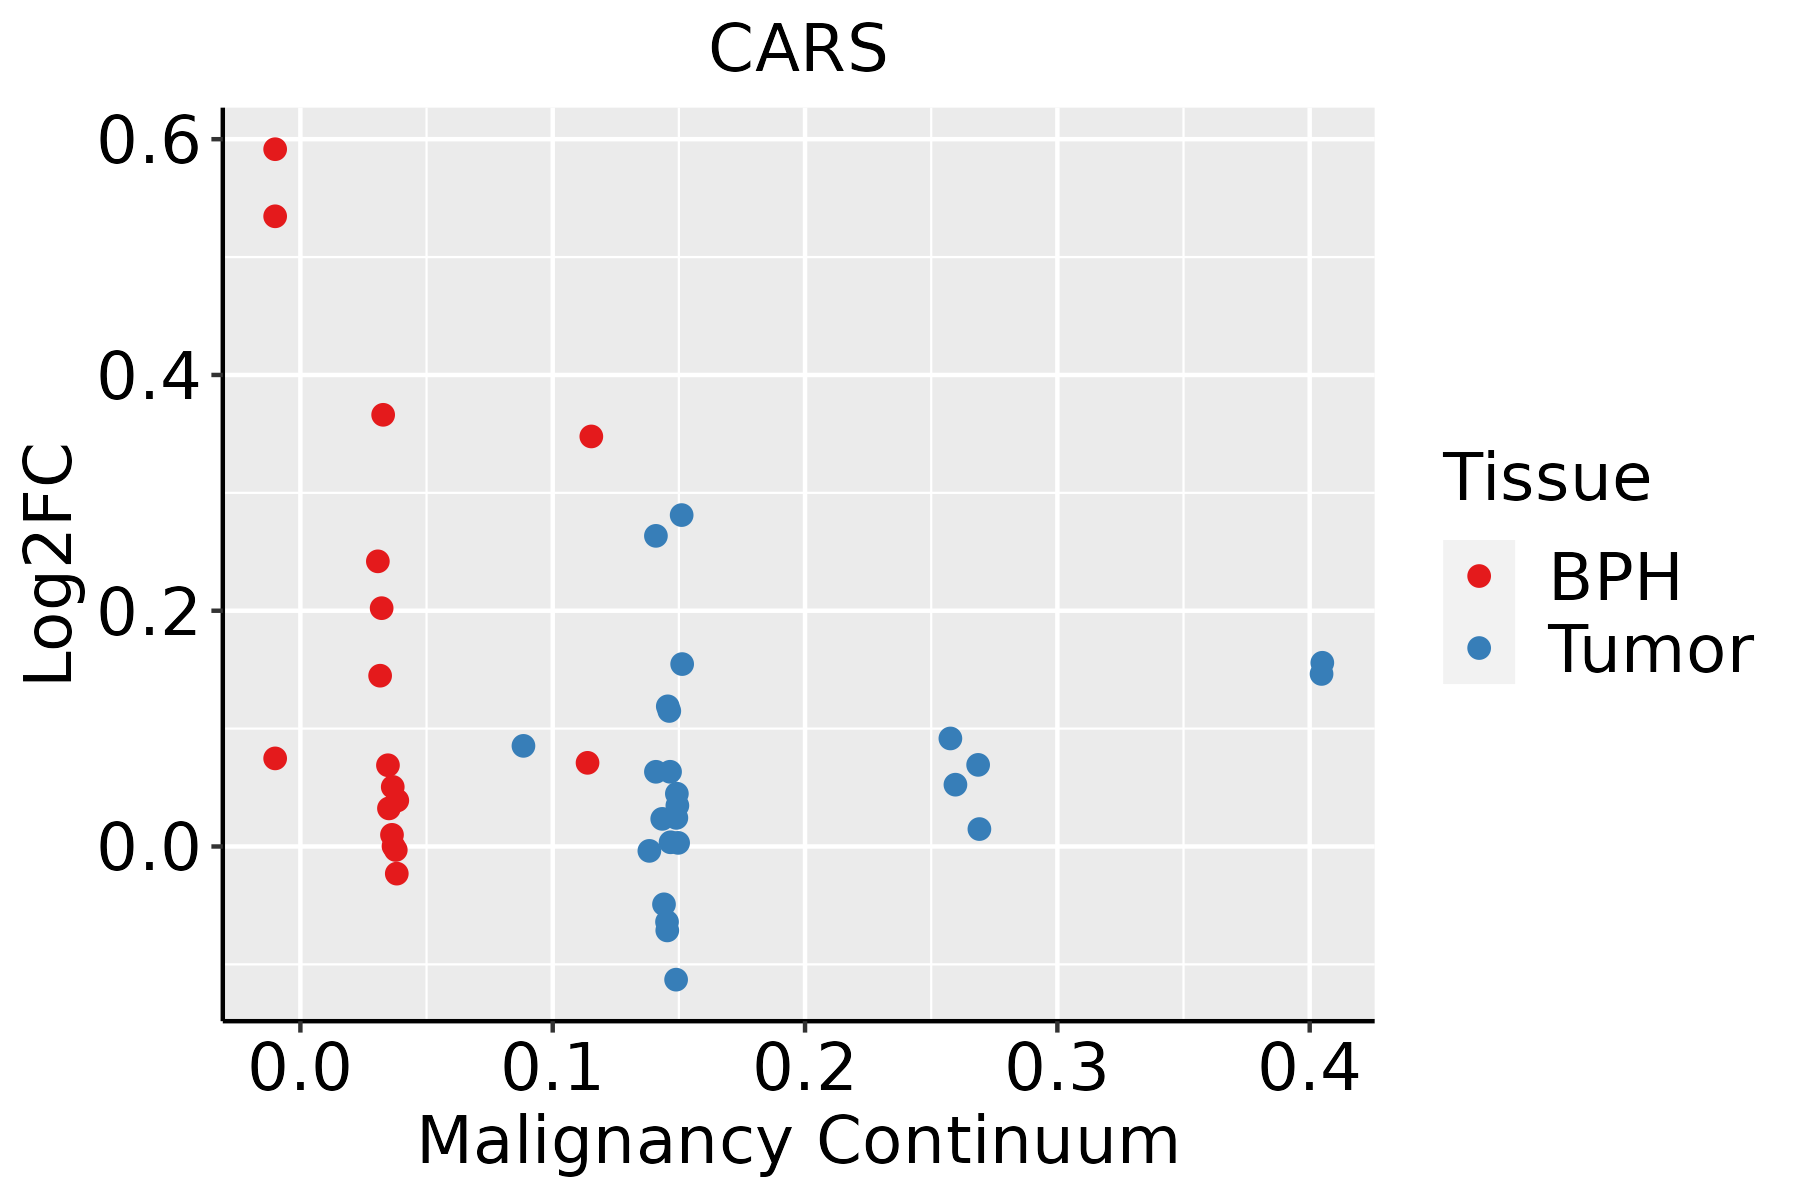 | BPH: Benign Prostatic Hyperplasia |
| Skin | 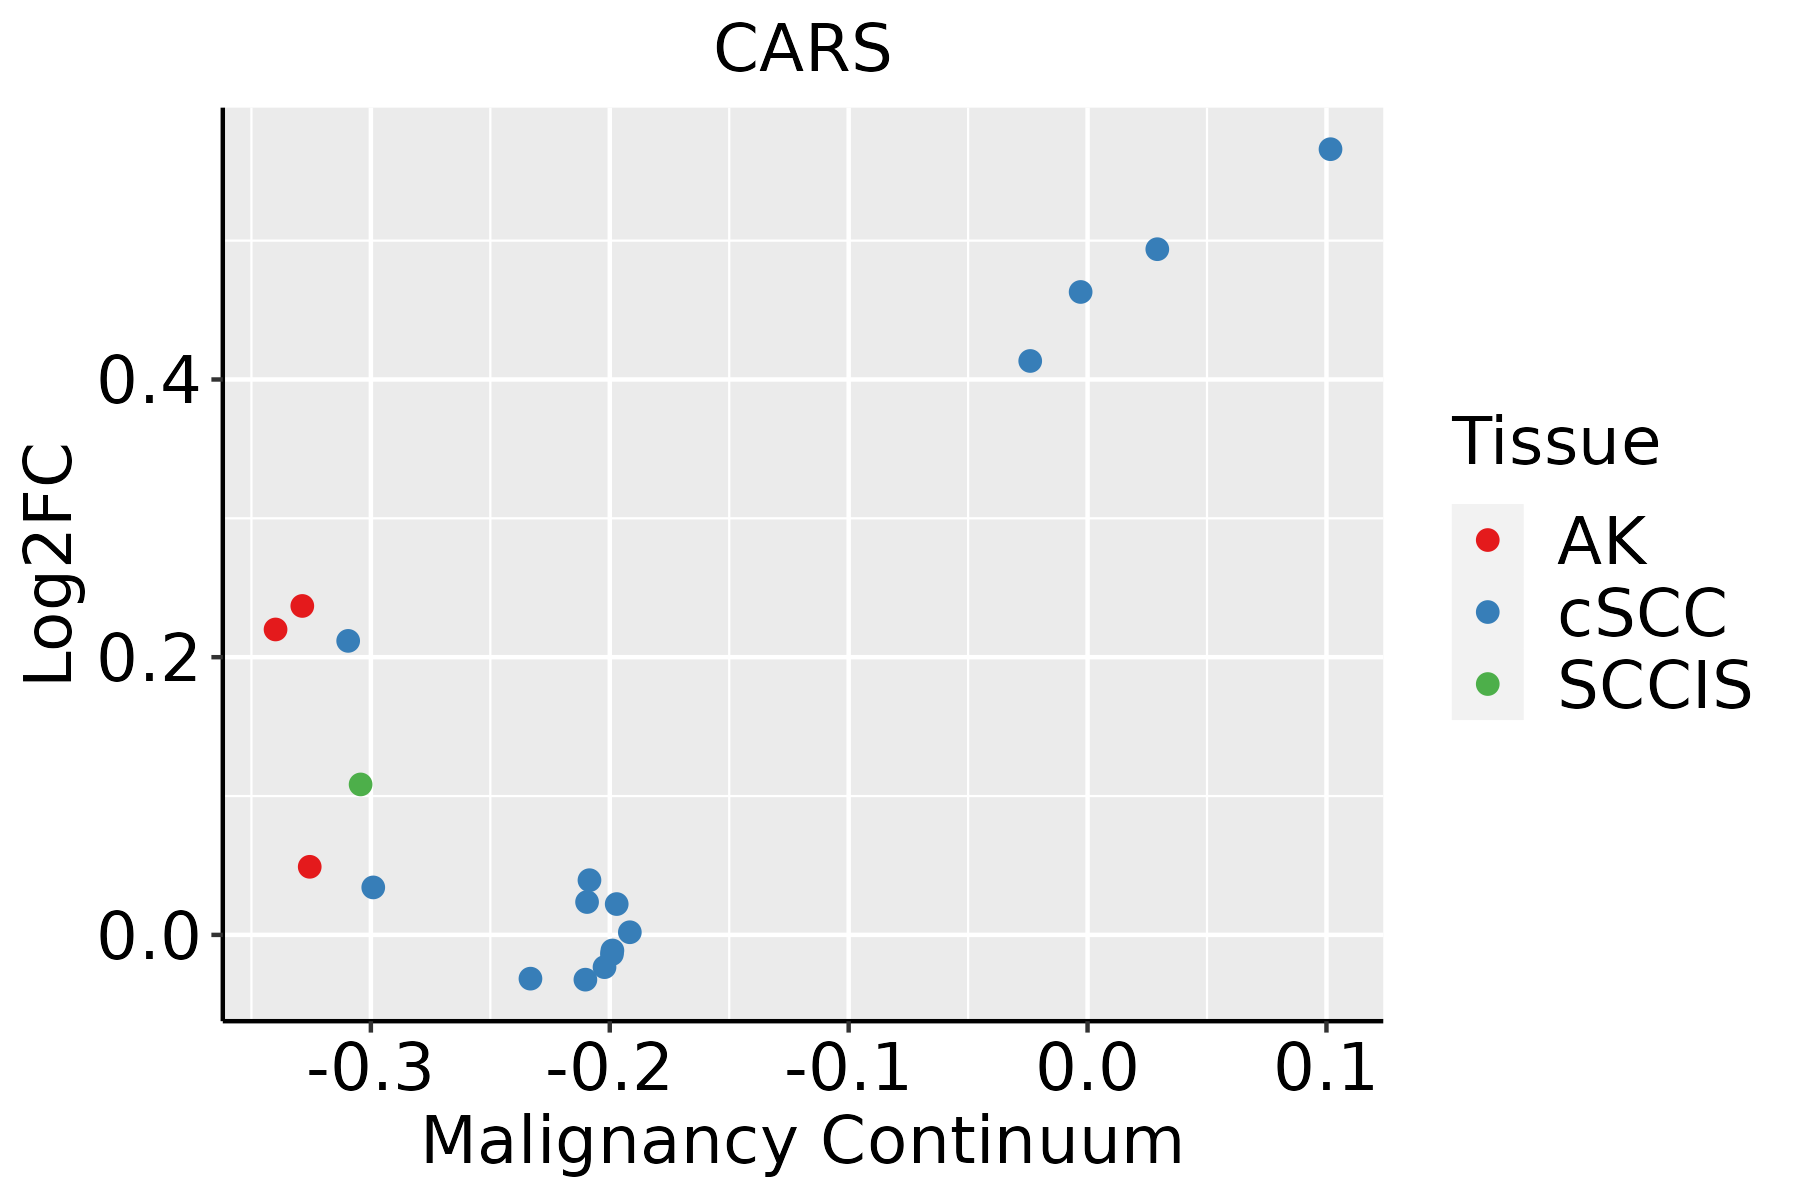 | AK: Actinic keratosis |
| cSCC: Cutaneous squamous cell carcinoma | ||
| SCCIS:squamous cell carcinoma in situ | ||
| Thyroid |  | ATC: Anaplastic thyroid cancer |
| HT: Hashimoto's thyroiditis | ||
| PTC: Papillary thyroid cancer |
| ∗log2FC in expression of this searched gene in stem-like cells from each diseased tissue sample relative to stem-like cells in normal samples in each tissue plotted against the malignancy continuum. Samples are colored based on if they are from different disease stage. |
Top |
Malignant transformation related pathway analysis |
| Find out the enriched GO biological processes and KEGG pathways involved in transition from healthy to precancer to cancer |
| Tissue | Disease Stage | Enriched GO biological Processes |
| Colorectum | AD |  |
| Colorectum | SER |  |
| Colorectum | MSS |  |
| Colorectum | MSI-H |  |
| Colorectum | FAP |  |
| ∗Top 15 enriched GO BP terms are showed in the bar plot of each disease state in each tissue. Each row represents a significant GO biological process which is colored according to the -log10(p.adjust). |
| Page: 1 2 3 4 5 6 7 8 9 |
| GO ID | Tissue | Disease Stage | Description | Gene Ratio | Bg Ratio | pvalue | p.adjust | Count |
| GO:0006418 | Colorectum | AD | tRNA aminoacylation for protein translation | 19/3918 | 41/18723 | 2.37e-04 | 3.03e-03 | 19 |
| GO:0043039 | Colorectum | AD | tRNA aminoacylation | 19/3918 | 44/18723 | 7.13e-04 | 7.21e-03 | 19 |
| GO:0043038 | Colorectum | AD | amino acid activation | 19/3918 | 45/18723 | 9.94e-04 | 9.28e-03 | 19 |
| GO:0006520 | Colorectum | AD | cellular amino acid metabolic process | 81/3918 | 284/18723 | 1.37e-03 | 1.19e-02 | 81 |
| GO:00064181 | Colorectum | SER | tRNA aminoacylation for protein translation | 17/2897 | 41/18723 | 5.75e-05 | 1.35e-03 | 17 |
| GO:00430391 | Colorectum | SER | tRNA aminoacylation | 17/2897 | 44/18723 | 1.64e-04 | 3.12e-03 | 17 |
| GO:00430381 | Colorectum | SER | amino acid activation | 17/2897 | 45/18723 | 2.25e-04 | 3.91e-03 | 17 |
| GO:00065201 | Colorectum | SER | cellular amino acid metabolic process | 61/2897 | 284/18723 | 4.20e-03 | 3.41e-02 | 61 |
| GO:003466012 | Esophagus | ESCC | ncRNA metabolic process | 346/8552 | 485/18723 | 4.35e-31 | 2.51e-28 | 346 |
| GO:00063992 | Esophagus | ESCC | tRNA metabolic process | 122/8552 | 179/18723 | 9.03e-10 | 2.19e-08 | 122 |
| GO:00346605 | Oral cavity | OSCC | ncRNA metabolic process | 296/7305 | 485/18723 | 2.94e-23 | 6.65e-21 | 296 |
| GO:00063991 | Oral cavity | OSCC | tRNA metabolic process | 101/7305 | 179/18723 | 1.65e-06 | 2.15e-05 | 101 |
| GO:00346607 | Skin | AK | ncRNA metabolic process | 75/1910 | 485/18723 | 1.64e-04 | 1.93e-03 | 75 |
| GO:003466013 | Skin | cSCC | ncRNA metabolic process | 234/4864 | 485/18723 | 1.37e-26 | 4.77e-24 | 234 |
| GO:00063993 | Skin | cSCC | tRNA metabolic process | 64/4864 | 179/18723 | 2.34e-03 | 1.36e-02 | 64 |
| GO:00346608 | Thyroid | PTC | ncRNA metabolic process | 239/5968 | 485/18723 | 5.54e-16 | 4.26e-14 | 239 |
| GO:003466021 | Thyroid | ATC | ncRNA metabolic process | 240/6293 | 485/18723 | 2.03e-13 | 9.91e-12 | 240 |
| Page: 1 |
| Pathway ID | Tissue | Disease Stage | Description | Gene Ratio | Bg Ratio | pvalue | p.adjust | qvalue | Count |
| Page: 1 |
Top |
Cell-cell communication analysis |
| Identification of potential cell-cell interactions between two cell types and their ligand-receptor pairs for different disease states |
| Ligand | Receptor | LRpair | Pathway | Tissue | Disease Stage |
| Page: 1 |
Top |
Single-cell gene regulatory network inference analysis |
| Find out the significant the regulons (TFs) and the target genes of each regulon across cell types for different disease states |
| TF | Cell Type | Tissue | Disease Stage | Target Gene | RSS | Regulon Activity |
| ∗The dot plots of a searched regulon are shown for all cell subpopulations in each disease state of each tissue based on the regulon specific score inferred using pySCENIC and by calculating the average expression. |
| Page: 1 |
Top |
Somatic mutation of malignant transformation related genes |
| Annotation of somatic variants for genes involved in malignant transformation |
| Hugo Symbol | Variant Class | Variant Classification | dbSNP RS | HGVSc | HGVSp | HGVSp Short | SWISSPROT | BIOTYPE | SIFT | PolyPhen | Tumor Sample Barcode | Tissue | Histology | Sex | Age | Stage | Therapy Types | Drugs | Outcome |
| CARS | SNV | Missense_Mutation | c.2197G>C | p.Glu733Gln | p.E733Q | P49589 | protein_coding | tolerated(0.06) | benign(0.248) | TCGA-A2-A25A-01 | Breast | breast invasive carcinoma | Female | <65 | I/II | Unspecific | Cytoxan | SD | |
| CARS | SNV | Missense_Mutation | c.1973G>A | p.Gly658Glu | p.G658E | P49589 | protein_coding | tolerated(0.15) | benign(0.001) | TCGA-AC-A23H-01 | Breast | breast invasive carcinoma | Female | >=65 | I/II | Unknown | Unknown | PD | |
| CARS | SNV | Missense_Mutation | c.2275N>A | p.Glu759Lys | p.E759K | P49589 | protein_coding | tolerated(0.21) | benign(0.05) | TCGA-BH-A0AW-01 | Breast | breast invasive carcinoma | Female | <65 | I/II | Chemotherapy | carboplatin | SD | |
| CARS | SNV | Missense_Mutation | c.2333N>T | p.Thr778Ile | p.T778I | P49589 | protein_coding | tolerated(0.07) | benign(0.025) | TCGA-BH-A18G-01 | Breast | breast invasive carcinoma | Female | >=65 | I/II | Unknown | Unknown | SD | |
| CARS | SNV | Missense_Mutation | rs753665807 | c.202N>T | p.Arg68Trp | p.R68W | P49589 | protein_coding | deleterious_low_confidence(0) | possibly_damaging(0.549) | TCGA-D8-A27G-01 | Breast | breast invasive carcinoma | Female | >=65 | I/II | Unknown | Unknown | SD |
| CARS | insertion | Frame_Shift_Ins | novel | c.1868_1869insAGTCAGCCTGCCTTTGAACTGCAGTG | p.Asn623LysfsTer25 | p.N623Kfs*25 | P49589 | protein_coding | TCGA-BH-A0BJ-01 | Breast | breast invasive carcinoma | Female | <65 | I/II | Chemotherapy | doxorubicin | SD | ||
| CARS | SNV | Missense_Mutation | novel | c.2248N>C | p.Glu750Gln | p.E750Q | P49589 | protein_coding | tolerated(0.08) | benign(0.027) | TCGA-C5-A2LZ-01 | Cervix | cervical & endocervical cancer | Female | >=65 | III/IV | Unknown | Unknown | PD |
| CARS | SNV | Missense_Mutation | rs200664585 | c.401N>T | p.Thr134Met | p.T134M | P49589 | protein_coding | deleterious(0.05) | benign(0.15) | TCGA-VS-A9U6-01 | Cervix | cervical & endocervical cancer | Female | <65 | I/II | Chemotherapy | cisplatin | PD |
| CARS | SNV | Missense_Mutation | rs373718331 | c.424G>A | p.Val142Ile | p.V142I | P49589 | protein_coding | deleterious(0) | probably_damaging(0.996) | TCGA-A6-6781-01 | Colorectum | colon adenocarcinoma | Male | <65 | III/IV | Chemotherapy | oxaliplatin | SD |
| CARS | SNV | Missense_Mutation | rs757237908 | c.284N>A | p.Arg95Gln | p.R95Q | P49589 | protein_coding | deleterious(0.04) | benign(0.047) | TCGA-AA-3511-01 | Colorectum | colon adenocarcinoma | Male | <65 | I/II | Unknown | Unknown | PD |
| Page: 1 2 3 4 5 6 7 8 |
Top |
Related drugs of malignant transformation related genes |
| Identification of chemicals and drugs interact with genes involved in malignant transfromation |
| (DGIdb 4.0) |
| Entrez ID | Symbol | Category | Interaction Types | Drug Claim Name | Drug Name | PMIDs |
| Page: 1 |

Copyright 2023-Present -The University of Texas Health Science Center at Houston |