
|
|||||
|
 | |
| |
| |
| |
| |
| |
|
Gene: CARD19 |
Gene summary for CARD19 |
| Gene information | Species | Human | Gene symbol | CARD19 | Gene ID | 84270 |
| Gene name | caspase recruitment domain family member 19 | |
| Gene Alias | BinCARD | |
| Cytomap | 9q22.31 | |
| Gene Type | protein-coding | GO ID | GO:0007154 | UniProtAcc | A0A024R248 |
Top |
Malignant transformation analysis |
| Identification of the aberrant gene expression in precancerous and cancerous lesions by comparing the gene expression of stem-like cells in diseased tissues with normal stem cells |
| Entrez ID | Symbol | Replicates | Species | Organ | Tissue | Adj P-value | Log2FC | Malignancy |
| 84270 | CARD19 | LZE4T | Human | Esophagus | ESCC | 8.03e-06 | 1.47e-01 | 0.0811 |
| 84270 | CARD19 | LZE7T | Human | Esophagus | ESCC | 1.25e-04 | 1.55e-01 | 0.0667 |
| 84270 | CARD19 | LZE8T | Human | Esophagus | ESCC | 8.58e-06 | 1.06e-01 | 0.067 |
| 84270 | CARD19 | LZE24T | Human | Esophagus | ESCC | 2.28e-09 | 3.97e-01 | 0.0596 |
| 84270 | CARD19 | LZE6T | Human | Esophagus | ESCC | 2.45e-02 | 3.49e-01 | 0.0845 |
| 84270 | CARD19 | P2T-E | Human | Esophagus | ESCC | 4.54e-23 | 5.36e-01 | 0.1177 |
| 84270 | CARD19 | P4T-E | Human | Esophagus | ESCC | 6.70e-12 | 2.91e-01 | 0.1323 |
| 84270 | CARD19 | P5T-E | Human | Esophagus | ESCC | 3.35e-18 | 4.06e-01 | 0.1327 |
| 84270 | CARD19 | P8T-E | Human | Esophagus | ESCC | 4.51e-18 | 4.15e-01 | 0.0889 |
| 84270 | CARD19 | P9T-E | Human | Esophagus | ESCC | 2.92e-24 | 6.95e-01 | 0.1131 |
| 84270 | CARD19 | P10T-E | Human | Esophagus | ESCC | 2.37e-20 | 2.66e-01 | 0.116 |
| 84270 | CARD19 | P11T-E | Human | Esophagus | ESCC | 4.48e-16 | 8.62e-01 | 0.1426 |
| 84270 | CARD19 | P12T-E | Human | Esophagus | ESCC | 1.63e-16 | 2.82e-01 | 0.1122 |
| 84270 | CARD19 | P15T-E | Human | Esophagus | ESCC | 5.81e-22 | 3.01e-01 | 0.1149 |
| 84270 | CARD19 | P16T-E | Human | Esophagus | ESCC | 5.56e-19 | 2.09e-01 | 0.1153 |
| 84270 | CARD19 | P17T-E | Human | Esophagus | ESCC | 1.87e-08 | 6.01e-01 | 0.1278 |
| 84270 | CARD19 | P19T-E | Human | Esophagus | ESCC | 4.68e-10 | 8.01e-01 | 0.1662 |
| 84270 | CARD19 | P20T-E | Human | Esophagus | ESCC | 2.35e-12 | 3.38e-01 | 0.1124 |
| 84270 | CARD19 | P21T-E | Human | Esophagus | ESCC | 1.45e-54 | 1.17e+00 | 0.1617 |
| 84270 | CARD19 | P22T-E | Human | Esophagus | ESCC | 2.84e-20 | 3.21e-01 | 0.1236 |
| Page: 1 2 3 4 5 6 |
| Tissue | Expression Dynamics | Abbreviation |
| Esophagus | 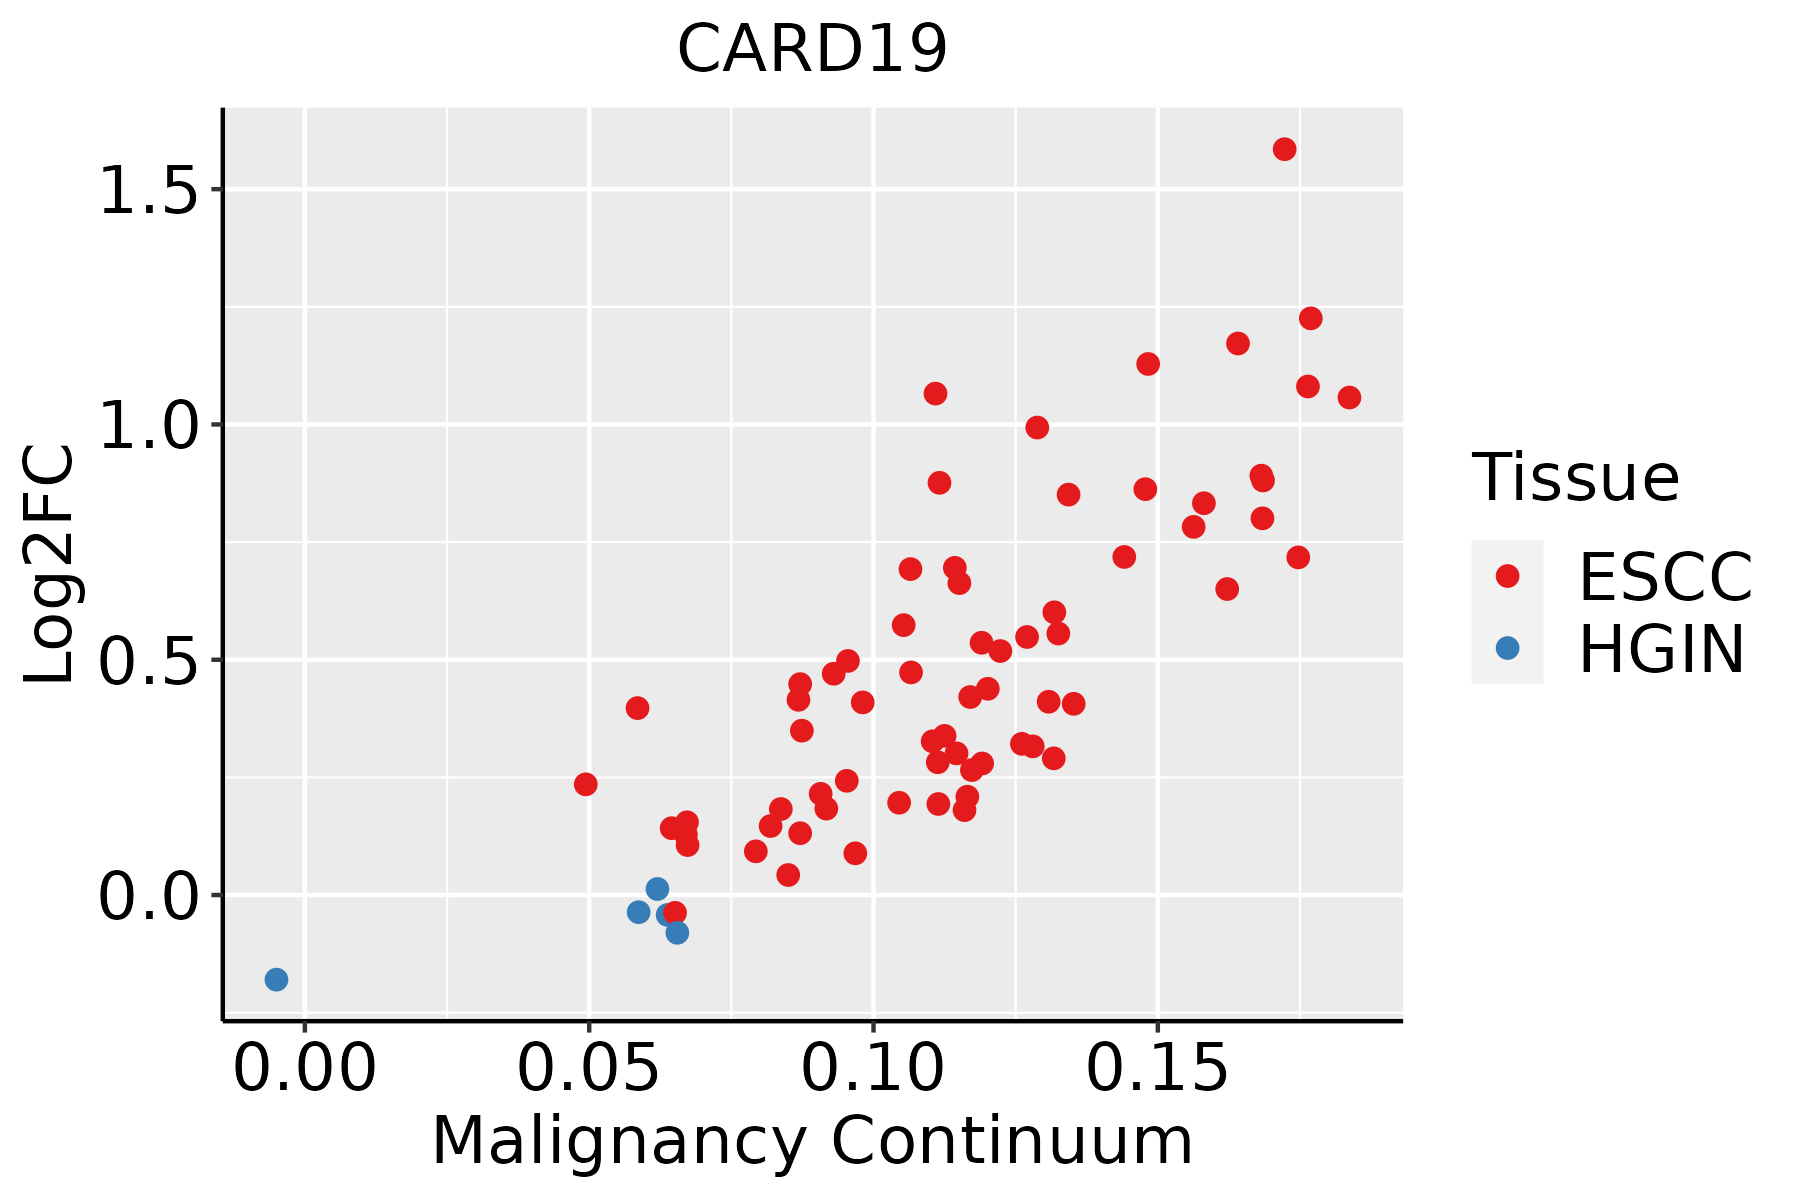 | ESCC: Esophageal squamous cell carcinoma |
| HGIN: High-grade intraepithelial neoplasias | ||
| LGIN: Low-grade intraepithelial neoplasias | ||
| Liver | 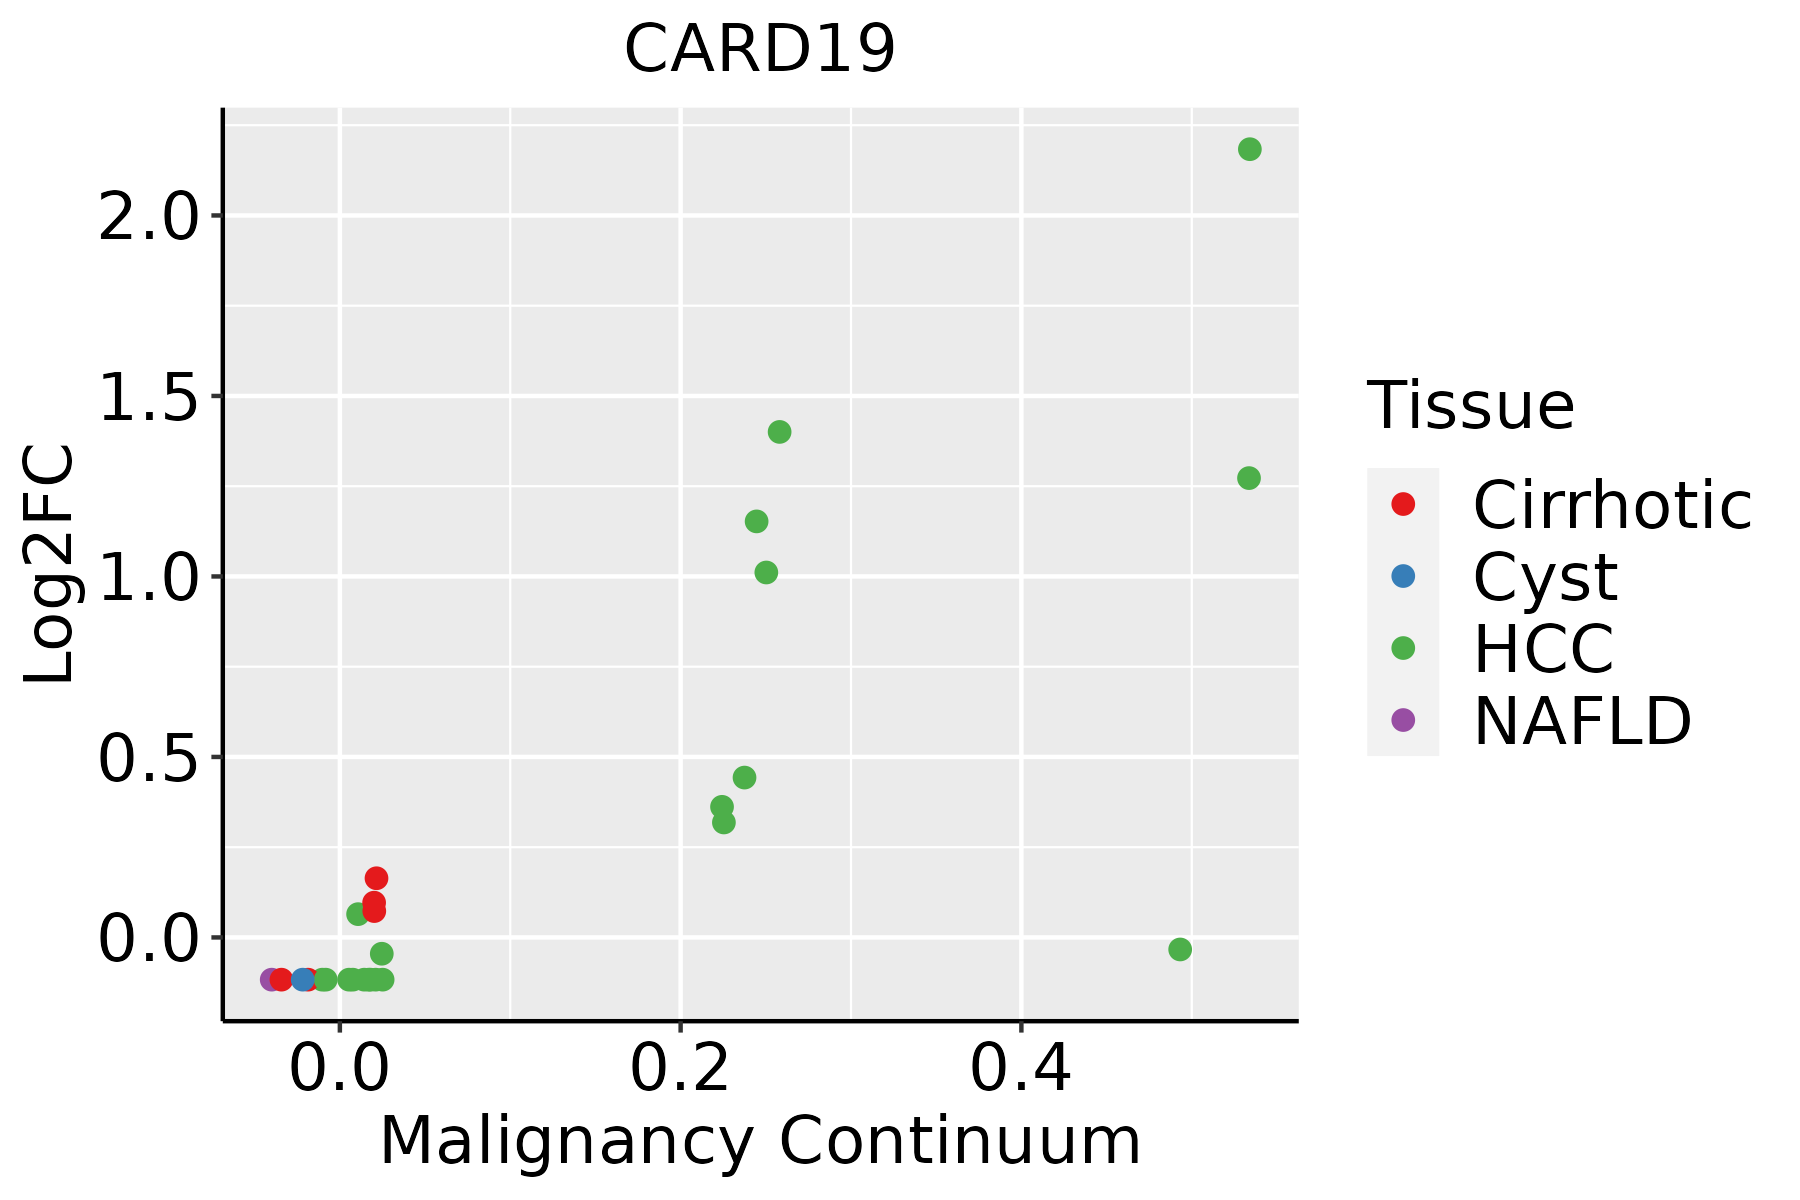 | HCC: Hepatocellular carcinoma |
| NAFLD: Non-alcoholic fatty liver disease | ||
| Oral Cavity |  | EOLP: Erosive Oral lichen planus |
| LP: leukoplakia | ||
| NEOLP: Non-erosive oral lichen planus | ||
| OSCC: Oral squamous cell carcinoma | ||
| Thyroid |  | ATC: Anaplastic thyroid cancer |
| HT: Hashimoto's thyroiditis | ||
| PTC: Papillary thyroid cancer |
| ∗log2FC in expression of this searched gene in stem-like cells from each diseased tissue sample relative to stem-like cells in normal samples in each tissue plotted against the malignancy continuum. Samples are colored based on if they are from different disease stage. |
Top |
Malignant transformation related pathway analysis |
| Find out the enriched GO biological processes and KEGG pathways involved in transition from healthy to precancer to cancer |
| Tissue | Disease Stage | Enriched GO biological Processes |
| Colorectum | AD |  |
| Colorectum | SER |  |
| Colorectum | MSS |  |
| Colorectum | MSI-H |  |
| Colorectum | FAP |  |
| ∗Top 15 enriched GO BP terms are showed in the bar plot of each disease state in each tissue. Each row represents a significant GO biological process which is colored according to the -log10(p.adjust). |
| Page: 1 2 3 4 5 6 7 8 9 |
| GO ID | Tissue | Disease Stage | Description | Gene Ratio | Bg Ratio | pvalue | p.adjust | Count |
| GO:0043122110 | Esophagus | ESCC | regulation of I-kappaB kinase/NF-kappaB signaling | 167/8552 | 249/18723 | 6.11e-12 | 2.32e-10 | 167 |
| GO:000724919 | Esophagus | ESCC | I-kappaB kinase/NF-kappaB signaling | 183/8552 | 281/18723 | 3.02e-11 | 1.01e-09 | 183 |
| GO:00072494 | Liver | Cirrhotic | I-kappaB kinase/NF-kappaB signaling | 108/4634 | 281/18723 | 2.21e-07 | 5.64e-06 | 108 |
| GO:00431225 | Liver | Cirrhotic | regulation of I-kappaB kinase/NF-kappaB signaling | 95/4634 | 249/18723 | 1.68e-06 | 3.22e-05 | 95 |
| GO:0043124 | Liver | Cirrhotic | negative regulation of I-kappaB kinase/NF-kappaB signaling | 21/4634 | 51/18723 | 7.18e-03 | 3.44e-02 | 21 |
| GO:000724912 | Liver | HCC | I-kappaB kinase/NF-kappaB signaling | 156/7958 | 281/18723 | 6.66e-06 | 8.00e-05 | 156 |
| GO:004312212 | Liver | HCC | regulation of I-kappaB kinase/NF-kappaB signaling | 138/7958 | 249/18723 | 2.47e-05 | 2.58e-04 | 138 |
| GO:004312218 | Oral cavity | OSCC | regulation of I-kappaB kinase/NF-kappaB signaling | 155/7305 | 249/18723 | 7.79e-14 | 4.14e-12 | 155 |
| GO:000724910 | Oral cavity | OSCC | I-kappaB kinase/NF-kappaB signaling | 169/7305 | 281/18723 | 4.69e-13 | 2.25e-11 | 169 |
| GO:004312219 | Oral cavity | LP | regulation of I-kappaB kinase/NF-kappaB signaling | 103/4623 | 249/18723 | 4.48e-09 | 1.90e-07 | 103 |
| GO:000724917 | Oral cavity | LP | I-kappaB kinase/NF-kappaB signaling | 110/4623 | 281/18723 | 4.94e-08 | 1.70e-06 | 110 |
| GO:004312226 | Thyroid | PTC | regulation of I-kappaB kinase/NF-kappaB signaling | 118/5968 | 249/18723 | 2.04e-07 | 3.63e-06 | 118 |
| GO:000724926 | Thyroid | PTC | I-kappaB kinase/NF-kappaB signaling | 130/5968 | 281/18723 | 2.78e-07 | 4.80e-06 | 130 |
| GO:0043122112 | Thyroid | ATC | regulation of I-kappaB kinase/NF-kappaB signaling | 123/6293 | 249/18723 | 1.65e-07 | 2.64e-06 | 123 |
| GO:0007249111 | Thyroid | ATC | I-kappaB kinase/NF-kappaB signaling | 135/6293 | 281/18723 | 3.31e-07 | 4.91e-06 | 135 |
| Page: 1 |
| Pathway ID | Tissue | Disease Stage | Description | Gene Ratio | Bg Ratio | pvalue | p.adjust | qvalue | Count |
| Page: 1 |
Top |
Cell-cell communication analysis |
| Identification of potential cell-cell interactions between two cell types and their ligand-receptor pairs for different disease states |
| Ligand | Receptor | LRpair | Pathway | Tissue | Disease Stage |
| Page: 1 |
Top |
Single-cell gene regulatory network inference analysis |
| Find out the significant the regulons (TFs) and the target genes of each regulon across cell types for different disease states |
| TF | Cell Type | Tissue | Disease Stage | Target Gene | RSS | Regulon Activity |
| ∗The dot plots of a searched regulon are shown for all cell subpopulations in each disease state of each tissue based on the regulon specific score inferred using pySCENIC and by calculating the average expression. |
| Page: 1 |
Top |
Somatic mutation of malignant transformation related genes |
| Annotation of somatic variants for genes involved in malignant transformation |
| Hugo Symbol | Variant Class | Variant Classification | dbSNP RS | HGVSc | HGVSp | HGVSp Short | SWISSPROT | BIOTYPE | SIFT | PolyPhen | Tumor Sample Barcode | Tissue | Histology | Sex | Age | Stage | Therapy Types | Drugs | Outcome |
| CARD19 | SNV | Missense_Mutation | c.34N>G | p.Gln12Glu | p.Q12E | Q96LW7 | protein_coding | tolerated(0.19) | possibly_damaging(0.775) | TCGA-E2-A1L8-01 | Breast | breast invasive carcinoma | Female | <65 | I/II | Chemotherapy | cyclophosphamide | SD | |
| CARD19 | SNV | Missense_Mutation | rs752738422 | c.143N>T | p.Ala48Val | p.A48V | Q96LW7 | protein_coding | deleterious(0) | possibly_damaging(0.898) | TCGA-2W-A8YY-01 | Cervix | cervical & endocervical cancer | Female | <65 | I/II | Chemotherapy | cisplatin | CR |
| CARD19 | SNV | Missense_Mutation | novel | c.130N>G | p.Thr44Ala | p.T44A | Q96LW7 | protein_coding | tolerated(0.08) | benign(0.011) | TCGA-5M-AAT6-01 | Colorectum | colon adenocarcinoma | Female | <65 | III/IV | Unknown | Unknown | PD |
| CARD19 | SNV | Missense_Mutation | novel | c.158N>G | p.Asn53Ser | p.N53S | Q96LW7 | protein_coding | deleterious(0.03) | benign(0.028) | TCGA-A6-3809-01 | Colorectum | colon adenocarcinoma | Female | >=65 | I/II | Unknown | Unknown | SD |
| CARD19 | SNV | Missense_Mutation | rs201271055 | c.175N>T | p.Arg59Cys | p.R59C | Q96LW7 | protein_coding | tolerated(0.22) | benign(0.011) | TCGA-CM-6162-01 | Colorectum | colon adenocarcinoma | Female | <65 | III/IV | Chemotherapy | oxaliplatin | SD |
| CARD19 | SNV | Missense_Mutation | rs770324360 | c.211N>T | p.Arg71Trp | p.R71W | Q96LW7 | protein_coding | deleterious(0.01) | possibly_damaging(0.736) | TCGA-A5-A0G2-01 | Endometrium | uterine corpus endometrioid carcinoma | Female | <65 | III/IV | Unknown | Unknown | SD |
| CARD19 | SNV | Missense_Mutation | novel | c.313N>T | p.Asp105Tyr | p.D105Y | Q96LW7 | protein_coding | deleterious(0.01) | benign(0.424) | TCGA-AX-A3FT-01 | Endometrium | uterine corpus endometrioid carcinoma | Female | <65 | I/II | Unknown | Unknown | SD |
| CARD19 | SNV | Missense_Mutation | novel | c.418N>A | p.Leu140Met | p.L140M | Q96LW7 | protein_coding | tolerated(0.5) | benign(0.033) | TCGA-B5-A1MX-01 | Endometrium | uterine corpus endometrioid carcinoma | Female | <65 | I/II | Hormone Therapy | megace | SD |
| CARD19 | SNV | Missense_Mutation | rs185217097 | c.293N>A | p.Arg98His | p.R98H | Q96LW7 | protein_coding | deleterious(0) | probably_damaging(0.988) | TCGA-D1-A0ZR-01 | Endometrium | uterine corpus endometrioid carcinoma | Female | <65 | I/II | Unknown | Unknown | SD |
| CARD19 | deletion | Frame_Shift_Del | novel | c.146delN | p.Lys50SerfsTer17 | p.K50Sfs*17 | Q96LW7 | protein_coding | TCGA-AJ-A2QO-01 | Endometrium | uterine corpus endometrioid carcinoma | Female | >=65 | I/II | Unknown | Unknown | SD |
| Page: 1 2 |
Top |
Related drugs of malignant transformation related genes |
| Identification of chemicals and drugs interact with genes involved in malignant transfromation |
| (DGIdb 4.0) |
| Entrez ID | Symbol | Category | Interaction Types | Drug Claim Name | Drug Name | PMIDs |
| Page: 1 |

Copyright 2023-Present -The University of Texas Health Science Center at Houston |