
|
|||||
|
 | |
| |
| |
| |
| |
| |
|
Gene: CARD16 |
Gene summary for CARD16 |
| Gene information | Species | Human | Gene symbol | CARD16 | Gene ID | 114769 |
| Gene name | caspase recruitment domain family member 16 | |
| Gene Alias | COP | |
| Cytomap | 11q22.3 | |
| Gene Type | protein-coding | GO ID | GO:0001666 | UniProtAcc | Q5EG05 |
Top |
Malignant transformation analysis |
| Identification of the aberrant gene expression in precancerous and cancerous lesions by comparing the gene expression of stem-like cells in diseased tissues with normal stem cells |
| Entrez ID | Symbol | Replicates | Species | Organ | Tissue | Adj P-value | Log2FC | Malignancy |
| 114769 | CARD16 | LZE4T | Human | Esophagus | ESCC | 2.94e-11 | 6.03e-01 | 0.0811 |
| 114769 | CARD16 | LZE8T | Human | Esophagus | ESCC | 2.55e-05 | 3.67e-01 | 0.067 |
| 114769 | CARD16 | LZE22D1 | Human | Esophagus | HGIN | 6.83e-04 | 3.60e-01 | 0.0595 |
| 114769 | CARD16 | LZE22T | Human | Esophagus | ESCC | 8.19e-07 | 4.95e-01 | 0.068 |
| 114769 | CARD16 | LZE24T | Human | Esophagus | ESCC | 5.50e-10 | 2.48e-01 | 0.0596 |
| 114769 | CARD16 | LZE6T | Human | Esophagus | ESCC | 2.54e-10 | 6.39e-01 | 0.0845 |
| 114769 | CARD16 | P1T-E | Human | Esophagus | ESCC | 2.07e-02 | 2.52e-01 | 0.0875 |
| 114769 | CARD16 | P2T-E | Human | Esophagus | ESCC | 1.42e-12 | 1.65e-01 | 0.1177 |
| 114769 | CARD16 | P4T-E | Human | Esophagus | ESCC | 2.00e-23 | 6.86e-01 | 0.1323 |
| 114769 | CARD16 | P5T-E | Human | Esophagus | ESCC | 5.95e-10 | 1.75e-01 | 0.1327 |
| 114769 | CARD16 | P8T-E | Human | Esophagus | ESCC | 1.88e-42 | 9.22e-01 | 0.0889 |
| 114769 | CARD16 | P9T-E | Human | Esophagus | ESCC | 2.43e-16 | 4.74e-01 | 0.1131 |
| 114769 | CARD16 | P10T-E | Human | Esophagus | ESCC | 1.86e-08 | 2.52e-01 | 0.116 |
| 114769 | CARD16 | P11T-E | Human | Esophagus | ESCC | 1.98e-04 | 4.37e-01 | 0.1426 |
| 114769 | CARD16 | P12T-E | Human | Esophagus | ESCC | 7.97e-04 | -1.15e-02 | 0.1122 |
| 114769 | CARD16 | P15T-E | Human | Esophagus | ESCC | 8.05e-03 | 1.45e-01 | 0.1149 |
| 114769 | CARD16 | P16T-E | Human | Esophagus | ESCC | 1.07e-04 | -1.98e-02 | 0.1153 |
| 114769 | CARD16 | P17T-E | Human | Esophagus | ESCC | 1.67e-04 | 1.71e-01 | 0.1278 |
| 114769 | CARD16 | P20T-E | Human | Esophagus | ESCC | 1.90e-06 | 1.07e-01 | 0.1124 |
| 114769 | CARD16 | P21T-E | Human | Esophagus | ESCC | 7.53e-13 | 2.98e-01 | 0.1617 |
| Page: 1 2 3 4 |
| Tissue | Expression Dynamics | Abbreviation |
| Esophagus | 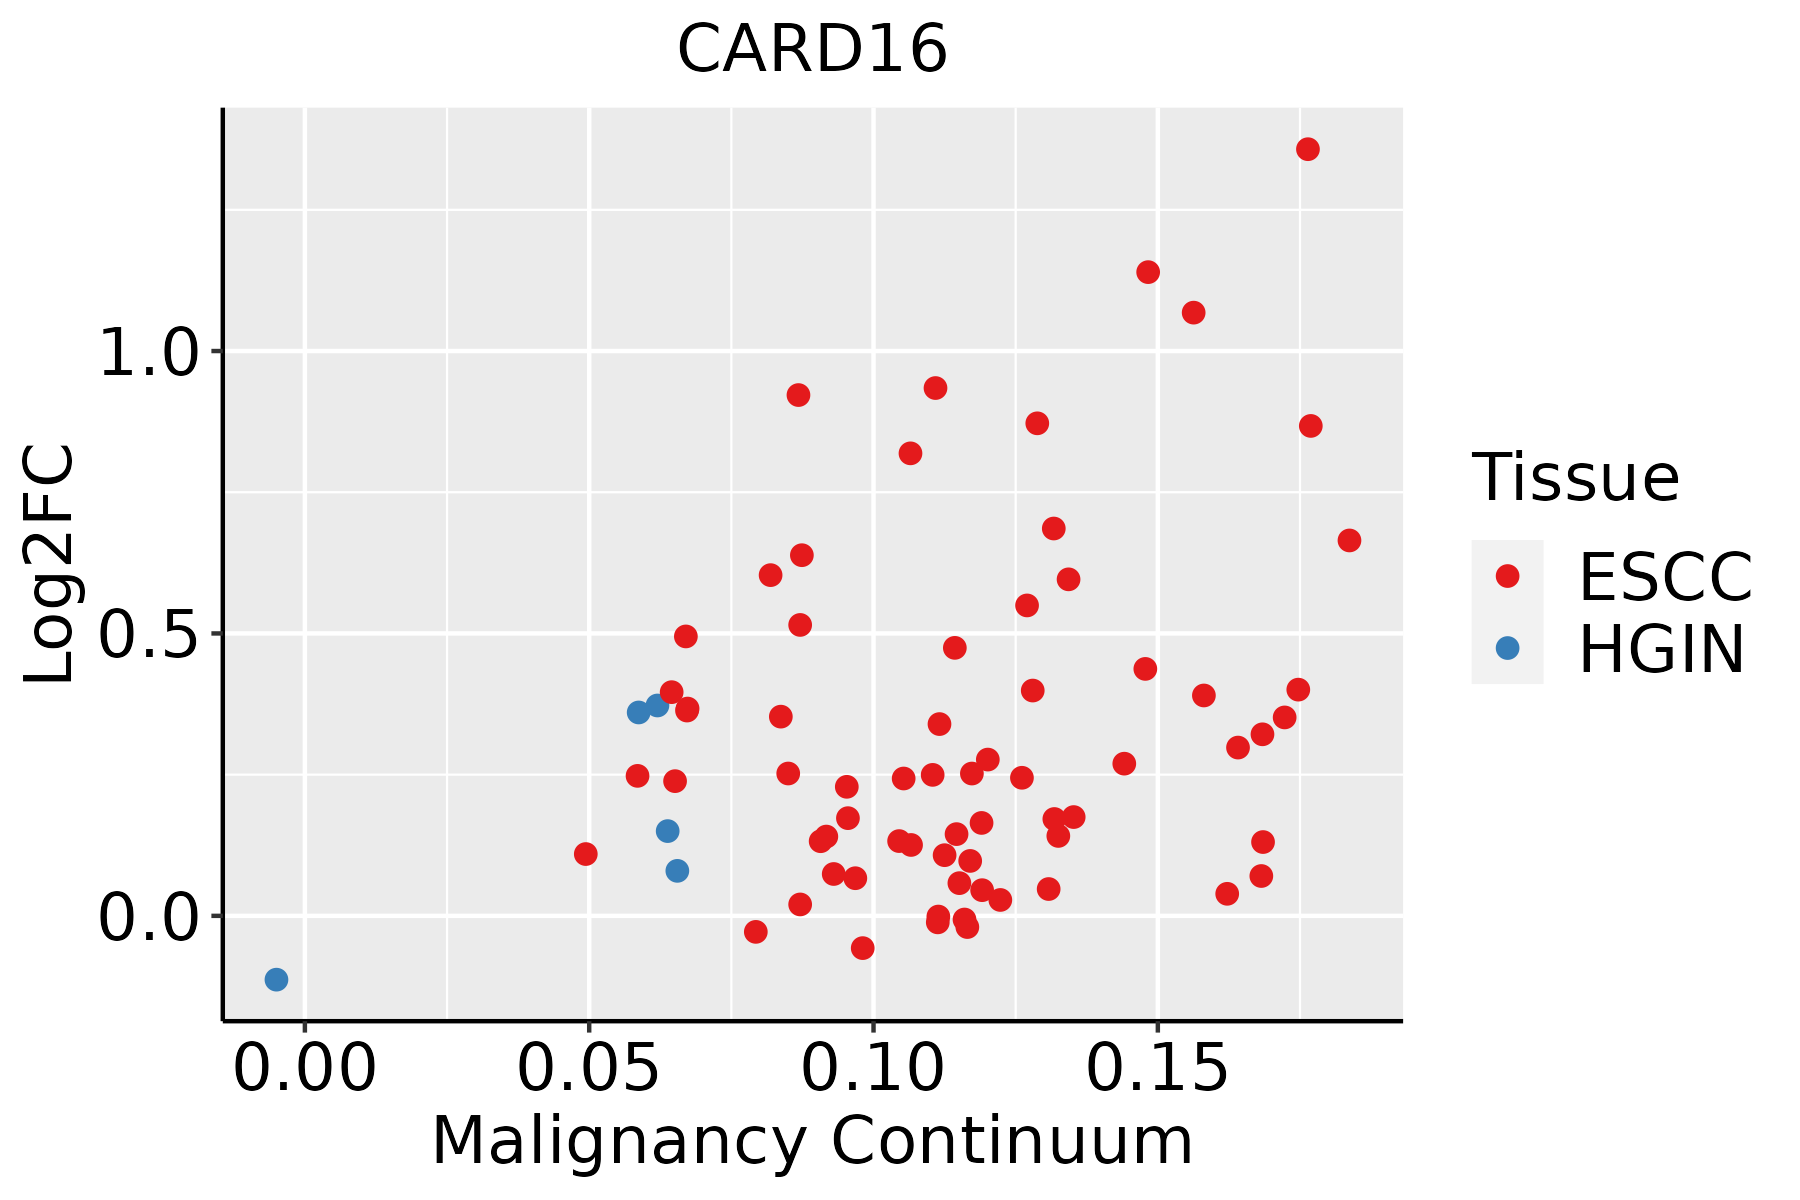 | ESCC: Esophageal squamous cell carcinoma |
| HGIN: High-grade intraepithelial neoplasias | ||
| LGIN: Low-grade intraepithelial neoplasias | ||
| Oral Cavity | 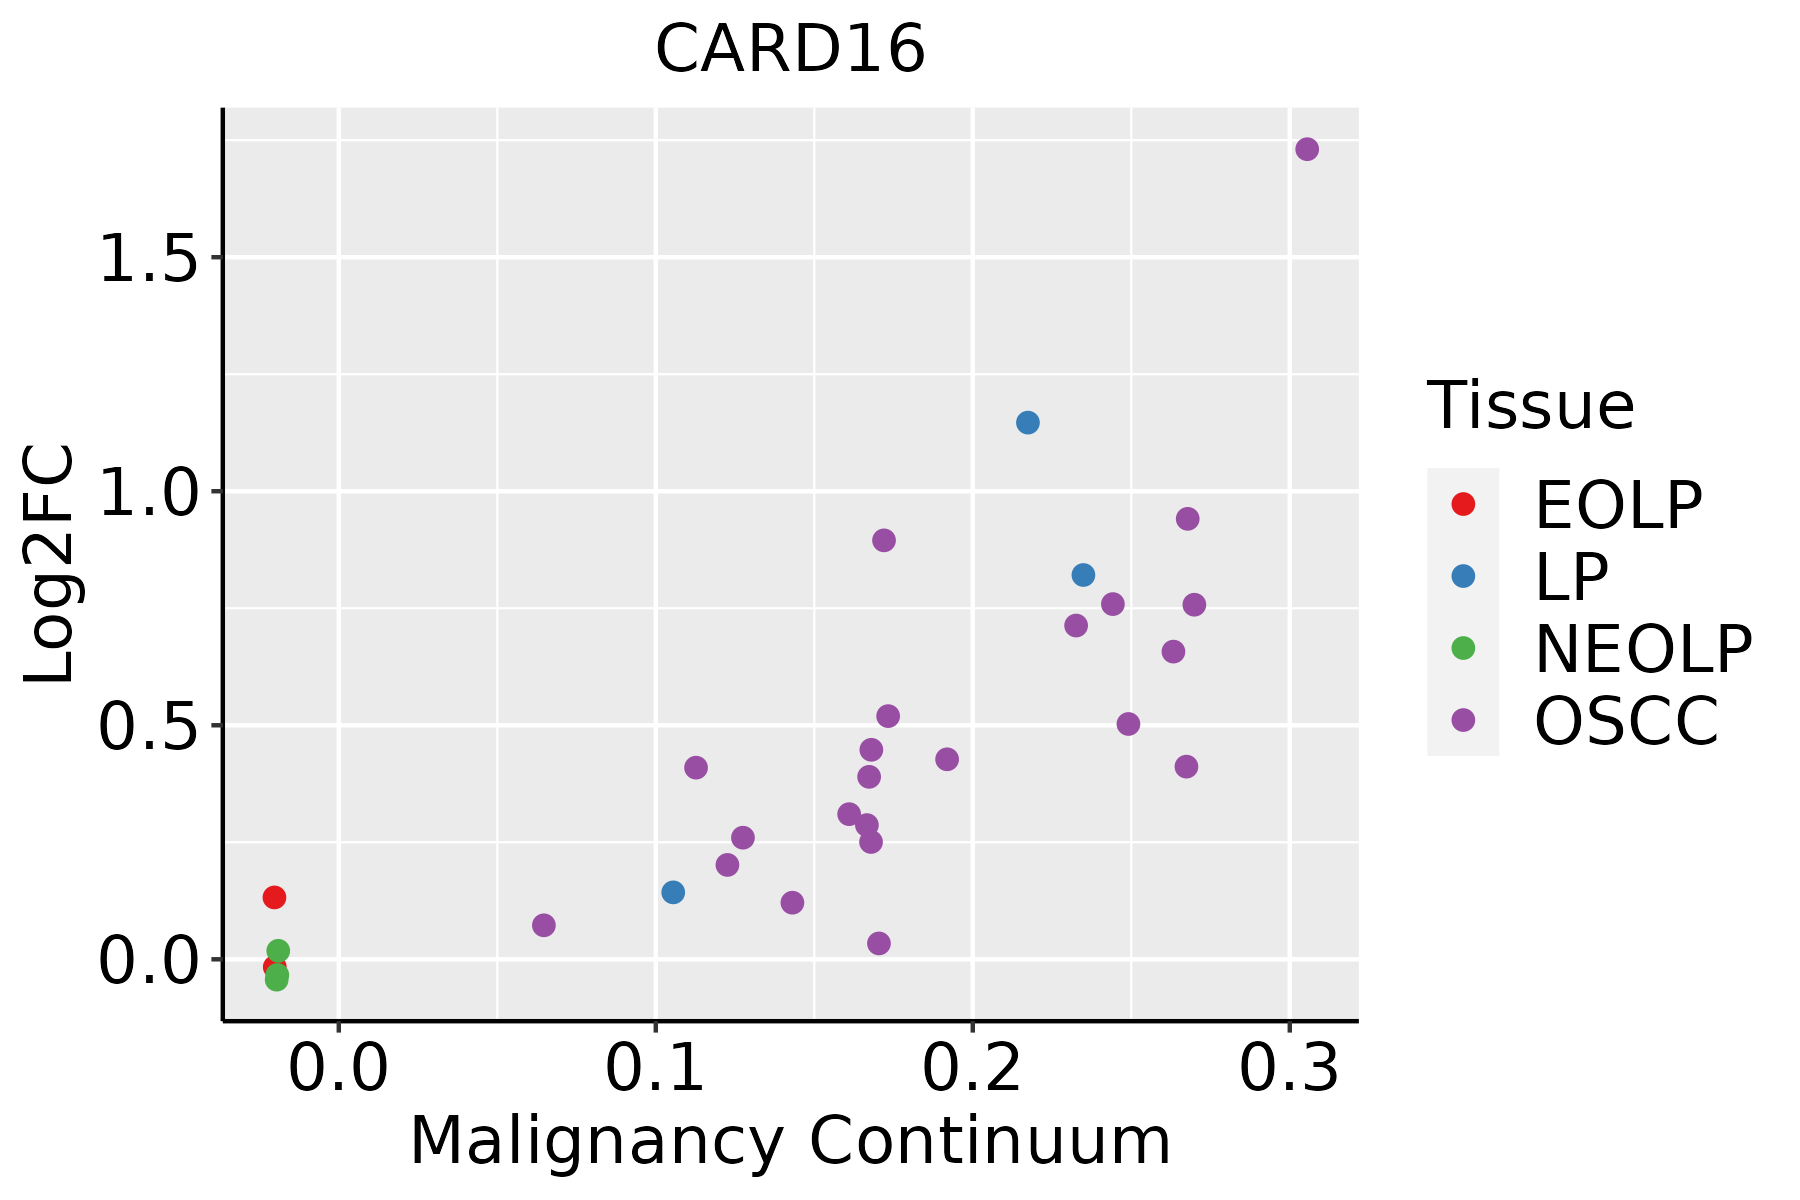 | EOLP: Erosive Oral lichen planus |
| LP: leukoplakia | ||
| NEOLP: Non-erosive oral lichen planus | ||
| OSCC: Oral squamous cell carcinoma |
| ∗log2FC in expression of this searched gene in stem-like cells from each diseased tissue sample relative to stem-like cells in normal samples in each tissue plotted against the malignancy continuum. Samples are colored based on if they are from different disease stage. |
Top |
Malignant transformation related pathway analysis |
| Find out the enriched GO biological processes and KEGG pathways involved in transition from healthy to precancer to cancer |
| Tissue | Disease Stage | Enriched GO biological Processes |
| Colorectum | AD |  |
| Colorectum | SER |  |
| Colorectum | MSS |  |
| Colorectum | MSI-H |  |
| Colorectum | FAP |  |
| ∗Top 15 enriched GO BP terms are showed in the bar plot of each disease state in each tissue. Each row represents a significant GO biological process which is colored according to the -log10(p.adjust). |
| Page: 1 2 3 4 5 6 7 8 9 |
| GO ID | Tissue | Disease Stage | Description | Gene Ratio | Bg Ratio | pvalue | p.adjust | Count |
| GO:004328126 | Esophagus | HGIN | regulation of cysteine-type endopeptidase activity involved in apoptotic process | 59/2587 | 209/18723 | 3.39e-08 | 1.97e-06 | 59 |
| GO:200011626 | Esophagus | HGIN | regulation of cysteine-type endopeptidase activity | 63/2587 | 235/18723 | 9.71e-08 | 5.02e-06 | 63 |
| GO:005254726 | Esophagus | HGIN | regulation of peptidase activity | 102/2587 | 461/18723 | 6.29e-07 | 2.72e-05 | 102 |
| GO:004312220 | Esophagus | HGIN | regulation of I-kappaB kinase/NF-kappaB signaling | 63/2587 | 249/18723 | 8.91e-07 | 3.61e-05 | 63 |
| GO:005254826 | Esophagus | HGIN | regulation of endopeptidase activity | 96/2587 | 432/18723 | 1.09e-06 | 4.30e-05 | 96 |
| GO:000724918 | Esophagus | HGIN | I-kappaB kinase/NF-kappaB signaling | 67/2587 | 281/18723 | 3.84e-06 | 1.29e-04 | 67 |
| GO:004312317 | Esophagus | HGIN | positive regulation of I-kappaB kinase/NF-kappaB signaling | 49/2587 | 186/18723 | 4.22e-06 | 1.40e-04 | 49 |
| GO:005160417 | Esophagus | HGIN | protein maturation | 68/2587 | 294/18723 | 9.77e-06 | 2.86e-04 | 68 |
| GO:007048220 | Esophagus | HGIN | response to oxygen levels | 76/2587 | 347/18723 | 2.36e-05 | 6.25e-04 | 76 |
| GO:005109825 | Esophagus | HGIN | regulation of binding | 78/2587 | 363/18723 | 3.73e-05 | 9.30e-04 | 78 |
| GO:007145319 | Esophagus | HGIN | cellular response to oxygen levels | 44/2587 | 177/18723 | 5.88e-05 | 1.38e-03 | 44 |
| GO:003629320 | Esophagus | HGIN | response to decreased oxygen levels | 70/2587 | 322/18723 | 6.23e-05 | 1.44e-03 | 70 |
| GO:000166620 | Esophagus | HGIN | response to hypoxia | 67/2587 | 307/18723 | 7.82e-05 | 1.75e-03 | 67 |
| GO:003629419 | Esophagus | HGIN | cellular response to decreased oxygen levels | 40/2587 | 161/18723 | 1.26e-04 | 2.57e-03 | 40 |
| GO:007145610 | Esophagus | HGIN | cellular response to hypoxia | 37/2587 | 151/18723 | 2.98e-04 | 5.07e-03 | 37 |
| GO:000931418 | Esophagus | HGIN | response to radiation | 88/2587 | 456/18723 | 6.26e-04 | 8.65e-03 | 88 |
| GO:00164857 | Esophagus | HGIN | protein processing | 49/2587 | 225/18723 | 7.04e-04 | 9.52e-03 | 49 |
| GO:003320910 | Esophagus | HGIN | tumor necrosis factor-mediated signaling pathway | 26/2587 | 99/18723 | 7.45e-04 | 9.90e-03 | 26 |
| GO:00714789 | Esophagus | HGIN | cellular response to radiation | 42/2587 | 186/18723 | 7.66e-04 | 1.00e-02 | 42 |
| GO:00094115 | Esophagus | HGIN | response to UV | 35/2587 | 149/18723 | 9.71e-04 | 1.22e-02 | 35 |
| Page: 1 2 3 4 5 6 7 8 9 10 |
| Pathway ID | Tissue | Disease Stage | Description | Gene Ratio | Bg Ratio | pvalue | p.adjust | qvalue | Count |
| hsa046219 | Esophagus | HGIN | NOD-like receptor signaling pathway | 45/1383 | 186/8465 | 3.40e-03 | 2.54e-02 | 2.02e-02 | 45 |
| hsa0462114 | Esophagus | HGIN | NOD-like receptor signaling pathway | 45/1383 | 186/8465 | 3.40e-03 | 2.54e-02 | 2.02e-02 | 45 |
| hsa0462122 | Esophagus | ESCC | NOD-like receptor signaling pathway | 116/4205 | 186/8465 | 2.90e-04 | 1.03e-03 | 5.30e-04 | 116 |
| hsa0462132 | Esophagus | ESCC | NOD-like receptor signaling pathway | 116/4205 | 186/8465 | 2.90e-04 | 1.03e-03 | 5.30e-04 | 116 |
| hsa046218 | Oral cavity | OSCC | NOD-like receptor signaling pathway | 108/3704 | 186/8465 | 5.13e-05 | 2.07e-04 | 1.05e-04 | 108 |
| hsa0462113 | Oral cavity | OSCC | NOD-like receptor signaling pathway | 108/3704 | 186/8465 | 5.13e-05 | 2.07e-04 | 1.05e-04 | 108 |
| hsa0462121 | Oral cavity | LP | NOD-like receptor signaling pathway | 73/2418 | 186/8465 | 9.80e-04 | 4.53e-03 | 2.92e-03 | 73 |
| hsa0462131 | Oral cavity | LP | NOD-like receptor signaling pathway | 73/2418 | 186/8465 | 9.80e-04 | 4.53e-03 | 2.92e-03 | 73 |
| Page: 1 |
Top |
Cell-cell communication analysis |
| Identification of potential cell-cell interactions between two cell types and their ligand-receptor pairs for different disease states |
| Ligand | Receptor | LRpair | Pathway | Tissue | Disease Stage |
| Page: 1 |
Top |
Single-cell gene regulatory network inference analysis |
| Find out the significant the regulons (TFs) and the target genes of each regulon across cell types for different disease states |
| TF | Cell Type | Tissue | Disease Stage | Target Gene | RSS | Regulon Activity |
| ∗The dot plots of a searched regulon are shown for all cell subpopulations in each disease state of each tissue based on the regulon specific score inferred using pySCENIC and by calculating the average expression. |
| Page: 1 |
Top |
Somatic mutation of malignant transformation related genes |
| Annotation of somatic variants for genes involved in malignant transformation |
| Hugo Symbol | Variant Class | Variant Classification | dbSNP RS | HGVSc | HGVSp | HGVSp Short | SWISSPROT | BIOTYPE | SIFT | PolyPhen | Tumor Sample Barcode | Tissue | Histology | Sex | Age | Stage | Therapy Types | Drugs | Outcome |
| CARD16 | SNV | Missense_Mutation | rs148140246 | c.257C>T | p.Thr86Met | p.T86M | Q5EG05 | protein_coding | tolerated(0.05) | benign(0.283) | TCGA-AR-A1AX-01 | Breast | breast invasive carcinoma | Female | <65 | I/II | Chemotherapy | cytoxan | SD |
| CARD16 | SNV | Missense_Mutation | novel | c.24N>C | p.Glu8Asp | p.E8D | Q5EG05 | protein_coding | tolerated(0.11) | benign(0.055) | TCGA-E2-A2P6-01 | Breast | breast invasive carcinoma | Female | >=65 | I/II | Hormone Therapy | anastrozole | SD |
| CARD16 | SNV | Missense_Mutation | c.293N>G | p.Asp98Gly | p.D98G | Q5EG05 | protein_coding | tolerated(0.07) | benign(0.275) | TCGA-AA-3663-01 | Colorectum | colon adenocarcinoma | Male | <65 | I/II | Unknown | Unknown | SD | |
| CARD16 | SNV | Missense_Mutation | c.112N>A | p.Glu38Lys | p.E38K | Q5EG05 | protein_coding | deleterious(0.05) | probably_damaging(1) | TCGA-AA-3930-01 | Colorectum | colon adenocarcinoma | Male | >=65 | III/IV | Chemotherapy | capecitabine | PD | |
| CARD16 | SNV | Missense_Mutation | rs577987861 | c.197N>T | p.Ala66Val | p.A66V | Q5EG05 | protein_coding | tolerated(0.21) | possibly_damaging(0.781) | TCGA-AP-A1DR-01 | Endometrium | uterine corpus endometrioid carcinoma | Female | <65 | III/IV | Chemotherapy | cisplatin | SD |
| CARD16 | SNV | Missense_Mutation | novel | c.134N>T | p.Arg45Leu | p.R45L | Q5EG05 | protein_coding | tolerated(0.25) | benign(0.055) | TCGA-AX-A1CC-01 | Endometrium | uterine corpus endometrioid carcinoma | Female | >=65 | I/II | Chemotherapy | carboplatin | SD |
| CARD16 | SNV | Missense_Mutation | rs764935029 | c.428G>T | p.Arg143Ile | p.R143I | Q5EG05 | protein_coding | deleterious_low_confidence(0) | probably_damaging(0.937) | TCGA-B5-A0JY-01 | Endometrium | uterine corpus endometrioid carcinoma | Female | <65 | III/IV | Chemotherapy | doxorubicin | SD |
| CARD16 | SNV | Missense_Mutation | rs192024074 | c.133N>T | p.Arg45Cys | p.R45C | Q5EG05 | protein_coding | tolerated(0.27) | benign(0.01) | TCGA-B5-A1MX-01 | Endometrium | uterine corpus endometrioid carcinoma | Female | <65 | I/II | Hormone Therapy | megace | SD |
| CARD16 | SNV | Missense_Mutation | novel | c.283N>A | p.Ala95Thr | p.A95T | Q5EG05 | protein_coding | tolerated(0.1) | benign(0.038) | TCGA-DF-A2KU-01 | Endometrium | uterine corpus endometrioid carcinoma | Female | Unknown | I/II | Unknown | Unknown | SD |
| CARD16 | SNV | Missense_Mutation | rs112423474 | c.358N>A | p.Ala120Thr | p.A120T | Q5EG05 | protein_coding | tolerated(0.27) | possibly_damaging(0.677) | TCGA-EY-A215-01 | Endometrium | uterine corpus endometrioid carcinoma | Female | <65 | I/II | Unknown | Unknown | SD |
| Page: 1 2 |
Top |
Related drugs of malignant transformation related genes |
| Identification of chemicals and drugs interact with genes involved in malignant transfromation |
| (DGIdb 4.0) |
| Entrez ID | Symbol | Category | Interaction Types | Drug Claim Name | Drug Name | PMIDs |
| Page: 1 |

Copyright 2023-Present -The University of Texas Health Science Center at Houston |