
|
|||||
|
 | |
| |
| |
| |
| |
| |
|
Gene: CARD11 |
Gene summary for CARD11 |
| Gene information | Species | Human | Gene symbol | CARD11 | Gene ID | 84433 |
| Gene name | caspase recruitment domain family member 11 | |
| Gene Alias | BENTA | |
| Cytomap | 7p22.2 | |
| Gene Type | protein-coding | GO ID | GO:0001775 | UniProtAcc | A0A024R854 |
Top |
Malignant transformation analysis |
| Identification of the aberrant gene expression in precancerous and cancerous lesions by comparing the gene expression of stem-like cells in diseased tissues with normal stem cells |
| Entrez ID | Symbol | Replicates | Species | Organ | Tissue | Adj P-value | Log2FC | Malignancy |
| 84433 | CARD11 | RNA-P3T-P3T-1 | Human | Lung | IAC | 1.70e-10 | 6.60e-01 | 0.1829 |
| 84433 | CARD11 | RNA-P3T-P3T-2 | Human | Lung | IAC | 3.17e-07 | 5.62e-01 | 0.1835 |
| 84433 | CARD11 | RNA-P3T-P3T-4 | Human | Lung | IAC | 8.54e-11 | 6.63e-01 | 0.1859 |
| 84433 | CARD11 | RNA-P7T1-P7T1-1 | Human | Lung | AIS | 3.94e-06 | 6.29e-01 | -0.0961 |
| 84433 | CARD11 | RNA-P7T1-P7T1-2 | Human | Lung | AIS | 1.46e-05 | 5.24e-01 | -0.0876 |
| 84433 | CARD11 | RNA-P7T1-P7T1-3 | Human | Lung | AIS | 2.91e-02 | 4.07e-01 | -0.0822 |
| 84433 | CARD11 | RNA-P7T1-P7T1-4 | Human | Lung | AIS | 2.35e-06 | 5.63e-01 | -0.0809 |
| 84433 | CARD11 | HTA12-23-1 | Human | Pancreas | PDAC | 2.25e-04 | 5.38e-01 | 0.3405 |
| 84433 | CARD11 | HTA12-25-1 | Human | Pancreas | PDAC | 3.64e-05 | 4.91e-01 | 0.313 |
| 84433 | CARD11 | HTA12-26-1 | Human | Pancreas | PDAC | 9.18e-12 | 5.99e-01 | 0.3728 |
| 84433 | CARD11 | HTA12-29-1 | Human | Pancreas | PDAC | 1.17e-22 | 5.54e-01 | 0.3722 |
| 84433 | CARD11 | HTA12-30-1 | Human | Pancreas | PDAC | 2.27e-04 | 9.41e-01 | 0.3671 |
| Page: 1 |
| Tissue | Expression Dynamics | Abbreviation |
| Lung | 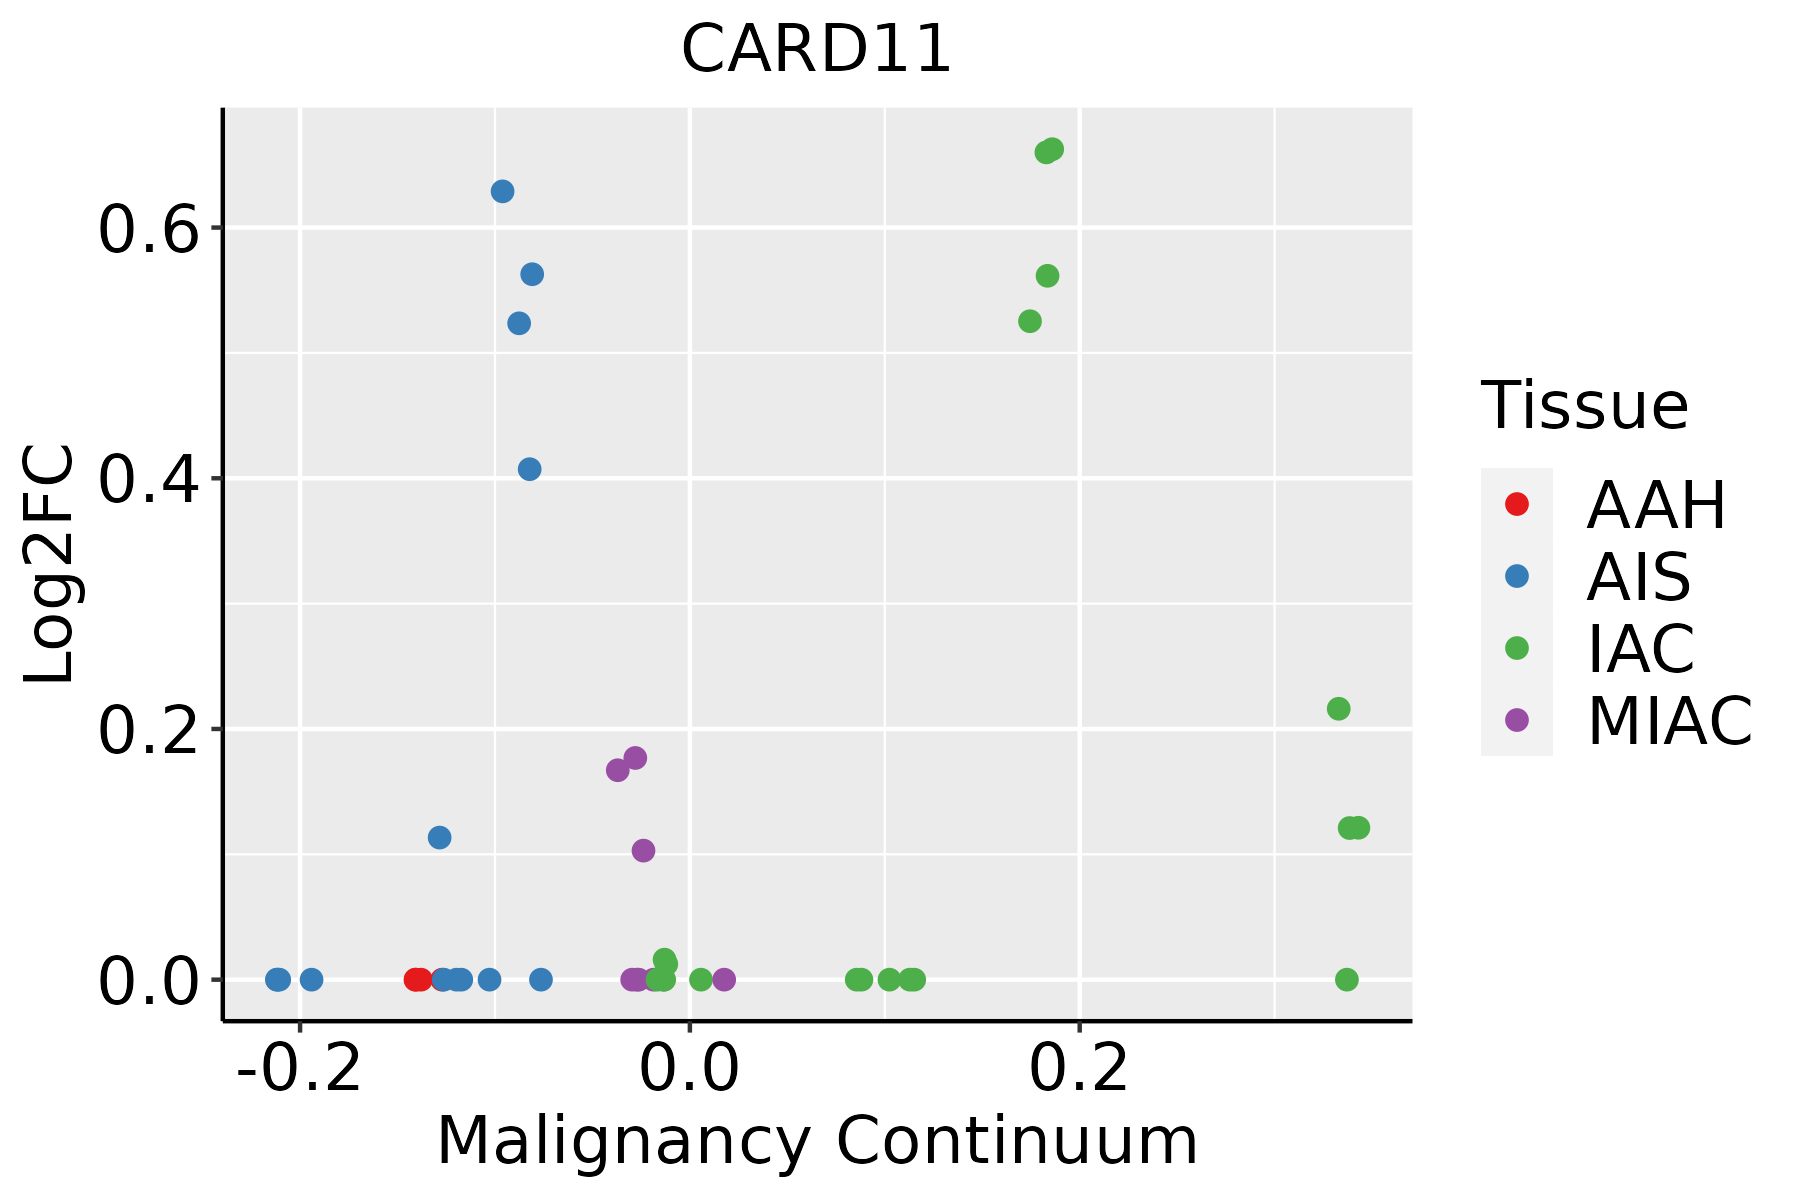 | AAH: Atypical adenomatous hyperplasia |
| AIS: Adenocarcinoma in situ | ||
| IAC: Invasive lung adenocarcinoma | ||
| MIA: Minimally invasive adenocarcinoma |
| ∗log2FC in expression of this searched gene in stem-like cells from each diseased tissue sample relative to stem-like cells in normal samples in each tissue plotted against the malignancy continuum. Samples are colored based on if they are from different disease stage. |
Top |
Malignant transformation related pathway analysis |
| Find out the enriched GO biological processes and KEGG pathways involved in transition from healthy to precancer to cancer |
| Tissue | Disease Stage | Enriched GO biological Processes |
| Colorectum | AD |  |
| Colorectum | SER |  |
| Colorectum | MSS |  |
| Colorectum | MSI-H |  |
| Colorectum | FAP |  |
| ∗Top 15 enriched GO BP terms are showed in the bar plot of each disease state in each tissue. Each row represents a significant GO biological process which is colored according to the -log10(p.adjust). |
| Page: 1 2 3 4 5 6 7 8 9 |
| GO ID | Tissue | Disease Stage | Description | Gene Ratio | Bg Ratio | pvalue | p.adjust | Count |
| GO:00457858 | Lung | IAC | positive regulation of cell adhesion | 87/2061 | 437/18723 | 2.59e-08 | 3.13e-06 | 87 |
| GO:00072495 | Lung | IAC | I-kappaB kinase/NF-kappaB signaling | 56/2061 | 281/18723 | 7.39e-06 | 2.62e-04 | 56 |
| GO:00431226 | Lung | IAC | regulation of I-kappaB kinase/NF-kappaB signaling | 51/2061 | 249/18723 | 8.41e-06 | 2.87e-04 | 51 |
| GO:00488728 | Lung | IAC | homeostasis of number of cells | 54/2061 | 272/18723 | 1.20e-05 | 3.64e-04 | 54 |
| GO:00510903 | Lung | IAC | regulation of DNA-binding transcription factor activity | 76/2061 | 440/18723 | 4.44e-05 | 1.05e-03 | 76 |
| GO:00510914 | Lung | IAC | positive regulation of DNA-binding transcription factor activity | 50/2061 | 260/18723 | 5.87e-05 | 1.29e-03 | 50 |
| GO:00224078 | Lung | IAC | regulation of cell-cell adhesion | 76/2061 | 448/18723 | 8.16e-05 | 1.68e-03 | 76 |
| GO:00431235 | Lung | IAC | positive regulation of I-kappaB kinase/NF-kappaB signaling | 38/2061 | 186/18723 | 1.19e-04 | 2.25e-03 | 38 |
| GO:0051092 | Lung | IAC | positive regulation of NF-kappaB transcription factor activity | 32/2061 | 152/18723 | 2.25e-04 | 3.90e-03 | 32 |
| GO:00421106 | Lung | IAC | T cell activation | 77/2061 | 487/18723 | 6.82e-04 | 9.20e-03 | 77 |
| GO:00091508 | Lung | IAC | purine ribonucleotide metabolic process | 61/2061 | 368/18723 | 7.24e-04 | 9.60e-03 | 61 |
| GO:00725218 | Lung | IAC | purine-containing compound metabolic process | 67/2061 | 416/18723 | 9.03e-04 | 1.11e-02 | 67 |
| GO:00224097 | Lung | IAC | positive regulation of cell-cell adhesion | 49/2061 | 284/18723 | 9.60e-04 | 1.16e-02 | 49 |
| GO:00092597 | Lung | IAC | ribonucleotide metabolic process | 62/2061 | 385/18723 | 1.38e-03 | 1.53e-02 | 62 |
| GO:00071596 | Lung | IAC | leukocyte cell-cell adhesion | 60/2061 | 371/18723 | 1.47e-03 | 1.57e-02 | 60 |
| GO:00061638 | Lung | IAC | purine nucleotide metabolic process | 63/2061 | 396/18723 | 1.72e-03 | 1.78e-02 | 63 |
| GO:0050852 | Lung | IAC | T cell receptor signaling pathway | 25/2061 | 123/18723 | 1.75e-03 | 1.80e-02 | 25 |
| GO:00508636 | Lung | IAC | regulation of T cell activation | 54/2061 | 329/18723 | 1.77e-03 | 1.82e-02 | 54 |
| GO:19031311 | Lung | IAC | mononuclear cell differentiation | 66/2061 | 426/18723 | 2.63e-03 | 2.44e-02 | 66 |
| GO:00196937 | Lung | IAC | ribose phosphate metabolic process | 62/2061 | 396/18723 | 2.72e-03 | 2.49e-02 | 62 |
| Page: 1 2 |
| Pathway ID | Tissue | Disease Stage | Description | Gene Ratio | Bg Ratio | pvalue | p.adjust | qvalue | Count |
| hsa04660 | Lung | IAC | T cell receptor signaling pathway | 23/1053 | 104/8465 | 3.88e-03 | 1.88e-02 | 1.25e-02 | 23 |
| hsa046601 | Lung | IAC | T cell receptor signaling pathway | 23/1053 | 104/8465 | 3.88e-03 | 1.88e-02 | 1.25e-02 | 23 |
| hsa046602 | Lung | AIS | T cell receptor signaling pathway | 20/961 | 104/8465 | 1.22e-02 | 4.94e-02 | 3.16e-02 | 20 |
| hsa046603 | Lung | AIS | T cell receptor signaling pathway | 20/961 | 104/8465 | 1.22e-02 | 4.94e-02 | 3.16e-02 | 20 |
| Page: 1 |
Top |
Cell-cell communication analysis |
| Identification of potential cell-cell interactions between two cell types and their ligand-receptor pairs for different disease states |
| Ligand | Receptor | LRpair | Pathway | Tissue | Disease Stage |
| Page: 1 |
Top |
Single-cell gene regulatory network inference analysis |
| Find out the significant the regulons (TFs) and the target genes of each regulon across cell types for different disease states |
| TF | Cell Type | Tissue | Disease Stage | Target Gene | RSS | Regulon Activity |
| ∗The dot plots of a searched regulon are shown for all cell subpopulations in each disease state of each tissue based on the regulon specific score inferred using pySCENIC and by calculating the average expression. |
| Page: 1 |
Top |
Somatic mutation of malignant transformation related genes |
| Annotation of somatic variants for genes involved in malignant transformation |
| Hugo Symbol | Variant Class | Variant Classification | dbSNP RS | HGVSc | HGVSp | HGVSp Short | SWISSPROT | BIOTYPE | SIFT | PolyPhen | Tumor Sample Barcode | Tissue | Histology | Sex | Age | Stage | Therapy Types | Drugs | Outcome |
| CARD11 | SNV | Missense_Mutation | novel | c.3017N>T | p.Ser1006Leu | p.S1006L | Q9BXL7 | protein_coding | deleterious(0.01) | benign(0.021) | TCGA-5T-A9QA-01 | Breast | breast invasive carcinoma | Female | <65 | I/II | Chemotherapy | taxol | SD |
| CARD11 | SNV | Missense_Mutation | c.2470N>C | p.Asp824His | p.D824H | Q9BXL7 | protein_coding | tolerated(0.19) | benign(0.149) | TCGA-A2-A0D2-01 | Breast | breast invasive carcinoma | Female | <65 | I/II | Chemotherapy | adriamycin | SD | |
| CARD11 | SNV | Missense_Mutation | novel | c.2020N>A | p.Asp674Asn | p.D674N | Q9BXL7 | protein_coding | deleterious(0.02) | benign(0.157) | TCGA-AN-A0FT-01 | Breast | breast invasive carcinoma | Female | <65 | I/II | Unknown | Unknown | SD |
| CARD11 | SNV | Missense_Mutation | novel | c.466N>G | p.Leu156Val | p.L156V | Q9BXL7 | protein_coding | tolerated(0.45) | benign(0.01) | TCGA-AN-A0G0-01 | Breast | breast invasive carcinoma | Female | <65 | I/II | Unknown | Unknown | SD |
| CARD11 | SNV | Missense_Mutation | c.2159N>A | p.Arg720Gln | p.R720Q | Q9BXL7 | protein_coding | tolerated(0.23) | benign(0.006) | TCGA-AR-A2LH-01 | Breast | breast invasive carcinoma | Female | <65 | III/IV | Chemotherapy | adriamycin | PD | |
| CARD11 | SNV | Missense_Mutation | c.41N>T | p.Thr14Met | p.T14M | Q9BXL7 | protein_coding | deleterious_low_confidence(0.04) | benign(0.125) | TCGA-BH-A0RX-01 | Breast | breast invasive carcinoma | Female | <65 | I/II | Chemotherapy | fluorouracil | SD | |
| CARD11 | SNV | Missense_Mutation | rs372251654 | c.3382G>A | p.Val1128Ile | p.V1128I | Q9BXL7 | protein_coding | tolerated(0.42) | benign(0.001) | TCGA-C8-A12T-01 | Breast | breast invasive carcinoma | Female | <65 | I/II | Unknown | Unknown | SD |
| CARD11 | SNV | Missense_Mutation | c.930G>C | p.Lys310Asn | p.K310N | Q9BXL7 | protein_coding | deleterious(0.01) | benign(0.075) | TCGA-C8-A27B-01 | Breast | breast invasive carcinoma | Female | <65 | I/II | Chemotherapy | 5-fluorouracil | CR | |
| CARD11 | SNV | Missense_Mutation | c.2823N>C | p.Leu941Phe | p.L941F | Q9BXL7 | protein_coding | tolerated(0.21) | benign(0) | TCGA-GM-A2DH-01 | Breast | breast invasive carcinoma | Female | <65 | I/II | Chemotherapy | taxol | CR | |
| CARD11 | SNV | Missense_Mutation | c.625G>A | p.Ala209Thr | p.A209T | Q9BXL7 | protein_coding | deleterious(0) | benign(0.312) | TCGA-OL-A66N-01 | Breast | breast invasive carcinoma | Female | <65 | III/IV | Unknown | Unknown | SD |
| Page: 1 2 3 4 5 6 7 8 9 10 11 12 13 14 15 16 17 18 19 |
Top |
Related drugs of malignant transformation related genes |
| Identification of chemicals and drugs interact with genes involved in malignant transfromation |
| (DGIdb 4.0) |
| Entrez ID | Symbol | Category | Interaction Types | Drug Claim Name | Drug Name | PMIDs |
| Page: 1 |

Copyright 2023-Present -The University of Texas Health Science Center at Houston |