
|
|||||
|
 | |
| |
| |
| |
| |
| |
|
Gene: CARD10 |
Gene summary for CARD10 |
| Gene information | Species | Human | Gene symbol | CARD10 | Gene ID | 29775 |
| Gene name | caspase recruitment domain family member 10 | |
| Gene Alias | BIMP1 | |
| Cytomap | 22q13.1 | |
| Gene Type | protein-coding | GO ID | GO:0001525 | UniProtAcc | Q9BWT7 |
Top |
Malignant transformation analysis |
| Identification of the aberrant gene expression in precancerous and cancerous lesions by comparing the gene expression of stem-like cells in diseased tissues with normal stem cells |
| Entrez ID | Symbol | Replicates | Species | Organ | Tissue | Adj P-value | Log2FC | Malignancy |
| 29775 | CARD10 | HTA11_2487_2000001011 | Human | Colorectum | SER | 1.78e-06 | 4.51e-01 | -0.1808 |
| 29775 | CARD10 | HTA11_1938_2000001011 | Human | Colorectum | AD | 2.27e-09 | 3.75e-01 | -0.0811 |
| 29775 | CARD10 | HTA11_78_2000001011 | Human | Colorectum | AD | 3.63e-02 | 2.83e-01 | -0.1088 |
| 29775 | CARD10 | HTA11_347_2000001011 | Human | Colorectum | AD | 7.25e-05 | 2.36e-01 | -0.1954 |
| 29775 | CARD10 | HTA11_411_2000001011 | Human | Colorectum | SER | 1.82e-03 | 6.98e-01 | -0.2602 |
| 29775 | CARD10 | HTA11_3361_2000001011 | Human | Colorectum | AD | 3.04e-02 | 3.13e-01 | -0.1207 |
| 29775 | CARD10 | HTA11_83_2000001011 | Human | Colorectum | SER | 2.61e-04 | 3.55e-01 | -0.1526 |
| 29775 | CARD10 | HTA11_696_2000001011 | Human | Colorectum | AD | 8.87e-15 | 4.01e-01 | -0.1464 |
| 29775 | CARD10 | HTA11_866_2000001011 | Human | Colorectum | AD | 3.71e-08 | 3.15e-01 | -0.1001 |
| 29775 | CARD10 | HTA11_1391_2000001011 | Human | Colorectum | AD | 1.75e-09 | 4.28e-01 | -0.059 |
| 29775 | CARD10 | HTA11_866_3004761011 | Human | Colorectum | AD | 1.41e-06 | 2.79e-01 | 0.096 |
| 29775 | CARD10 | HTA11_7696_3000711011 | Human | Colorectum | AD | 6.69e-11 | 3.32e-01 | 0.0674 |
| 29775 | CARD10 | HTA11_99999965104_69814 | Human | Colorectum | MSS | 3.58e-02 | 2.12e-01 | 0.281 |
| 29775 | CARD10 | HTA11_99999971662_82457 | Human | Colorectum | MSS | 2.12e-10 | 3.54e-01 | 0.3859 |
| 29775 | CARD10 | HTA11_99999973899_84307 | Human | Colorectum | MSS | 1.59e-06 | 4.53e-01 | 0.2585 |
| 29775 | CARD10 | HTA11_99999974143_84620 | Human | Colorectum | MSS | 1.02e-04 | 2.09e-01 | 0.3005 |
| 29775 | CARD10 | HCC1_Meng | Human | Liver | HCC | 6.11e-29 | 8.61e-02 | 0.0246 |
| 29775 | CARD10 | HCC2_Meng | Human | Liver | HCC | 2.91e-09 | 9.39e-02 | 0.0107 |
| 29775 | CARD10 | HCC2 | Human | Liver | HCC | 4.32e-07 | 1.95e+00 | 0.5341 |
| 29775 | CARD10 | S014 | Human | Liver | HCC | 2.88e-15 | 6.29e-01 | 0.2254 |
| Page: 1 2 |
| Tissue | Expression Dynamics | Abbreviation |
| Colorectum (GSE201348) |  | FAP: Familial adenomatous polyposis |
| CRC: Colorectal cancer | ||
| Colorectum (HTA11) |  | AD: Adenomas |
| SER: Sessile serrated lesions | ||
| MSI-H: Microsatellite-high colorectal cancer | ||
| MSS: Microsatellite stable colorectal cancer | ||
| Liver | 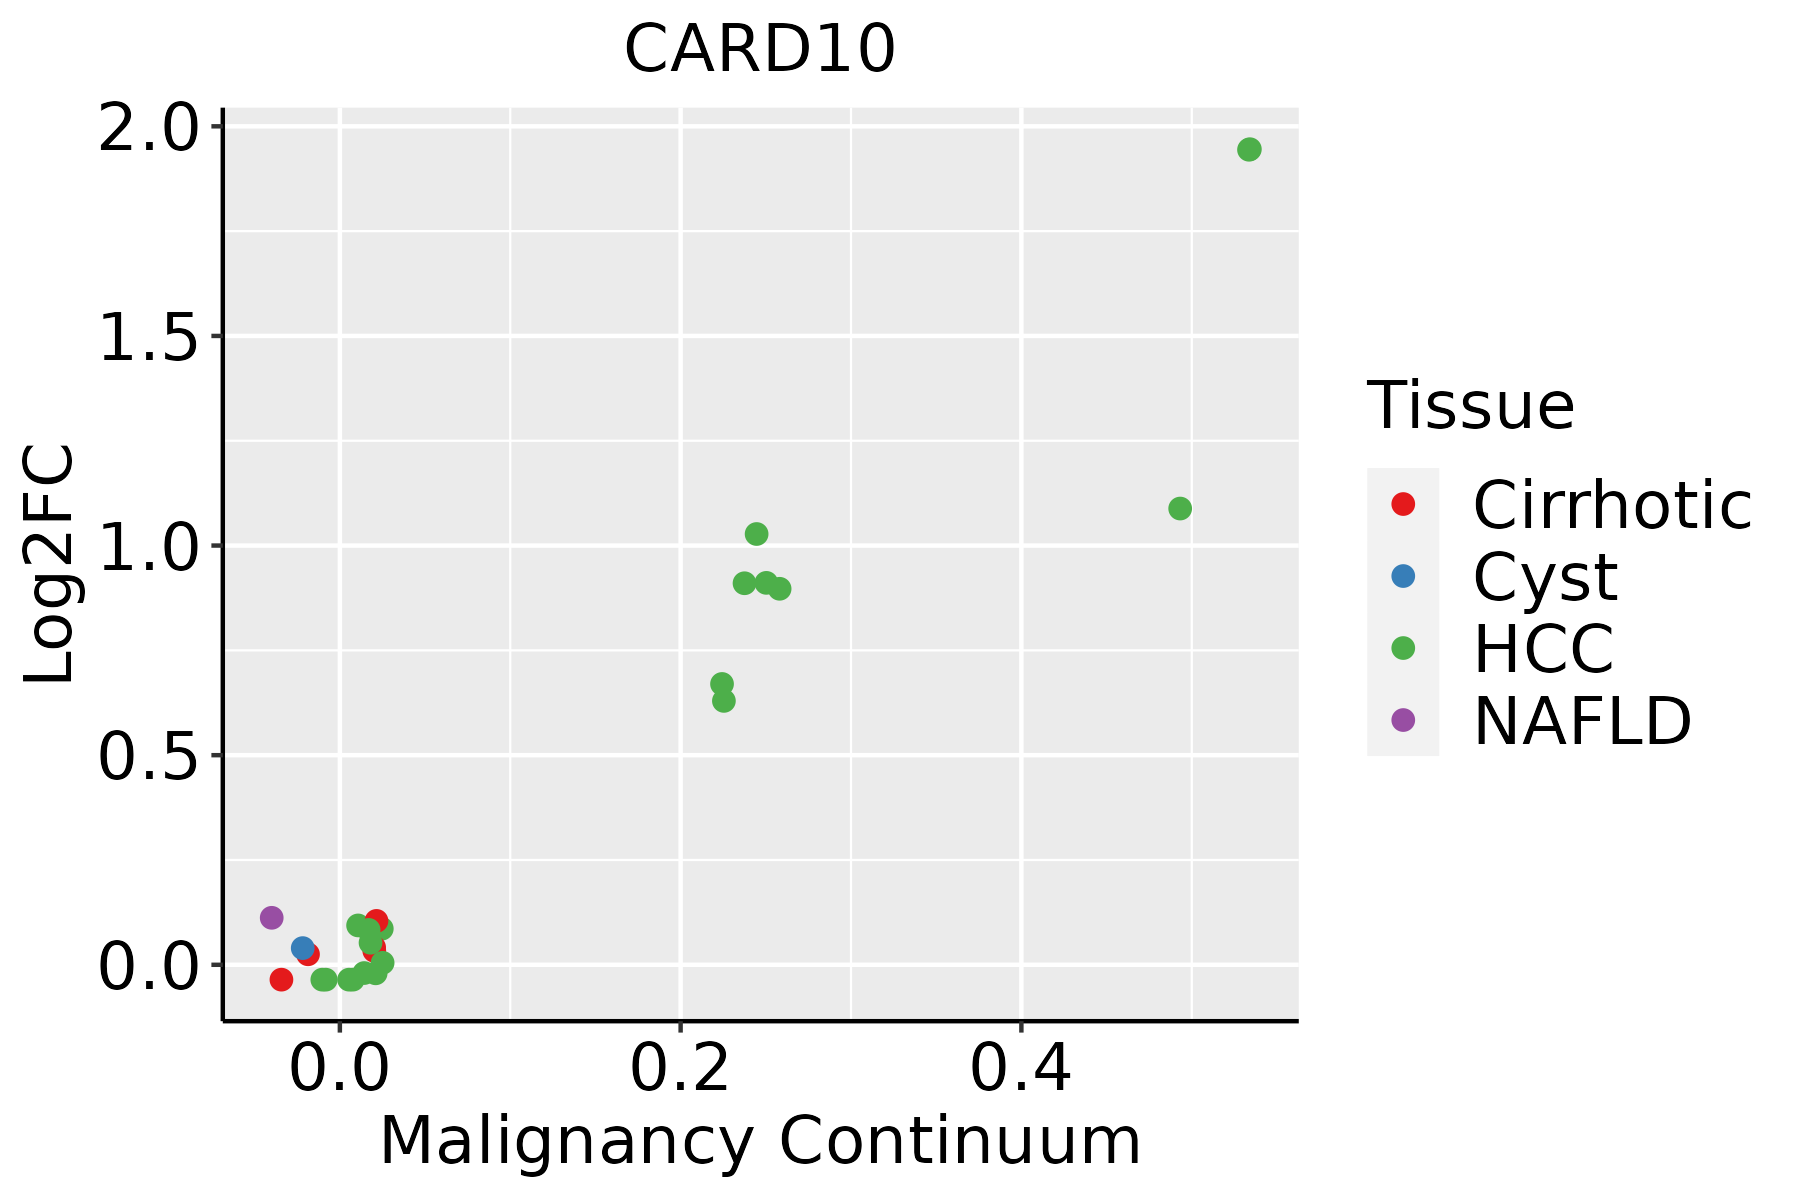 | HCC: Hepatocellular carcinoma |
| NAFLD: Non-alcoholic fatty liver disease | ||
| Oral Cavity | 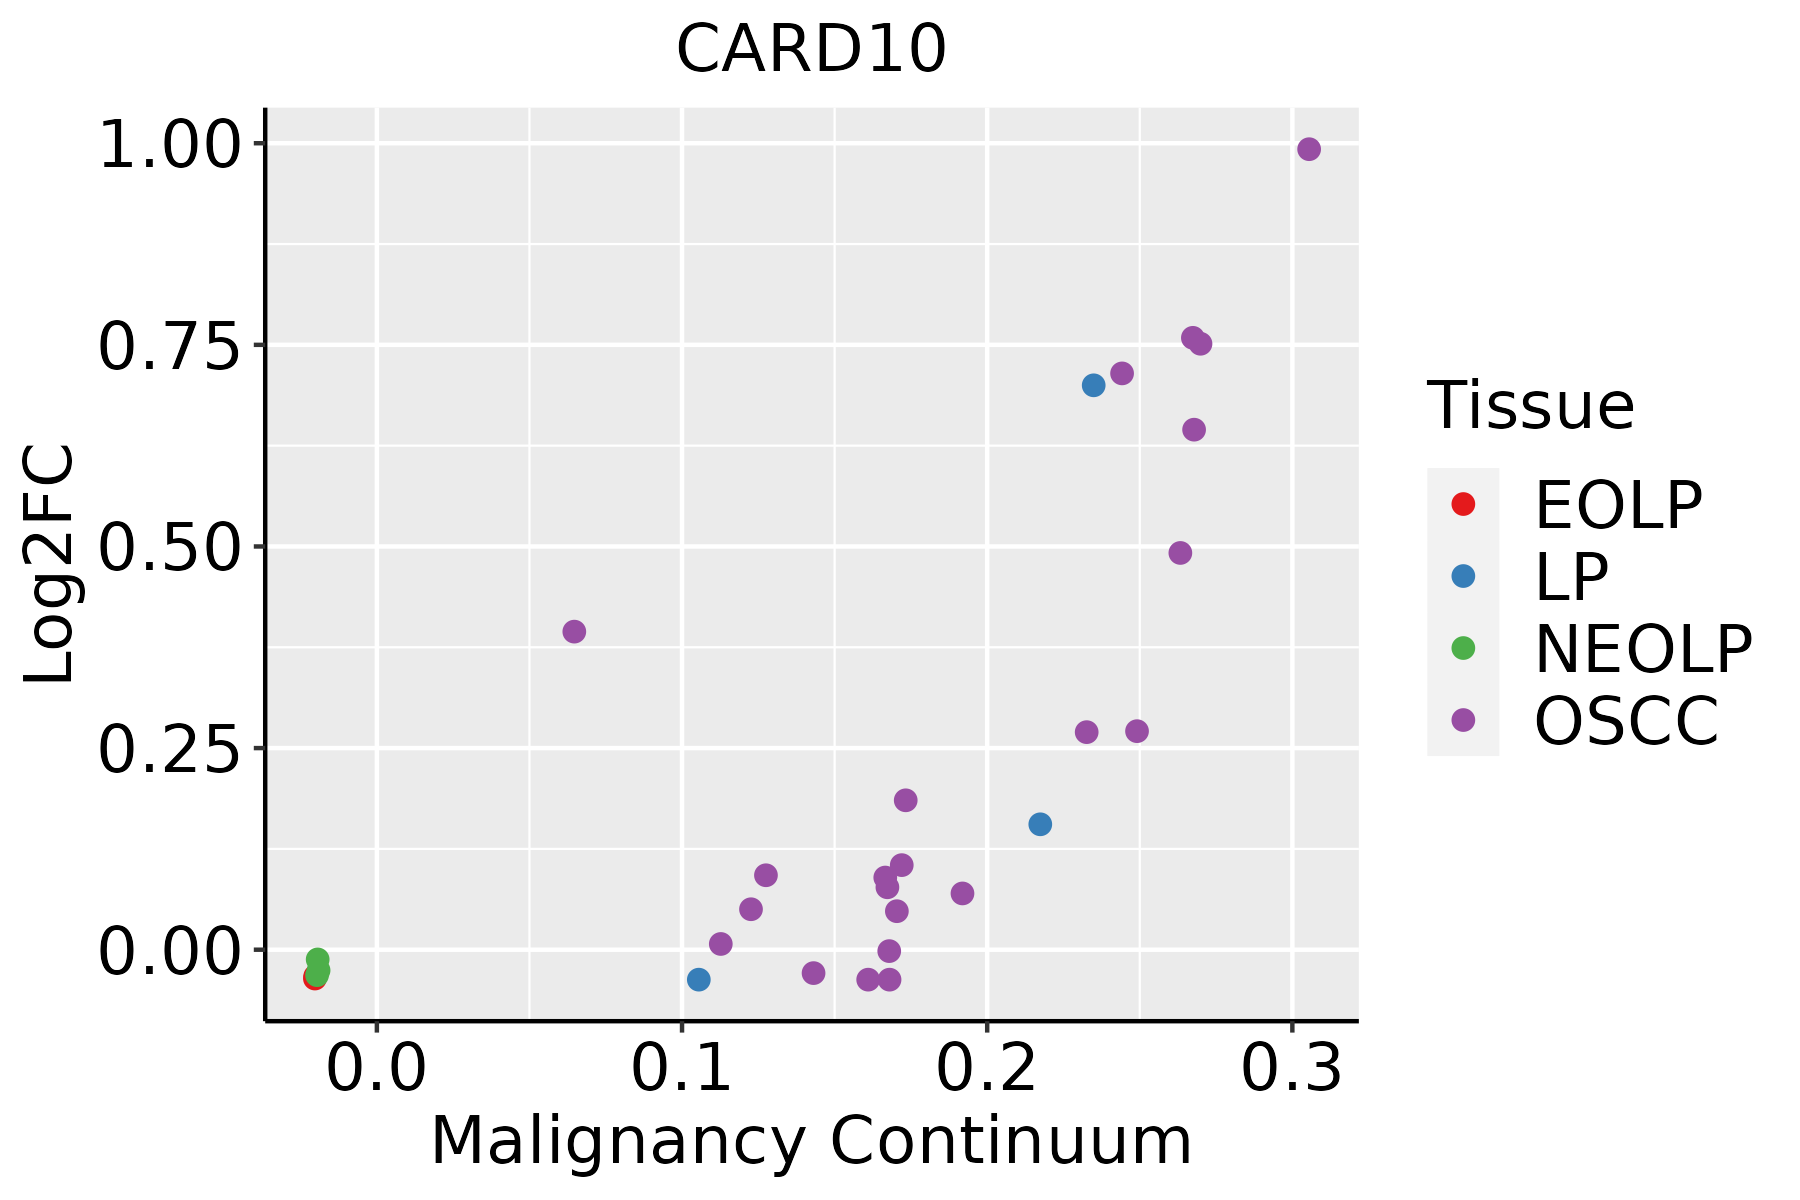 | EOLP: Erosive Oral lichen planus |
| LP: leukoplakia | ||
| NEOLP: Non-erosive oral lichen planus | ||
| OSCC: Oral squamous cell carcinoma | ||
| Skin | 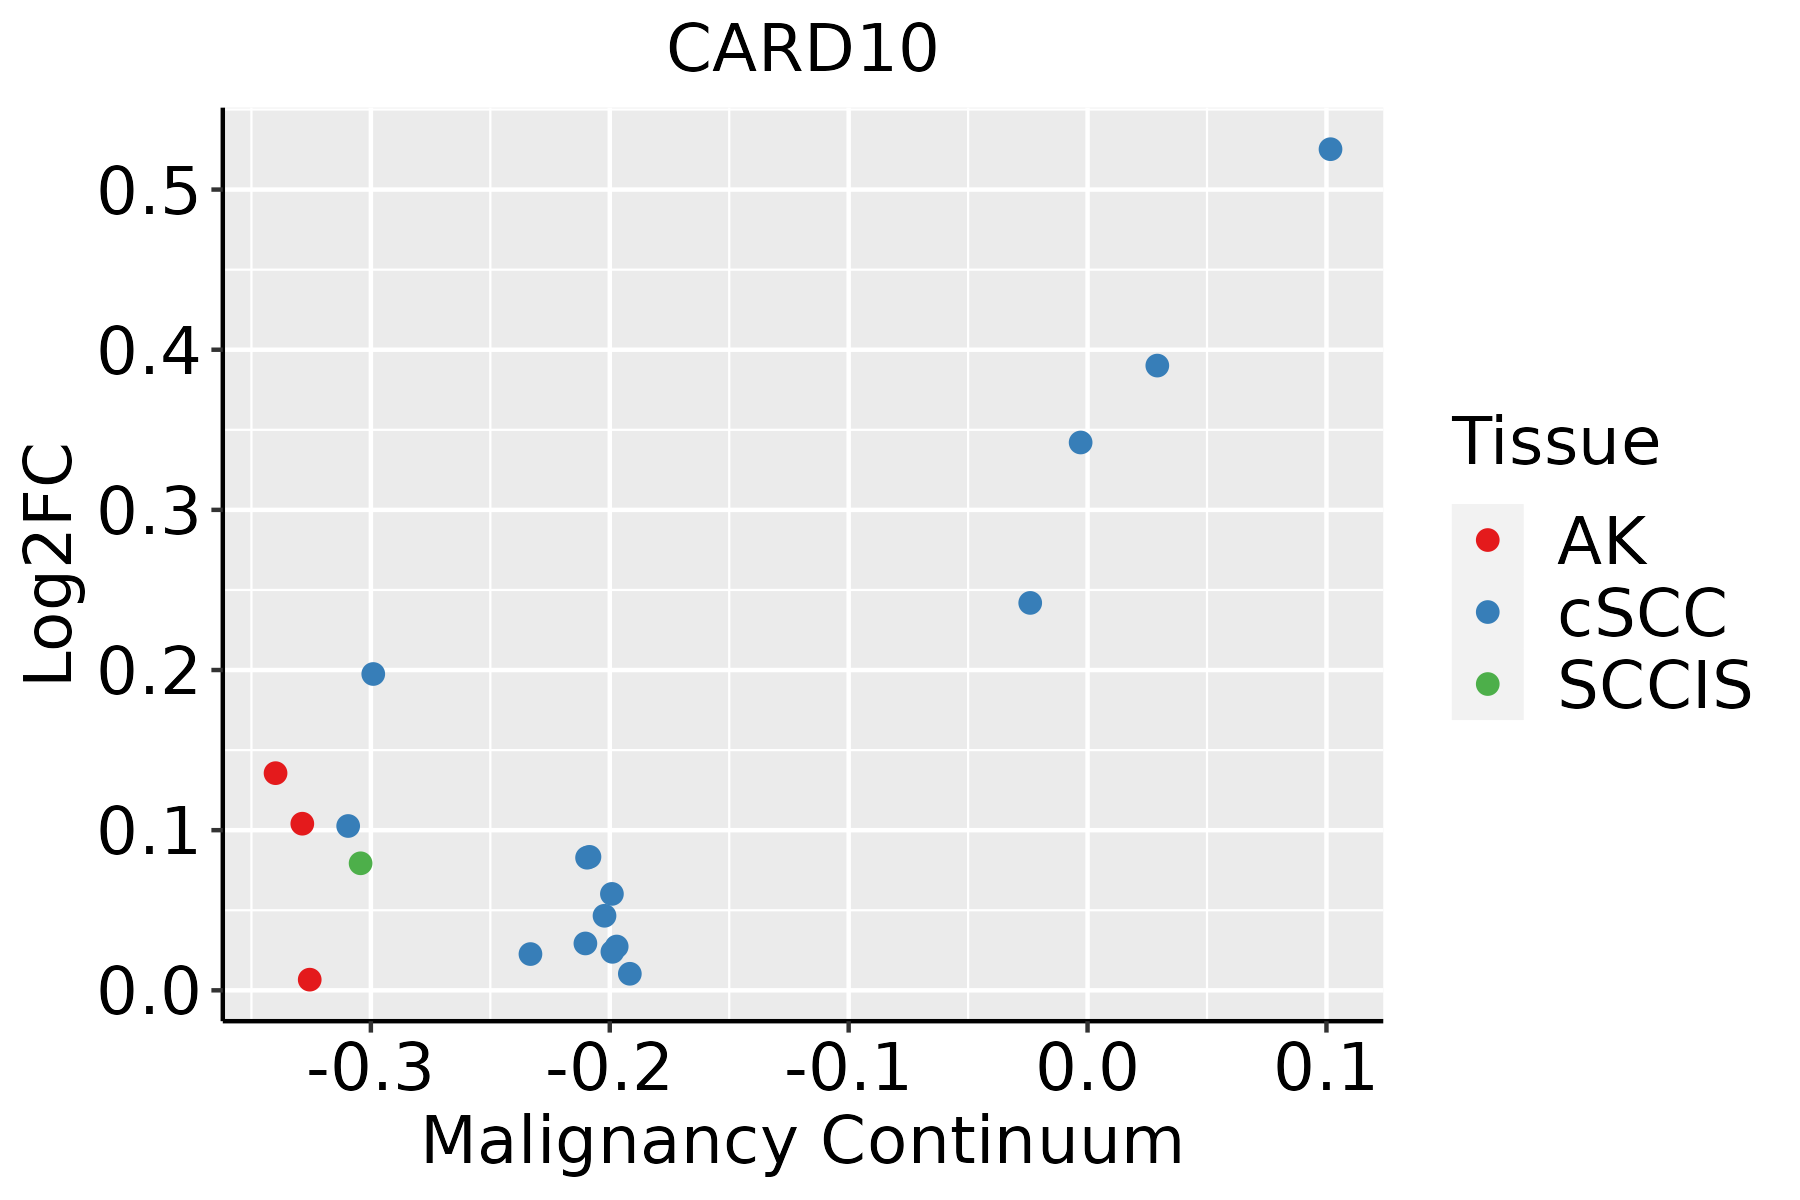 | AK: Actinic keratosis |
| cSCC: Cutaneous squamous cell carcinoma | ||
| SCCIS:squamous cell carcinoma in situ |
| ∗log2FC in expression of this searched gene in stem-like cells from each diseased tissue sample relative to stem-like cells in normal samples in each tissue plotted against the malignancy continuum. Samples are colored based on if they are from different disease stage. |
Top |
Malignant transformation related pathway analysis |
| Find out the enriched GO biological processes and KEGG pathways involved in transition from healthy to precancer to cancer |
| Tissue | Disease Stage | Enriched GO biological Processes |
| Colorectum | AD |  |
| Colorectum | SER |  |
| Colorectum | MSS |  |
| Colorectum | MSI-H |  |
| Colorectum | FAP |  |
| ∗Top 15 enriched GO BP terms are showed in the bar plot of each disease state in each tissue. Each row represents a significant GO biological process which is colored according to the -log10(p.adjust). |
| Page: 1 2 3 4 5 6 7 8 9 |
| GO ID | Tissue | Disease Stage | Description | Gene Ratio | Bg Ratio | pvalue | p.adjust | Count |
| GO:1903829 | Colorectum | AD | positive regulation of cellular protein localization | 110/3918 | 276/18723 | 4.58e-13 | 8.44e-11 | 110 |
| GO:1900180 | Colorectum | AD | regulation of protein localization to nucleus | 55/3918 | 136/18723 | 1.70e-07 | 7.34e-06 | 55 |
| GO:1900182 | Colorectum | AD | positive regulation of protein localization to nucleus | 38/3918 | 87/18723 | 1.43e-06 | 4.52e-05 | 38 |
| GO:0034504 | Colorectum | AD | protein localization to nucleus | 94/3918 | 290/18723 | 2.83e-06 | 8.09e-05 | 94 |
| GO:0001667 | Colorectum | AD | ameboidal-type cell migration | 137/3918 | 475/18723 | 2.17e-05 | 4.33e-04 | 137 |
| GO:0090132 | Colorectum | AD | epithelium migration | 105/3918 | 360/18723 | 1.18e-04 | 1.73e-03 | 105 |
| GO:0010632 | Colorectum | AD | regulation of epithelial cell migration | 88/3918 | 292/18723 | 1.19e-04 | 1.75e-03 | 88 |
| GO:0033674 | Colorectum | AD | positive regulation of kinase activity | 131/3918 | 467/18723 | 1.28e-04 | 1.85e-03 | 131 |
| GO:0010631 | Colorectum | AD | epithelial cell migration | 104/3918 | 357/18723 | 1.33e-04 | 1.90e-03 | 104 |
| GO:0090130 | Colorectum | AD | tissue migration | 105/3918 | 365/18723 | 2.10e-04 | 2.77e-03 | 105 |
| GO:0045860 | Colorectum | AD | positive regulation of protein kinase activity | 107/3918 | 386/18723 | 8.01e-04 | 7.92e-03 | 107 |
| GO:0043542 | Colorectum | AD | endothelial cell migration | 78/3918 | 279/18723 | 2.97e-03 | 2.22e-02 | 78 |
| GO:19038291 | Colorectum | SER | positive regulation of cellular protein localization | 86/2897 | 276/18723 | 3.61e-11 | 6.11e-09 | 86 |
| GO:19001801 | Colorectum | SER | regulation of protein localization to nucleus | 46/2897 | 136/18723 | 8.50e-08 | 5.27e-06 | 46 |
| GO:19001821 | Colorectum | SER | positive regulation of protein localization to nucleus | 33/2897 | 87/18723 | 2.81e-07 | 1.52e-05 | 33 |
| GO:00345041 | Colorectum | SER | protein localization to nucleus | 74/2897 | 290/18723 | 5.74e-06 | 2.05e-04 | 74 |
| GO:00016671 | Colorectum | SER | ameboidal-type cell migration | 105/2897 | 475/18723 | 6.97e-05 | 1.59e-03 | 105 |
| GO:00901321 | Colorectum | SER | epithelium migration | 82/2897 | 360/18723 | 1.50e-04 | 2.93e-03 | 82 |
| GO:00106311 | Colorectum | SER | epithelial cell migration | 81/2897 | 357/18723 | 1.87e-04 | 3.44e-03 | 81 |
| GO:00901301 | Colorectum | SER | tissue migration | 82/2897 | 365/18723 | 2.40e-04 | 4.12e-03 | 82 |
| Page: 1 2 3 4 5 |
| Pathway ID | Tissue | Disease Stage | Description | Gene Ratio | Bg Ratio | pvalue | p.adjust | qvalue | Count |
| hsa040644 | Oral cavity | OSCC | NF-kappa B signaling pathway | 67/3704 | 104/8465 | 1.57e-05 | 6.75e-05 | 3.44e-05 | 67 |
| hsa0406411 | Oral cavity | OSCC | NF-kappa B signaling pathway | 67/3704 | 104/8465 | 1.57e-05 | 6.75e-05 | 3.44e-05 | 67 |
| Page: 1 |
Top |
Cell-cell communication analysis |
| Identification of potential cell-cell interactions between two cell types and their ligand-receptor pairs for different disease states |
| Ligand | Receptor | LRpair | Pathway | Tissue | Disease Stage |
| Page: 1 |
Top |
Single-cell gene regulatory network inference analysis |
| Find out the significant the regulons (TFs) and the target genes of each regulon across cell types for different disease states |
| TF | Cell Type | Tissue | Disease Stage | Target Gene | RSS | Regulon Activity |
| ∗The dot plots of a searched regulon are shown for all cell subpopulations in each disease state of each tissue based on the regulon specific score inferred using pySCENIC and by calculating the average expression. |
| Page: 1 |
Top |
Somatic mutation of malignant transformation related genes |
| Annotation of somatic variants for genes involved in malignant transformation |
| Hugo Symbol | Variant Class | Variant Classification | dbSNP RS | HGVSc | HGVSp | HGVSp Short | SWISSPROT | BIOTYPE | SIFT | PolyPhen | Tumor Sample Barcode | Tissue | Histology | Sex | Age | Stage | Therapy Types | Drugs | Outcome |
| CARD10 | SNV | Missense_Mutation | novel | c.1715N>G | p.Ser572Cys | p.S572C | Q9BWT7 | protein_coding | deleterious(0) | probably_damaging(0.956) | TCGA-5L-AAT1-01 | Breast | breast invasive carcinoma | Female | <65 | III/IV | Hormone Therapy | letrozol | SD |
| CARD10 | SNV | Missense_Mutation | c.2038N>T | p.Pro680Ser | p.P680S | Q9BWT7 | protein_coding | tolerated(0.07) | benign(0.005) | TCGA-AR-A1AY-01 | Breast | breast invasive carcinoma | Female | >=65 | I/II | Unspecific | Doxorubicin | SD | |
| CARD10 | SNV | Missense_Mutation | c.1597C>T | p.Arg533Cys | p.R533C | Q9BWT7 | protein_coding | deleterious(0) | possibly_damaging(0.877) | TCGA-E9-A1RA-01 | Breast | breast invasive carcinoma | Female | <65 | I/II | Hormone Therapy | tamoxiphen | SD | |
| CARD10 | deletion | Frame_Shift_Del | novel | c.1014delG | p.Lys338AsnfsTer97 | p.K338Nfs*97 | Q9BWT7 | protein_coding | TCGA-EW-A2FV-01 | Breast | breast invasive carcinoma | Female | <65 | III/IV | Chemotherapy | docetaxel | SD | ||
| CARD10 | SNV | Missense_Mutation | novel | c.355N>T | p.Arg119Cys | p.R119C | Q9BWT7 | protein_coding | deleterious(0) | probably_damaging(0.996) | TCGA-C5-A2LV-01 | Cervix | cervical & endocervical cancer | Female | <65 | I/II | Unknown | Unknown | SD |
| CARD10 | SNV | Missense_Mutation | rs745445545 | c.2350N>T | p.Arg784Trp | p.R784W | Q9BWT7 | protein_coding | tolerated(0.1) | probably_damaging(0.936) | TCGA-C5-A7CO-01 | Cervix | cervical & endocervical cancer | Female | >=65 | I/II | Chemotherapy | cisplatin | SD |
| CARD10 | SNV | Missense_Mutation | c.1597C>T | p.Arg533Cys | p.R533C | Q9BWT7 | protein_coding | deleterious(0) | possibly_damaging(0.877) | TCGA-EA-A410-01 | Cervix | cervical & endocervical cancer | Female | <65 | I/II | Unknown | Unknown | SD | |
| CARD10 | SNV | Missense_Mutation | novel | c.2897N>T | p.Ser966Leu | p.S966L | Q9BWT7 | protein_coding | deleterious(0.01) | possibly_damaging(0.7) | TCGA-IR-A3LA-01 | Cervix | cervical & endocervical cancer | Female | <65 | I/II | Chemotherapy | cisplatin | CR |
| CARD10 | SNV | Missense_Mutation | c.2149N>A | p.Glu717Lys | p.E717K | Q9BWT7 | protein_coding | tolerated(0.15) | benign(0.072) | TCGA-JX-A3Q0-01 | Cervix | cervical & endocervical cancer | Female | <65 | III/IV | Unknown | Unknown | SD | |
| CARD10 | SNV | Missense_Mutation | c.1700N>T | p.Ser567Phe | p.S567F | Q9BWT7 | protein_coding | tolerated(0.2) | benign(0.005) | TCGA-Q1-A73O-01 | Cervix | cervical & endocervical cancer | Female | <65 | I/II | Chemotherapy | cisplatin | CR |
| Page: 1 2 3 4 5 6 7 |
Top |
Related drugs of malignant transformation related genes |
| Identification of chemicals and drugs interact with genes involved in malignant transfromation |
| (DGIdb 4.0) |
| Entrez ID | Symbol | Category | Interaction Types | Drug Claim Name | Drug Name | PMIDs |
| Page: 1 |

Copyright 2023-Present -The University of Texas Health Science Center at Houston |