
|
|||||
|
 | |
| |
| |
| |
| |
| |
|
Gene: CAPZB |
Gene summary for CAPZB |
| Gene information | Species | Human | Gene symbol | CAPZB | Gene ID | 832 |
| Gene name | capping actin protein of muscle Z-line subunit beta | |
| Gene Alias | CAPB | |
| Cytomap | 1p36.13 | |
| Gene Type | protein-coding | GO ID | GO:0000902 | UniProtAcc | P47756 |
Top |
Malignant transformation analysis |
| Identification of the aberrant gene expression in precancerous and cancerous lesions by comparing the gene expression of stem-like cells in diseased tissues with normal stem cells |
| Entrez ID | Symbol | Replicates | Species | Organ | Tissue | Adj P-value | Log2FC | Malignancy |
| 832 | CAPZB | CA_HPV_1 | Human | Cervix | CC | 8.70e-04 | 3.23e-02 | 0.0264 |
| 832 | CAPZB | N_HPV_2 | Human | Cervix | N_HPV | 4.61e-03 | 2.70e-01 | -0.0131 |
| 832 | CAPZB | CCI_1 | Human | Cervix | CC | 9.27e-03 | 5.20e-01 | 0.528 |
| 832 | CAPZB | CCI_2 | Human | Cervix | CC | 1.06e-03 | 4.76e-01 | 0.5249 |
| 832 | CAPZB | CCI_3 | Human | Cervix | CC | 1.17e-04 | 5.66e-01 | 0.516 |
| 832 | CAPZB | L1 | Human | Cervix | CC | 8.75e-03 | -5.44e-02 | 0.0802 |
| 832 | CAPZB | HTA11_2487_2000001011 | Human | Colorectum | SER | 1.78e-20 | 1.06e+00 | -0.1808 |
| 832 | CAPZB | HTA11_1938_2000001011 | Human | Colorectum | AD | 7.60e-09 | 7.72e-01 | -0.0811 |
| 832 | CAPZB | HTA11_78_2000001011 | Human | Colorectum | AD | 1.17e-12 | 7.28e-01 | -0.1088 |
| 832 | CAPZB | HTA11_347_2000001011 | Human | Colorectum | AD | 2.69e-31 | 1.13e+00 | -0.1954 |
| 832 | CAPZB | HTA11_411_2000001011 | Human | Colorectum | SER | 1.29e-13 | 1.60e+00 | -0.2602 |
| 832 | CAPZB | HTA11_2112_2000001011 | Human | Colorectum | SER | 7.69e-14 | 1.20e+00 | -0.2196 |
| 832 | CAPZB | HTA11_3361_2000001011 | Human | Colorectum | AD | 5.96e-10 | 7.48e-01 | -0.1207 |
| 832 | CAPZB | HTA11_83_2000001011 | Human | Colorectum | SER | 7.23e-18 | 1.05e+00 | -0.1526 |
| 832 | CAPZB | HTA11_696_2000001011 | Human | Colorectum | AD | 8.95e-35 | 1.21e+00 | -0.1464 |
| 832 | CAPZB | HTA11_866_2000001011 | Human | Colorectum | AD | 1.91e-15 | 7.66e-01 | -0.1001 |
| 832 | CAPZB | HTA11_1391_2000001011 | Human | Colorectum | AD | 5.73e-22 | 1.26e+00 | -0.059 |
| 832 | CAPZB | HTA11_2992_2000001011 | Human | Colorectum | SER | 2.95e-09 | 9.79e-01 | -0.1706 |
| 832 | CAPZB | HTA11_5212_2000001011 | Human | Colorectum | AD | 1.47e-04 | 7.70e-01 | -0.2061 |
| 832 | CAPZB | HTA11_5216_2000001011 | Human | Colorectum | SER | 5.75e-05 | 7.95e-01 | -0.1462 |
| Page: 1 2 3 4 5 6 7 8 9 10 11 12 13 |
| Tissue | Expression Dynamics | Abbreviation |
| Cervix | 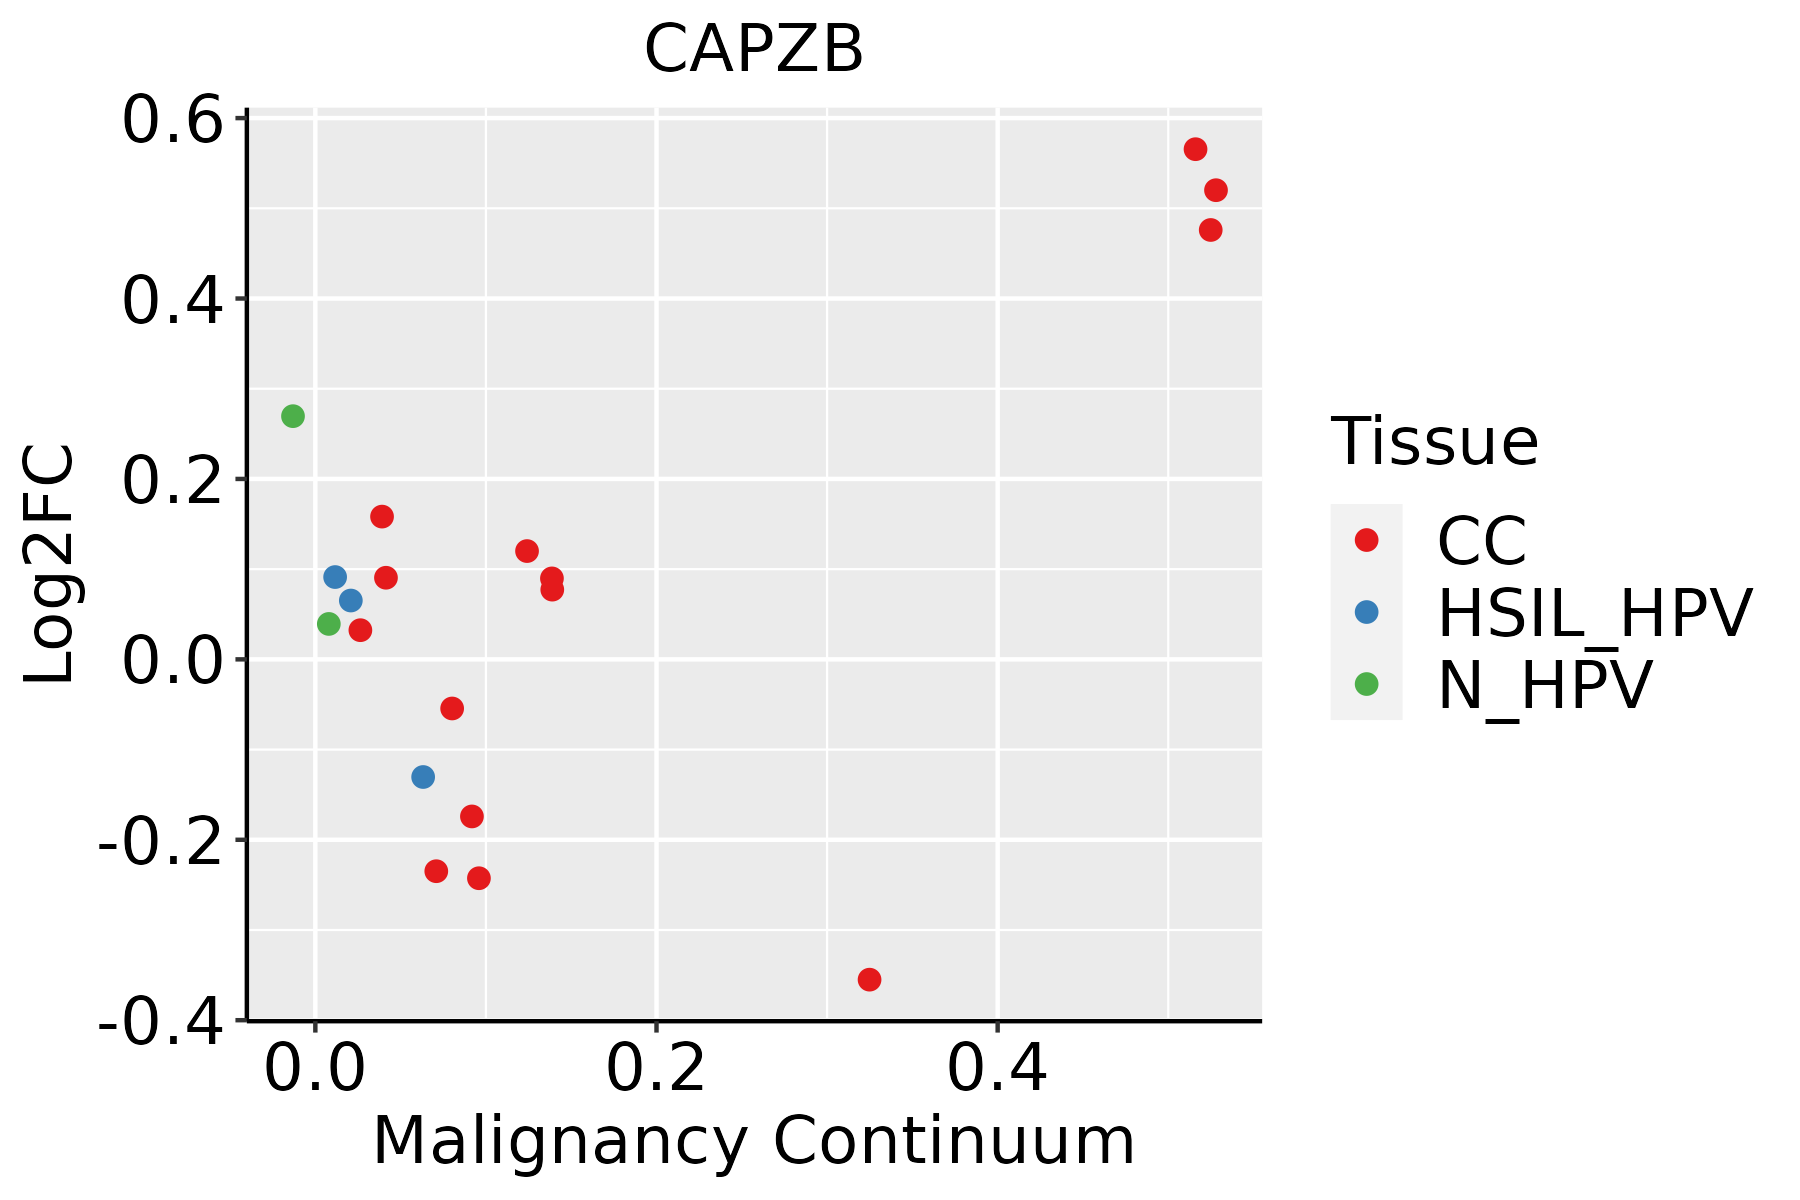 | CC: Cervix cancer |
| HSIL_HPV: HPV-infected high-grade squamous intraepithelial lesions | ||
| N_HPV: HPV-infected normal cervix | ||
| Colorectum (GSE201348) |  | FAP: Familial adenomatous polyposis |
| CRC: Colorectal cancer | ||
| Colorectum (HTA11) |  | AD: Adenomas |
| SER: Sessile serrated lesions | ||
| MSI-H: Microsatellite-high colorectal cancer | ||
| MSS: Microsatellite stable colorectal cancer | ||
| Endometrium |  | AEH: Atypical endometrial hyperplasia |
| EEC: Endometrioid Cancer | ||
| Esophagus |  | ESCC: Esophageal squamous cell carcinoma |
| HGIN: High-grade intraepithelial neoplasias | ||
| LGIN: Low-grade intraepithelial neoplasias | ||
| GC | 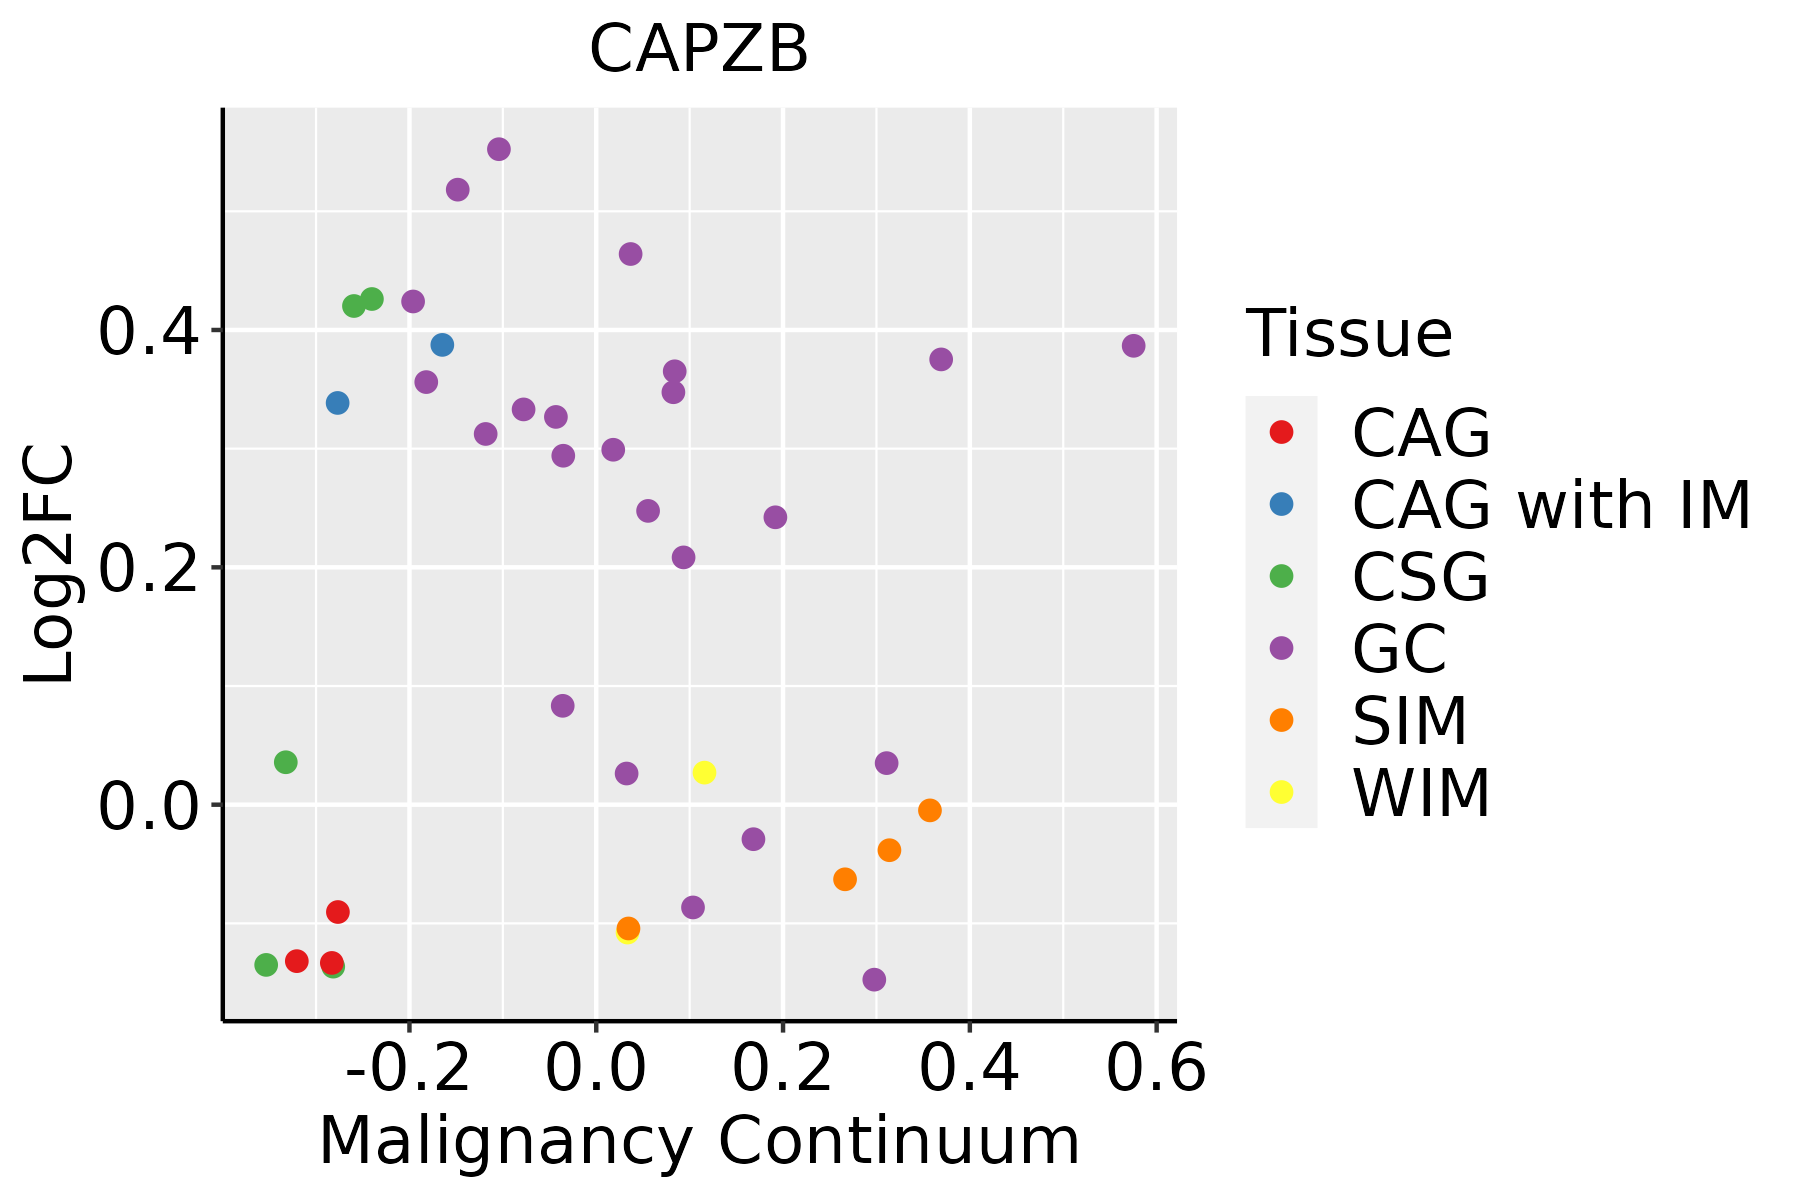 | CAG: Chronic atrophic gastritis |
| CAG with IM: Chronic atrophic gastritis with intestinal metaplasia | ||
| CSG: Chronic superficial gastritis | ||
| GC: Gastric cancer | ||
| SIM: Severe intestinal metaplasia | ||
| WIM: Wild intestinal metaplasia | ||
| Liver | 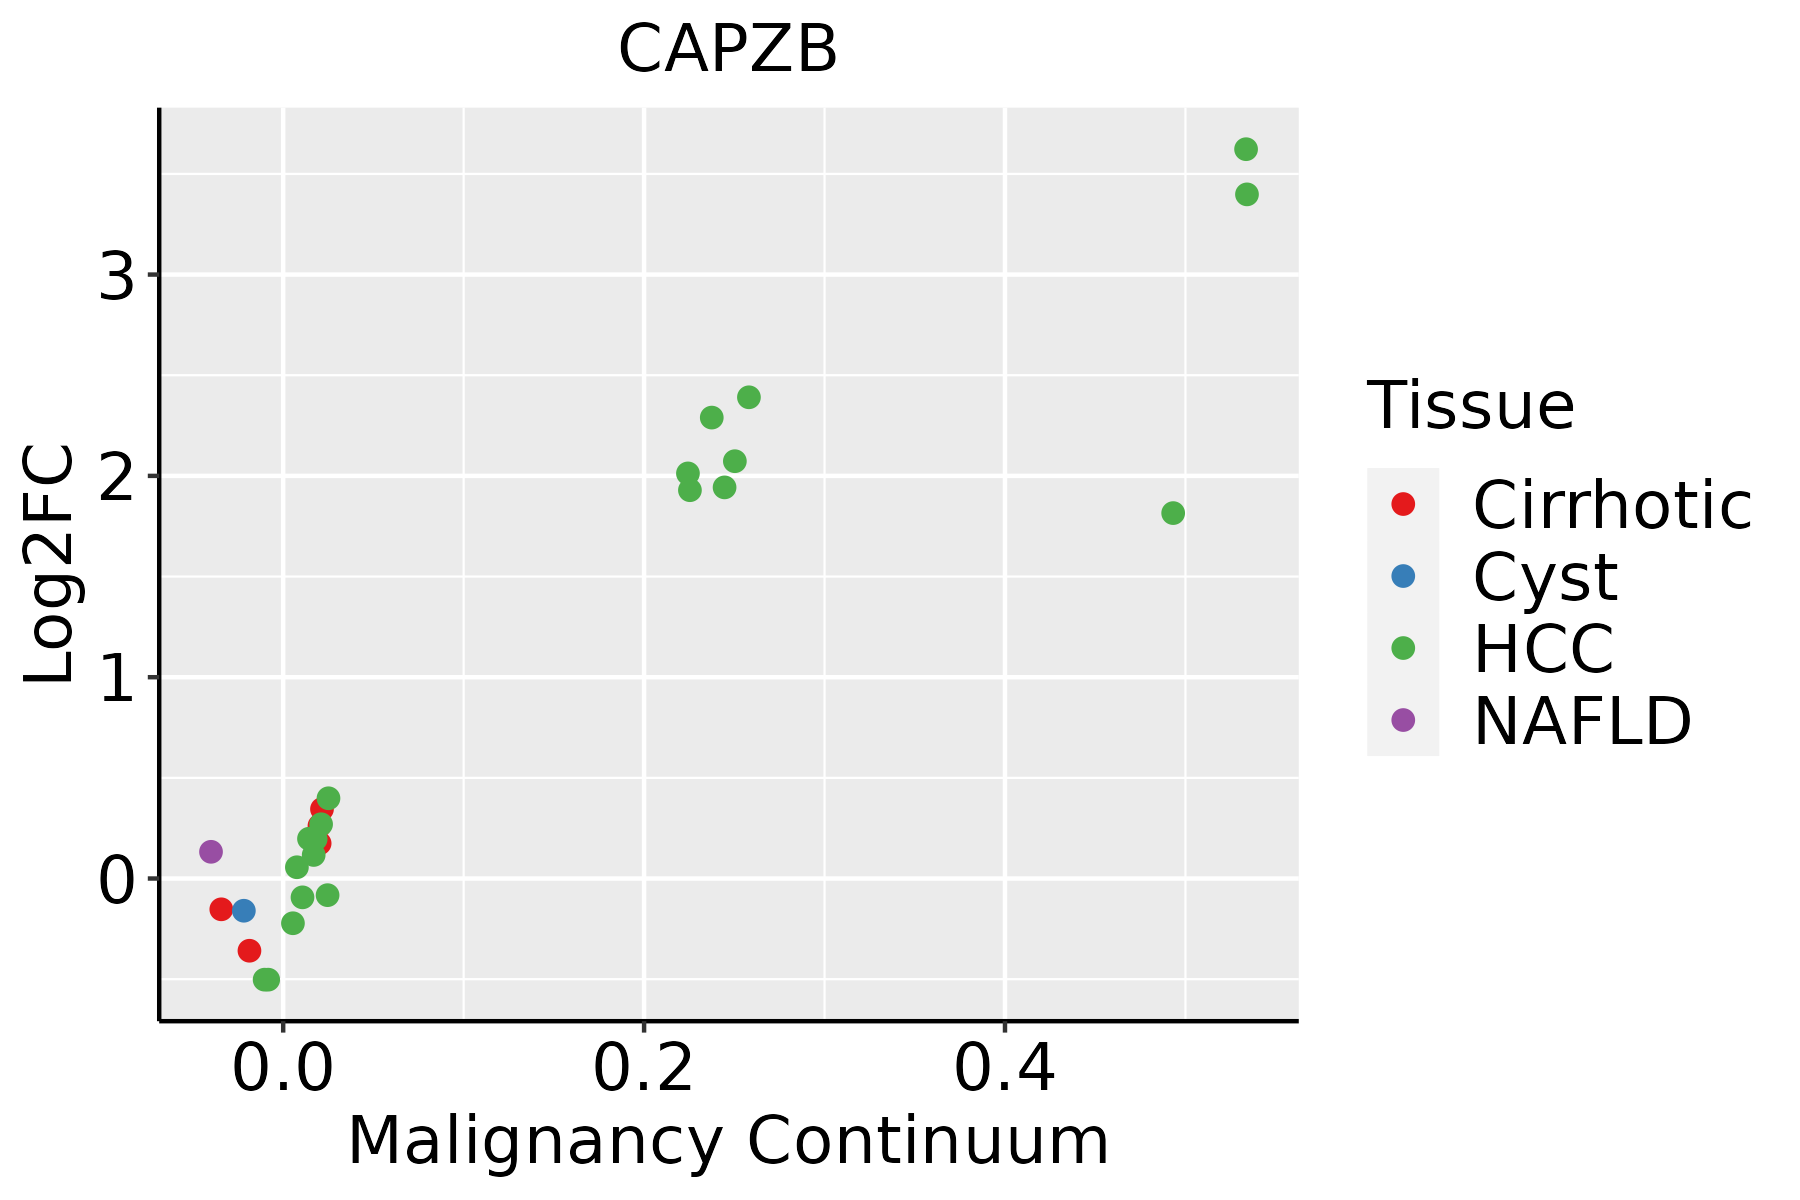 | HCC: Hepatocellular carcinoma |
| NAFLD: Non-alcoholic fatty liver disease | ||
| Oral Cavity |  | EOLP: Erosive Oral lichen planus |
| LP: leukoplakia | ||
| NEOLP: Non-erosive oral lichen planus | ||
| OSCC: Oral squamous cell carcinoma | ||
| Prostate | 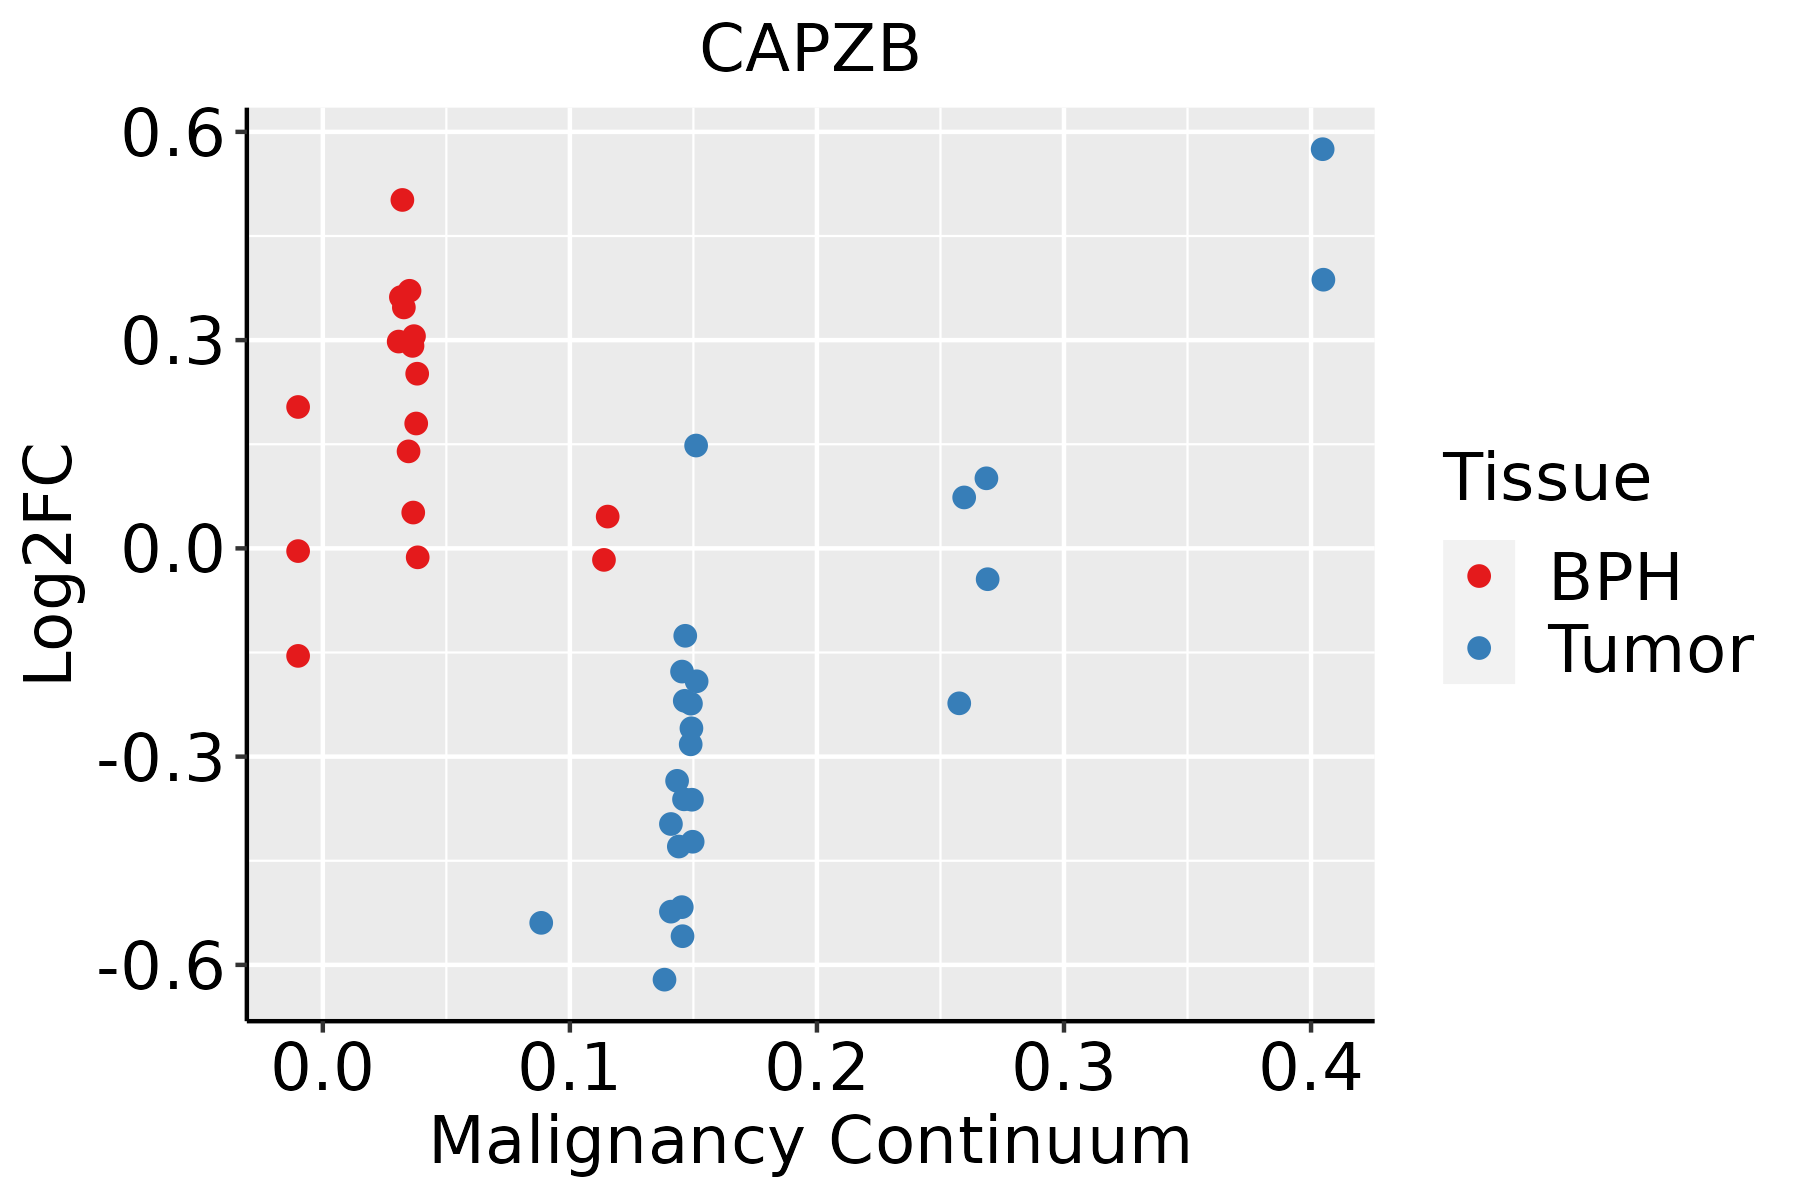 | BPH: Benign Prostatic Hyperplasia |
| Skin |  | AK: Actinic keratosis |
| cSCC: Cutaneous squamous cell carcinoma | ||
| SCCIS:squamous cell carcinoma in situ | ||
| Thyroid | 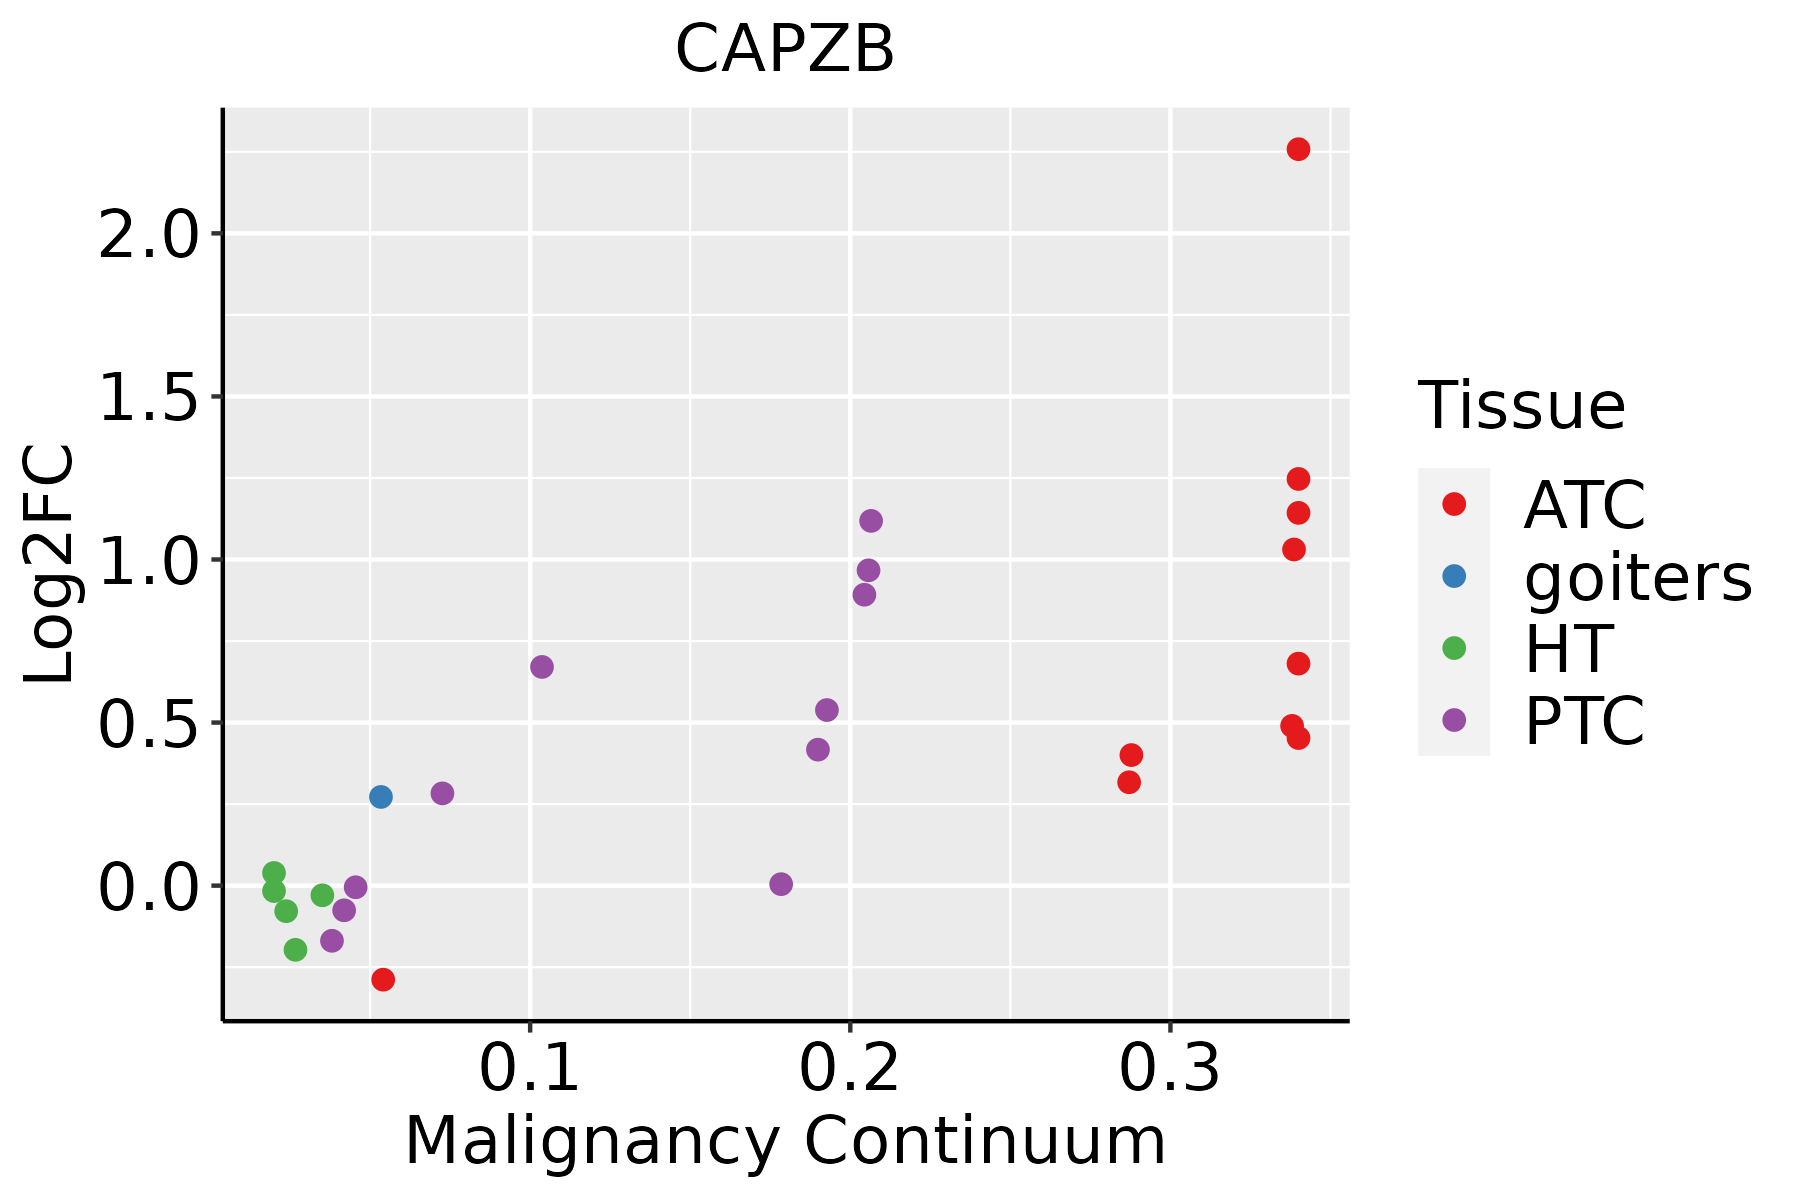 | ATC: Anaplastic thyroid cancer |
| HT: Hashimoto's thyroiditis | ||
| PTC: Papillary thyroid cancer |
| ∗log2FC in expression of this searched gene in stem-like cells from each diseased tissue sample relative to stem-like cells in normal samples in each tissue plotted against the malignancy continuum. Samples are colored based on if they are from different disease stage. |
Top |
Malignant transformation related pathway analysis |
| Find out the enriched GO biological processes and KEGG pathways involved in transition from healthy to precancer to cancer |
| Tissue | Disease Stage | Enriched GO biological Processes |
| Colorectum | AD |  |
| Colorectum | SER |  |
| Colorectum | MSS |  |
| Colorectum | MSI-H |  |
| Colorectum | FAP |  |
| ∗Top 15 enriched GO BP terms are showed in the bar plot of each disease state in each tissue. Each row represents a significant GO biological process which is colored according to the -log10(p.adjust). |
| Page: 1 2 3 4 5 6 7 8 9 |
| GO ID | Tissue | Disease Stage | Description | Gene Ratio | Bg Ratio | pvalue | p.adjust | Count |
| GO:000701510 | Cervix | CC | actin filament organization | 109/2311 | 442/18723 | 4.92e-13 | 2.45e-10 | 109 |
| GO:002260410 | Cervix | CC | regulation of cell morphogenesis | 84/2311 | 309/18723 | 1.00e-12 | 4.29e-10 | 84 |
| GO:003297010 | Cervix | CC | regulation of actin filament-based process | 96/2311 | 397/18723 | 4.00e-11 | 8.54e-09 | 96 |
| GO:190290310 | Cervix | CC | regulation of supramolecular fiber organization | 92/2311 | 383/18723 | 1.49e-10 | 2.48e-08 | 92 |
| GO:003295610 | Cervix | CC | regulation of actin cytoskeleton organization | 86/2311 | 358/18723 | 5.90e-10 | 7.51e-08 | 86 |
| GO:004325410 | Cervix | CC | regulation of protein-containing complex assembly | 96/2311 | 428/18723 | 2.91e-09 | 3.05e-07 | 96 |
| GO:011005310 | Cervix | CC | regulation of actin filament organization | 67/2311 | 278/18723 | 4.01e-08 | 2.54e-06 | 67 |
| GO:00975817 | Cervix | CC | lamellipodium organization | 31/2311 | 90/18723 | 4.57e-08 | 2.76e-06 | 31 |
| GO:005125810 | Cervix | CC | protein polymerization | 70/2311 | 297/18723 | 5.20e-08 | 3.11e-06 | 70 |
| GO:00300325 | Cervix | CC | lamellipodium assembly | 26/2311 | 72/18723 | 1.87e-07 | 8.48e-06 | 26 |
| GO:003227110 | Cervix | CC | regulation of protein polymerization | 57/2311 | 233/18723 | 2.37e-07 | 1.03e-05 | 57 |
| GO:00081549 | Cervix | CC | actin polymerization or depolymerization | 51/2311 | 218/18723 | 4.05e-06 | 1.05e-04 | 51 |
| GO:00300419 | Cervix | CC | actin filament polymerization | 45/2311 | 191/18723 | 1.20e-05 | 2.54e-04 | 45 |
| GO:19027437 | Cervix | CC | regulation of lamellipodium organization | 19/2311 | 54/18723 | 1.27e-05 | 2.60e-04 | 19 |
| GO:00325359 | Cervix | CC | regulation of cellular component size | 76/2311 | 383/18723 | 1.66e-05 | 3.21e-04 | 76 |
| GO:19029048 | Cervix | CC | negative regulation of supramolecular fiber organization | 40/2311 | 167/18723 | 2.39e-05 | 4.17e-04 | 40 |
| GO:00313339 | Cervix | CC | negative regulation of protein-containing complex assembly | 35/2311 | 141/18723 | 3.41e-05 | 5.55e-04 | 35 |
| GO:00308339 | Cervix | CC | regulation of actin filament polymerization | 40/2311 | 172/18723 | 4.90e-05 | 7.40e-04 | 40 |
| GO:002241110 | Cervix | CC | cellular component disassembly | 83/2311 | 443/18723 | 6.04e-05 | 8.68e-04 | 83 |
| GO:00106399 | Cervix | CC | negative regulation of organelle organization | 68/2311 | 348/18723 | 7.40e-05 | 1.03e-03 | 68 |
| Page: 1 2 3 4 5 6 7 8 9 10 11 12 13 14 15 16 17 18 19 20 21 22 23 24 25 26 27 28 29 30 31 32 33 34 35 36 37 38 39 |
| Pathway ID | Tissue | Disease Stage | Description | Gene Ratio | Bg Ratio | pvalue | p.adjust | qvalue | Count |
| hsa0414418 | Cervix | CC | Endocytosis | 64/1267 | 251/8465 | 6.97e-06 | 6.10e-05 | 3.61e-05 | 64 |
| hsa0414419 | Cervix | CC | Endocytosis | 64/1267 | 251/8465 | 6.97e-06 | 6.10e-05 | 3.61e-05 | 64 |
| hsa04144 | Colorectum | AD | Endocytosis | 111/2092 | 251/8465 | 5.95e-12 | 1.42e-10 | 9.08e-11 | 111 |
| hsa041441 | Colorectum | AD | Endocytosis | 111/2092 | 251/8465 | 5.95e-12 | 1.42e-10 | 9.08e-11 | 111 |
| hsa041442 | Colorectum | SER | Endocytosis | 81/1580 | 251/8465 | 1.14e-07 | 2.36e-06 | 1.71e-06 | 81 |
| hsa041443 | Colorectum | SER | Endocytosis | 81/1580 | 251/8465 | 1.14e-07 | 2.36e-06 | 1.71e-06 | 81 |
| hsa041444 | Colorectum | MSS | Endocytosis | 102/1875 | 251/8465 | 1.85e-11 | 4.43e-10 | 2.71e-10 | 102 |
| hsa041445 | Colorectum | MSS | Endocytosis | 102/1875 | 251/8465 | 1.85e-11 | 4.43e-10 | 2.71e-10 | 102 |
| hsa041446 | Colorectum | FAP | Endocytosis | 78/1404 | 251/8465 | 6.20e-09 | 2.96e-07 | 1.80e-07 | 78 |
| hsa041447 | Colorectum | FAP | Endocytosis | 78/1404 | 251/8465 | 6.20e-09 | 2.96e-07 | 1.80e-07 | 78 |
| hsa041448 | Colorectum | CRC | Endocytosis | 65/1091 | 251/8465 | 1.27e-08 | 1.06e-06 | 7.19e-07 | 65 |
| hsa041449 | Colorectum | CRC | Endocytosis | 65/1091 | 251/8465 | 1.27e-08 | 1.06e-06 | 7.19e-07 | 65 |
| hsa0414420 | Endometrium | AEH | Endocytosis | 56/1197 | 251/8465 | 2.58e-04 | 2.15e-03 | 1.57e-03 | 56 |
| hsa048144 | Endometrium | AEH | Motor proteins | 42/1197 | 193/8465 | 2.41e-03 | 1.42e-02 | 1.04e-02 | 42 |
| hsa04144110 | Endometrium | AEH | Endocytosis | 56/1197 | 251/8465 | 2.58e-04 | 2.15e-03 | 1.57e-03 | 56 |
| hsa0481411 | Endometrium | AEH | Motor proteins | 42/1197 | 193/8465 | 2.41e-03 | 1.42e-02 | 1.04e-02 | 42 |
| hsa0414424 | Endometrium | EEC | Endocytosis | 57/1237 | 251/8465 | 3.34e-04 | 2.82e-03 | 2.10e-03 | 57 |
| hsa048142 | Endometrium | EEC | Motor proteins | 42/1237 | 193/8465 | 4.43e-03 | 2.39e-02 | 1.78e-02 | 42 |
| hsa0414434 | Endometrium | EEC | Endocytosis | 57/1237 | 251/8465 | 3.34e-04 | 2.82e-03 | 2.10e-03 | 57 |
| hsa048143 | Endometrium | EEC | Motor proteins | 42/1237 | 193/8465 | 4.43e-03 | 2.39e-02 | 1.78e-02 | 42 |
| Page: 1 2 3 |
Top |
Cell-cell communication analysis |
| Identification of potential cell-cell interactions between two cell types and their ligand-receptor pairs for different disease states |
| Ligand | Receptor | LRpair | Pathway | Tissue | Disease Stage |
| Page: 1 |
Top |
Single-cell gene regulatory network inference analysis |
| Find out the significant the regulons (TFs) and the target genes of each regulon across cell types for different disease states |
| TF | Cell Type | Tissue | Disease Stage | Target Gene | RSS | Regulon Activity |
| ∗The dot plots of a searched regulon are shown for all cell subpopulations in each disease state of each tissue based on the regulon specific score inferred using pySCENIC and by calculating the average expression. |
| Page: 1 |
Top |
Somatic mutation of malignant transformation related genes |
| Annotation of somatic variants for genes involved in malignant transformation |
| Hugo Symbol | Variant Class | Variant Classification | dbSNP RS | HGVSc | HGVSp | HGVSp Short | SWISSPROT | BIOTYPE | SIFT | PolyPhen | Tumor Sample Barcode | Tissue | Histology | Sex | Age | Stage | Therapy Types | Drugs | Outcome |
| CAPZB | SNV | Missense_Mutation | c.648G>A | p.Met216Ile | p.M216I | protein_coding | tolerated(0.15) | benign(0.01) | TCGA-AC-A23H-01 | Breast | breast invasive carcinoma | Female | >=65 | I/II | Unknown | Unknown | PD | ||
| CAPZB | insertion | Frame_Shift_Ins | novel | c.575_576insGAGCCTTGGAAAAACGCCTGTGCTTGTTTGGATGGGAGGCGAA | p.Thr193SerfsTer52 | p.T193Sfs*52 | protein_coding | TCGA-A8-A09K-01 | Breast | breast invasive carcinoma | Female | >=65 | I/II | Unknown | Unknown | SD | |||
| CAPZB | insertion | Nonsense_Mutation | novel | c.4_5insTCAAAGTGTTTTGAGGACCATGGTTCCTTGTTTAGTCAAGGG | p.His2delinsLeuLysValPheTerGlyProTrpPheLeuValTerSerArgAsp | p.H2delinsLKVF*GPWFLV*SRD | protein_coding | TCGA-BH-A0H7-01 | Breast | breast invasive carcinoma | Female | >=65 | III/IV | Chemotherapy | doxorubicin | SD | |||
| CAPZB | SNV | Missense_Mutation | rs377121153 | c.574N>T | p.Arg192Cys | p.R192C | protein_coding | deleterious(0) | possibly_damaging(0.854) | TCGA-IR-A3LA-01 | Cervix | cervical & endocervical cancer | Female | <65 | I/II | Chemotherapy | cisplatin | CR | |
| CAPZB | SNV | Missense_Mutation | novel | c.151N>A | p.Glu51Lys | p.E51K | protein_coding | tolerated(0.13) | probably_damaging(0.999) | TCGA-VS-A9UD-01 | Cervix | cervical & endocervical cancer | Female | >=65 | III/IV | Chemotherapy | cisplatin | CR | |
| CAPZB | SNV | Missense_Mutation | novel | c.170N>C | p.Leu57Pro | p.L57P | protein_coding | deleterious(0) | probably_damaging(0.991) | TCGA-5M-AAT6-01 | Colorectum | colon adenocarcinoma | Female | <65 | III/IV | Unknown | Unknown | PD | |
| CAPZB | SNV | Missense_Mutation | rs766056741 | c.844T>G | p.Ser282Ala | p.S282A | protein_coding | tolerated(0.59) | benign(0) | TCGA-AA-3510-01 | Colorectum | colon adenocarcinoma | Male | >=65 | I/II | Unknown | Unknown | SD | |
| CAPZB | SNV | Missense_Mutation | rs770183245 | c.433N>A | p.Val145Ile | p.V145I | protein_coding | tolerated(0.55) | probably_damaging(0.995) | TCGA-AA-3672-01 | Colorectum | colon adenocarcinoma | Female | >=65 | III/IV | Unknown | Unknown | SD | |
| CAPZB | SNV | Missense_Mutation | novel | c.158N>G | p.Asn53Ser | p.N53S | protein_coding | deleterious(0.02) | benign(0.443) | TCGA-AA-3815-01 | Colorectum | colon adenocarcinoma | Female | >=65 | I/II | Unknown | Unknown | SD | |
| CAPZB | SNV | Missense_Mutation | c.754A>G | p.Lys252Glu | p.K252E | protein_coding | deleterious(0.03) | possibly_damaging(0.654) | TCGA-AZ-4315-01 | Colorectum | colon adenocarcinoma | Male | <65 | I/II | Unknown | Unknown | SD |
| Page: 1 2 3 4 |
Top |
Related drugs of malignant transformation related genes |
| Identification of chemicals and drugs interact with genes involved in malignant transfromation |
| (DGIdb 4.0) |
| Entrez ID | Symbol | Category | Interaction Types | Drug Claim Name | Drug Name | PMIDs |
| Page: 1 |

Copyright 2023-Present -The University of Texas Health Science Center at Houston |