
|
|||||
|
 | |
| |
| |
| |
| |
| |
|
Gene: CAPZA2 |
Gene summary for CAPZA2 |
| Gene information | Species | Human | Gene symbol | CAPZA2 | Gene ID | 830 |
| Gene name | capping actin protein of muscle Z-line subunit alpha 2 | |
| Gene Alias | CAPPA2 | |
| Cytomap | 7q31.2 | |
| Gene Type | protein-coding | GO ID | GO:0006996 | UniProtAcc | A4D0V4 |
Top |
Malignant transformation analysis |
| Identification of the aberrant gene expression in precancerous and cancerous lesions by comparing the gene expression of stem-like cells in diseased tissues with normal stem cells |
| Entrez ID | Symbol | Replicates | Species | Organ | Tissue | Adj P-value | Log2FC | Malignancy |
| 830 | CAPZA2 | AEH-subject3 | Human | Endometrium | AEH | 4.49e-03 | -1.90e-01 | -0.2576 |
| 830 | CAPZA2 | EEC-subject1 | Human | Endometrium | EEC | 9.36e-04 | -1.13e-01 | -0.2682 |
| 830 | CAPZA2 | EEC-subject3 | Human | Endometrium | EEC | 1.98e-15 | -1.80e-01 | -0.2525 |
| 830 | CAPZA2 | EEC-subject4 | Human | Endometrium | EEC | 1.14e-02 | -1.98e-01 | -0.2571 |
| 830 | CAPZA2 | GSM6177620_NYU_UCEC1_lib1_lib1 | Human | Endometrium | EEC | 2.48e-18 | -1.90e-01 | -0.1869 |
| 830 | CAPZA2 | GSM6177620_NYU_UCEC1_lib2_lib2 | Human | Endometrium | EEC | 1.48e-16 | -2.13e-01 | -0.1875 |
| 830 | CAPZA2 | GSM6177620_NYU_UCEC1_lib3_lib3 | Human | Endometrium | EEC | 9.25e-20 | -1.46e-01 | -0.1883 |
| 830 | CAPZA2 | GSM6177621_NYU_UCEC2_lib1_lib1 | Human | Endometrium | EEC | 4.14e-23 | -2.46e-01 | -0.1934 |
| 830 | CAPZA2 | GSM6177622_NYU_UCEC3_lib1_lib1 | Human | Endometrium | EEC | 2.48e-32 | 3.26e-02 | -0.1917 |
| 830 | CAPZA2 | GSM6177622_NYU_UCEC3_lib2_lib2 | Human | Endometrium | EEC | 4.77e-34 | 5.83e-02 | -0.1916 |
| 830 | CAPZA2 | LZE2T | Human | Esophagus | ESCC | 3.67e-02 | 1.73e-01 | 0.082 |
| 830 | CAPZA2 | LZE3D | Human | Esophagus | HGIN | 1.41e-03 | 6.34e-01 | 0.0668 |
| 830 | CAPZA2 | LZE4T | Human | Esophagus | ESCC | 2.01e-15 | 6.55e-01 | 0.0811 |
| 830 | CAPZA2 | LZE7T | Human | Esophagus | ESCC | 1.19e-02 | 7.18e-01 | 0.0667 |
| 830 | CAPZA2 | LZE8T | Human | Esophagus | ESCC | 1.30e-16 | 7.20e-01 | 0.067 |
| 830 | CAPZA2 | LZE20T | Human | Esophagus | ESCC | 3.98e-08 | 4.64e-01 | 0.0662 |
| 830 | CAPZA2 | LZE22T | Human | Esophagus | ESCC | 4.69e-02 | 7.58e-01 | 0.068 |
| 830 | CAPZA2 | LZE24T | Human | Esophagus | ESCC | 3.66e-19 | 8.47e-01 | 0.0596 |
| 830 | CAPZA2 | LZE21T | Human | Esophagus | ESCC | 1.26e-05 | 3.65e-01 | 0.0655 |
| 830 | CAPZA2 | LZE6T | Human | Esophagus | ESCC | 1.88e-04 | 6.52e-01 | 0.0845 |
| Page: 1 2 3 4 5 6 7 8 9 |
| Tissue | Expression Dynamics | Abbreviation |
| Endometrium | 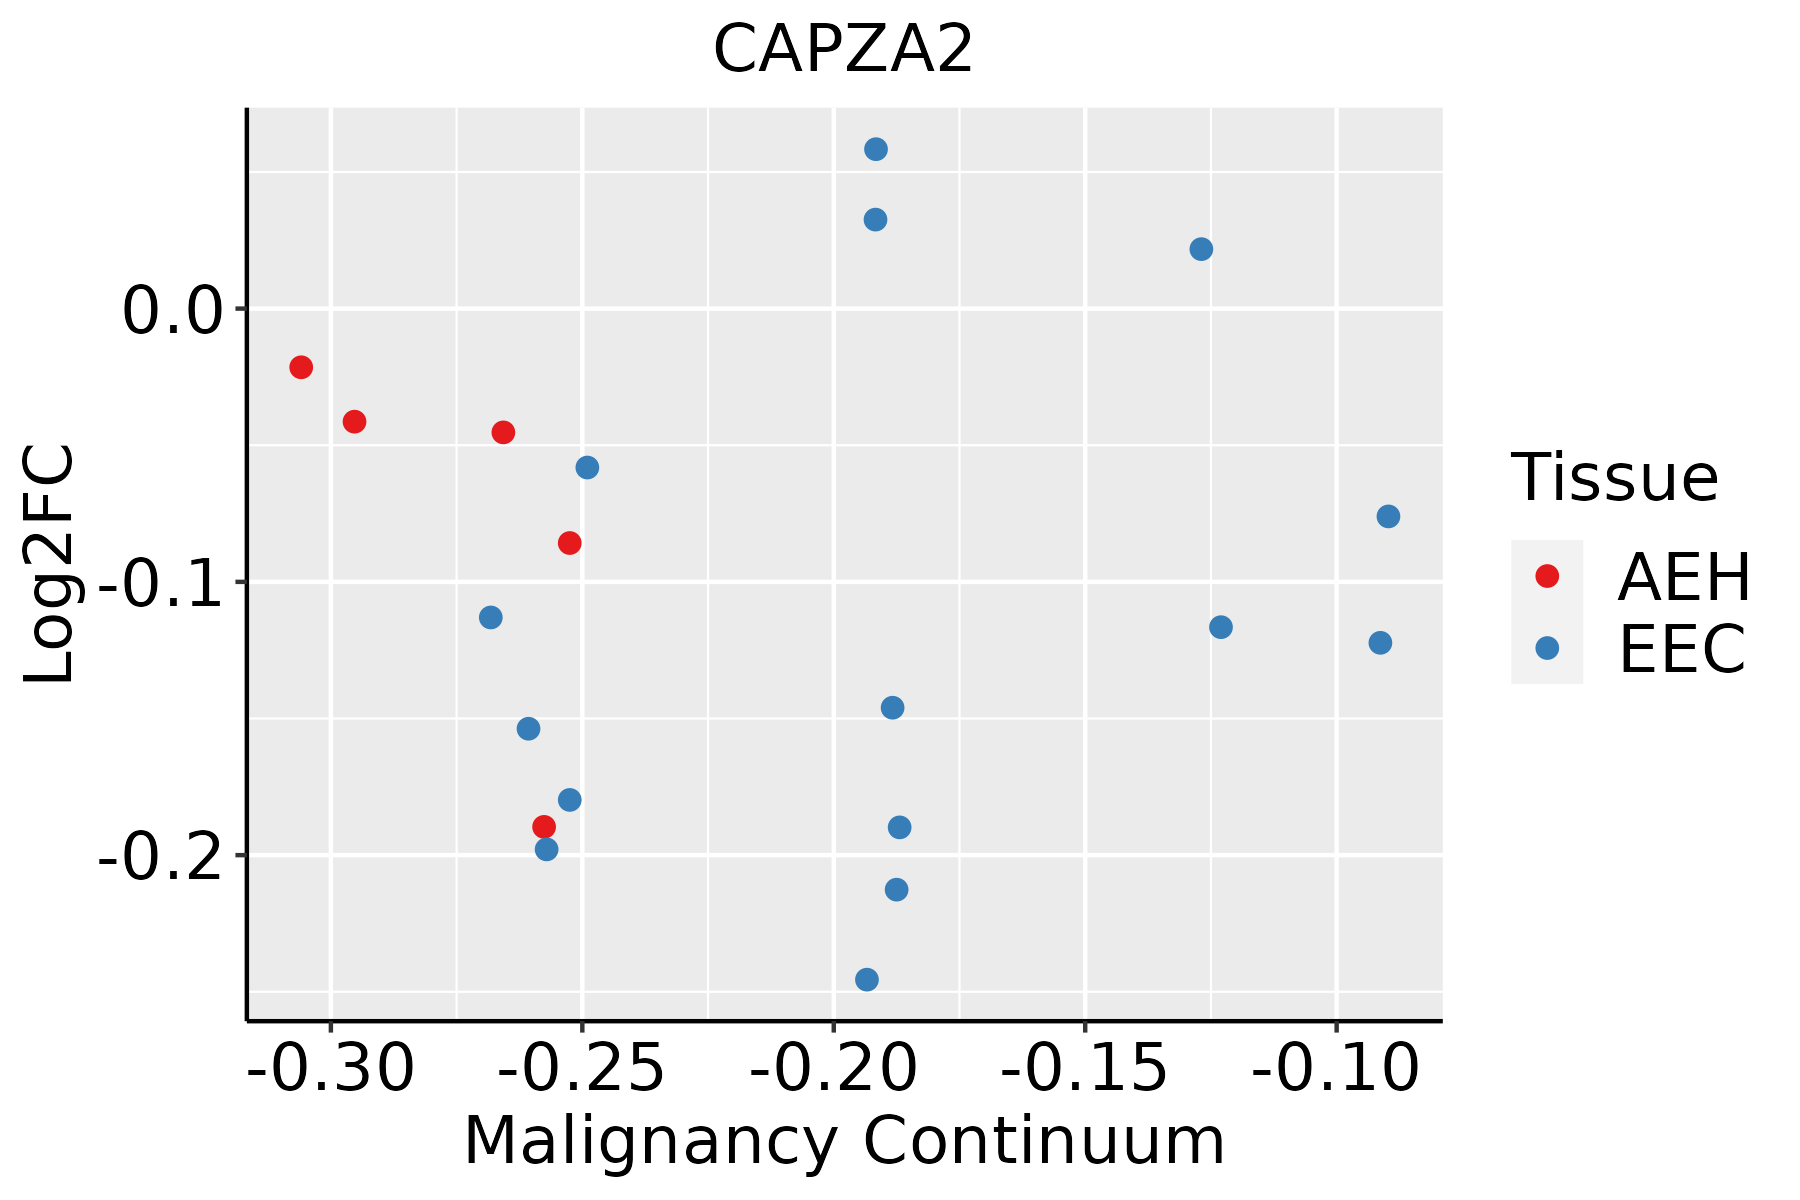 | AEH: Atypical endometrial hyperplasia |
| EEC: Endometrioid Cancer | ||
| Esophagus | 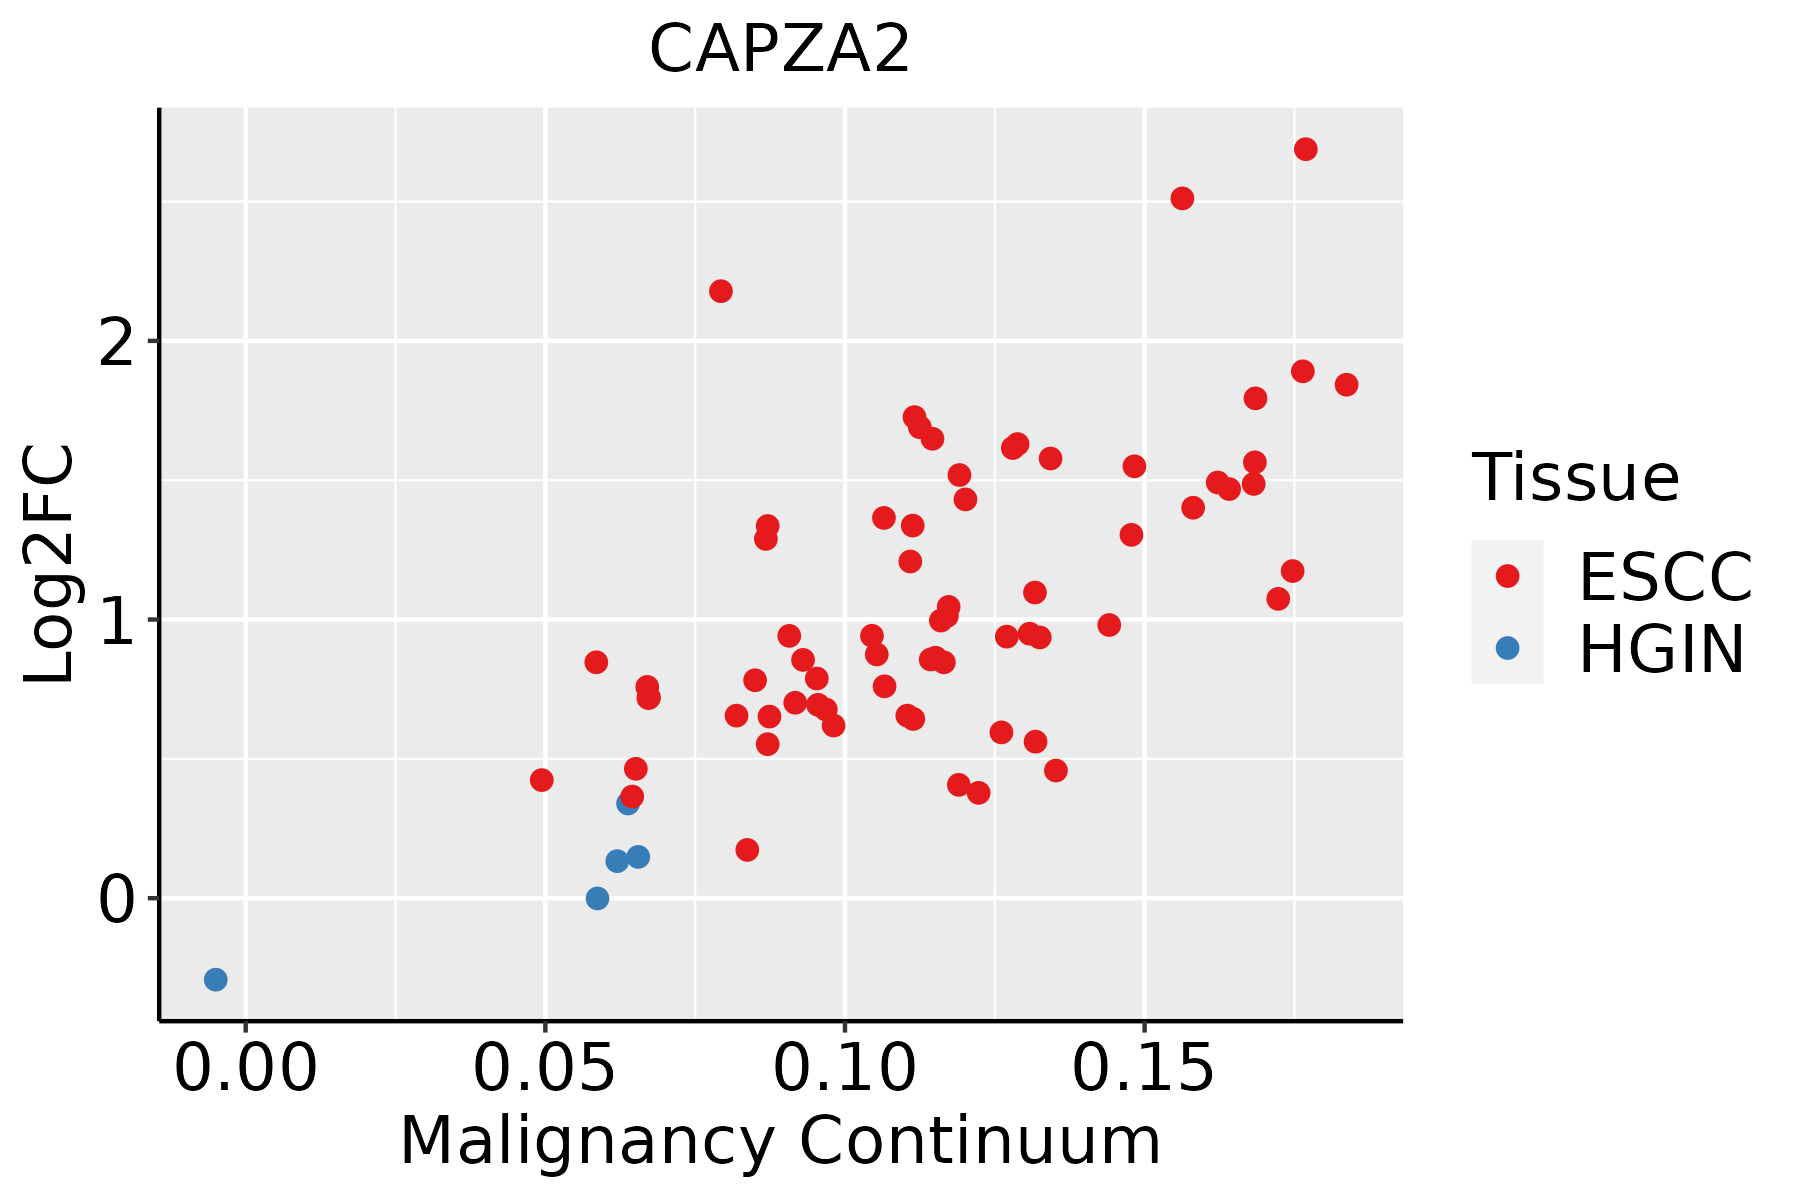 | ESCC: Esophageal squamous cell carcinoma |
| HGIN: High-grade intraepithelial neoplasias | ||
| LGIN: Low-grade intraepithelial neoplasias | ||
| Liver |  | HCC: Hepatocellular carcinoma |
| NAFLD: Non-alcoholic fatty liver disease | ||
| Oral Cavity | 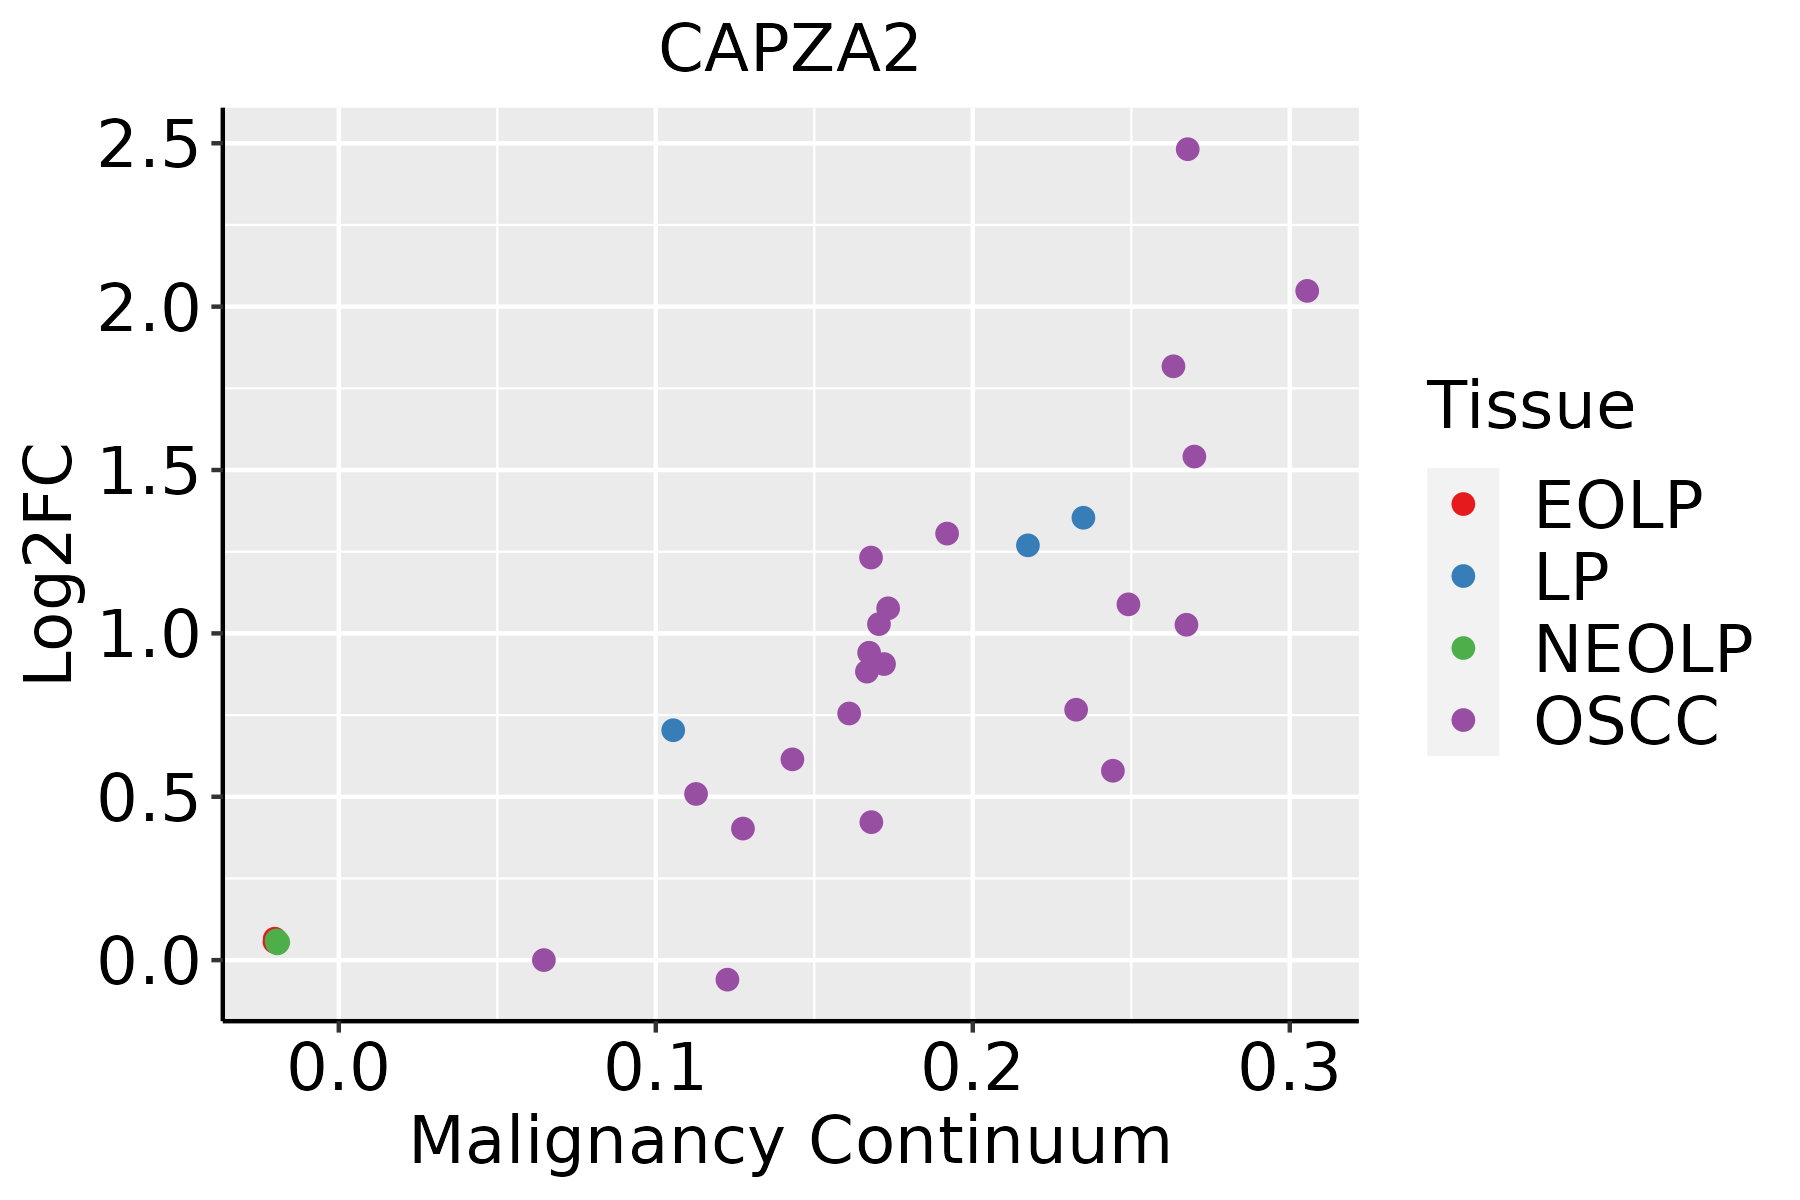 | EOLP: Erosive Oral lichen planus |
| LP: leukoplakia | ||
| NEOLP: Non-erosive oral lichen planus | ||
| OSCC: Oral squamous cell carcinoma | ||
| Prostate |  | BPH: Benign Prostatic Hyperplasia |
| Skin | 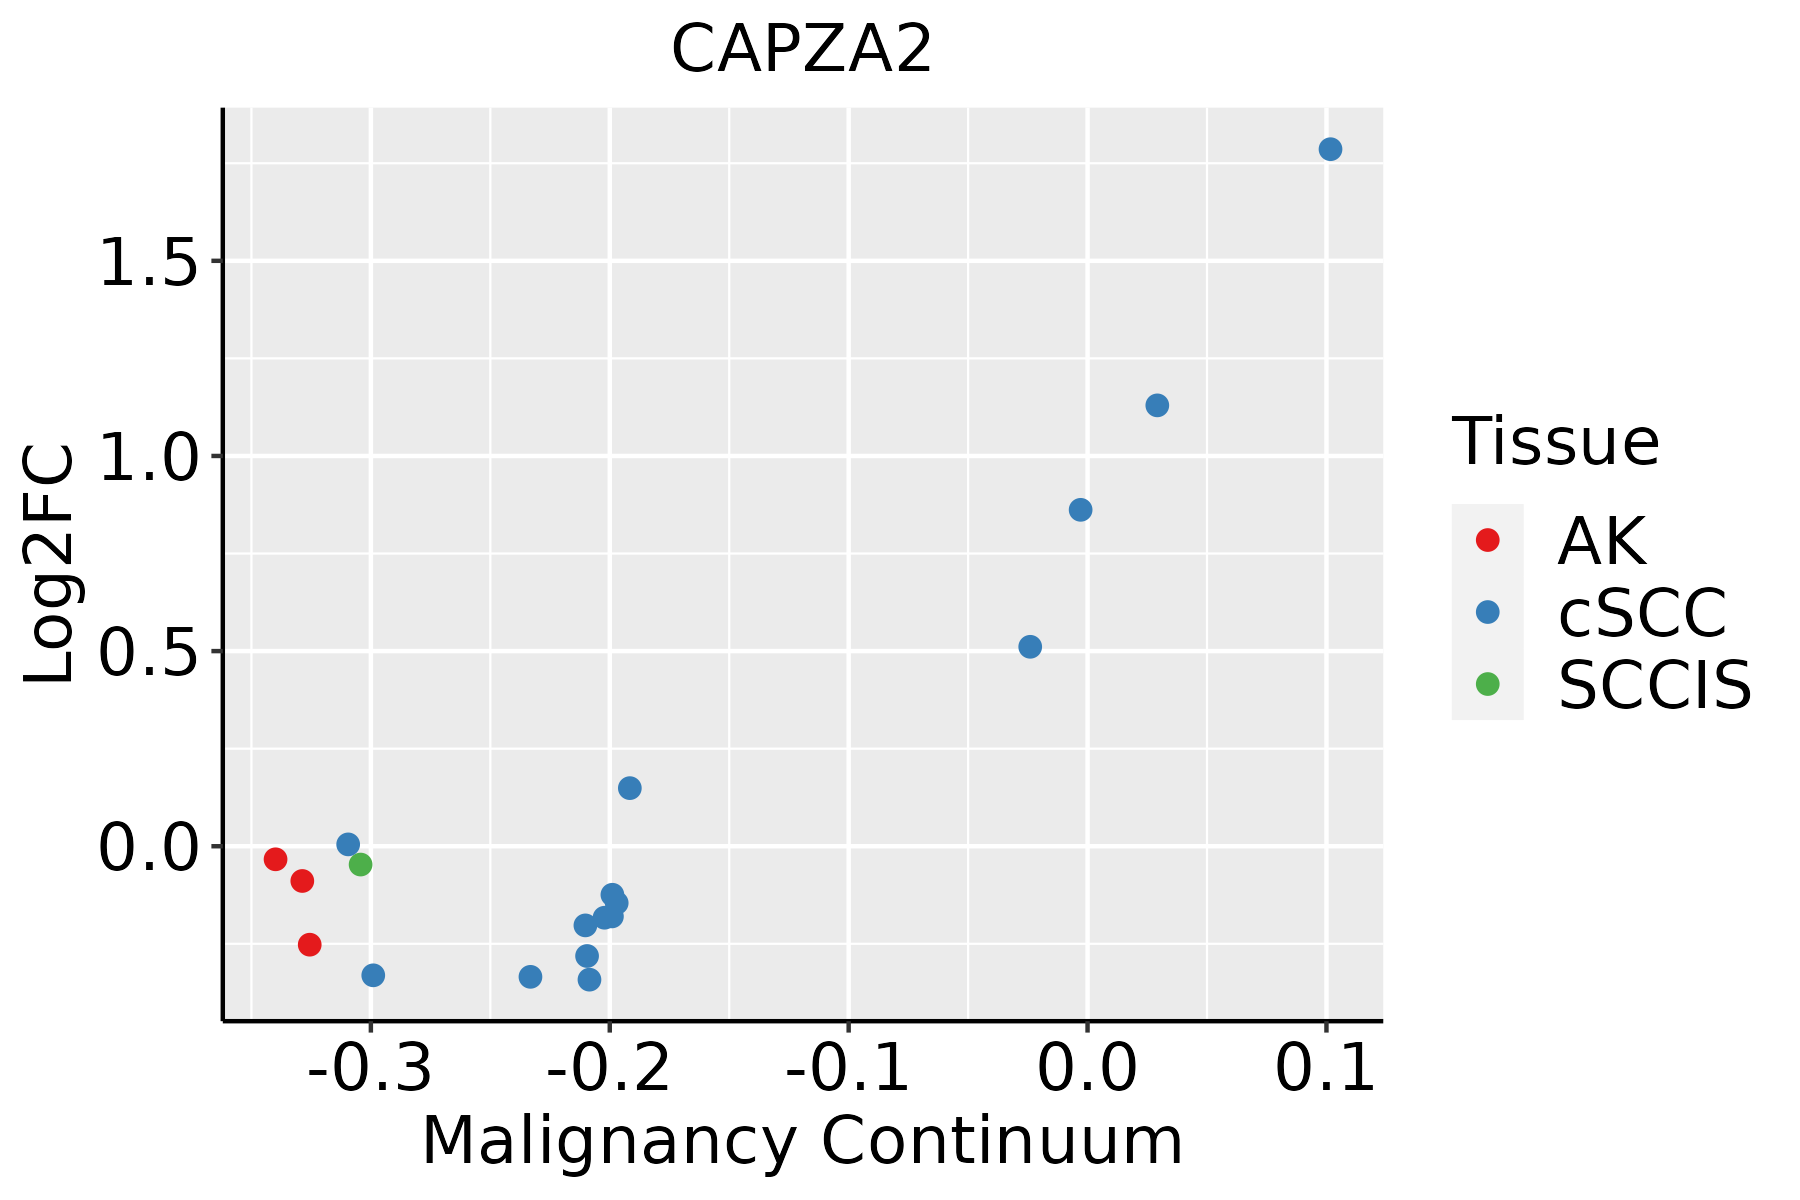 | AK: Actinic keratosis |
| cSCC: Cutaneous squamous cell carcinoma | ||
| SCCIS:squamous cell carcinoma in situ | ||
| Thyroid | 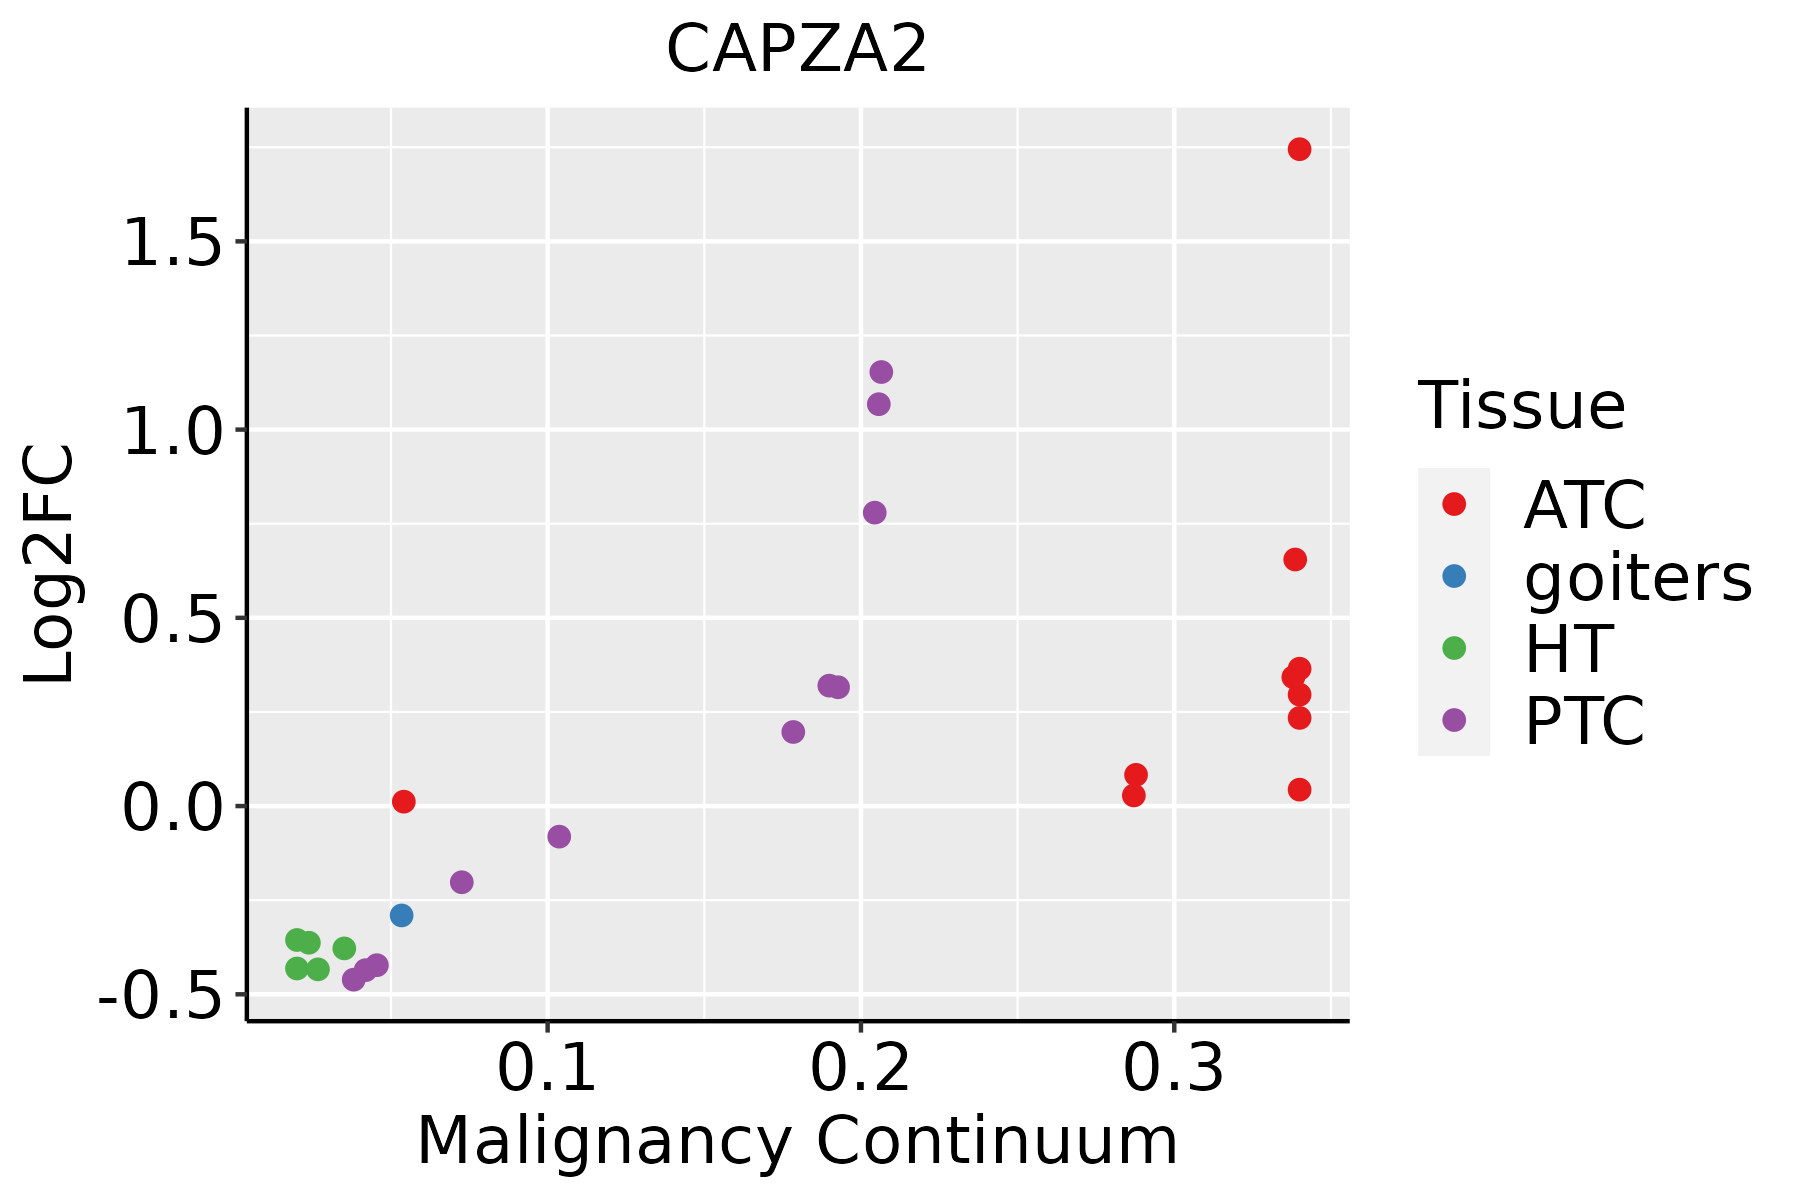 | ATC: Anaplastic thyroid cancer |
| HT: Hashimoto's thyroiditis | ||
| PTC: Papillary thyroid cancer |
| ∗log2FC in expression of this searched gene in stem-like cells from each diseased tissue sample relative to stem-like cells in normal samples in each tissue plotted against the malignancy continuum. Samples are colored based on if they are from different disease stage. |
Top |
Malignant transformation related pathway analysis |
| Find out the enriched GO biological processes and KEGG pathways involved in transition from healthy to precancer to cancer |
| Tissue | Disease Stage | Enriched GO biological Processes |
| Colorectum | AD |  |
| Colorectum | SER |  |
| Colorectum | MSS |  |
| Colorectum | MSI-H |  |
| Colorectum | FAP |  |
| ∗Top 15 enriched GO BP terms are showed in the bar plot of each disease state in each tissue. Each row represents a significant GO biological process which is colored according to the -log10(p.adjust). |
| Page: 1 2 3 4 5 6 7 8 9 |
| GO ID | Tissue | Disease Stage | Description | Gene Ratio | Bg Ratio | pvalue | p.adjust | Count |
| GO:000701516 | Endometrium | AEH | actin filament organization | 98/2100 | 442/18723 | 1.99e-11 | 2.98e-09 | 98 |
| GO:003297016 | Endometrium | AEH | regulation of actin filament-based process | 89/2100 | 397/18723 | 9.14e-11 | 1.10e-08 | 89 |
| GO:190290316 | Endometrium | AEH | regulation of supramolecular fiber organization | 83/2100 | 383/18723 | 2.20e-09 | 1.78e-07 | 83 |
| GO:003295616 | Endometrium | AEH | regulation of actin cytoskeleton organization | 77/2100 | 358/18723 | 1.18e-08 | 7.76e-07 | 77 |
| GO:003253510 | Endometrium | AEH | regulation of cellular component size | 78/2100 | 383/18723 | 1.10e-07 | 5.29e-06 | 78 |
| GO:011005316 | Endometrium | AEH | regulation of actin filament organization | 61/2100 | 278/18723 | 1.83e-07 | 8.11e-06 | 61 |
| GO:004325416 | Endometrium | AEH | regulation of protein-containing complex assembly | 83/2100 | 428/18723 | 3.90e-07 | 1.63e-05 | 83 |
| GO:005125816 | Endometrium | AEH | protein polymerization | 62/2100 | 297/18723 | 9.04e-07 | 3.19e-05 | 62 |
| GO:003227116 | Endometrium | AEH | regulation of protein polymerization | 50/2100 | 233/18723 | 4.43e-06 | 1.16e-04 | 50 |
| GO:19029049 | Endometrium | AEH | negative regulation of supramolecular fiber organization | 39/2100 | 167/18723 | 6.07e-06 | 1.50e-04 | 39 |
| GO:002241115 | Endometrium | AEH | cellular component disassembly | 80/2100 | 443/18723 | 1.07e-05 | 2.45e-04 | 80 |
| GO:00329848 | Endometrium | AEH | protein-containing complex disassembly | 45/2100 | 224/18723 | 7.16e-05 | 1.10e-03 | 45 |
| GO:003133310 | Endometrium | AEH | negative regulation of protein-containing complex assembly | 32/2100 | 141/18723 | 7.22e-05 | 1.10e-03 | 32 |
| GO:000815410 | Endometrium | AEH | actin polymerization or depolymerization | 44/2100 | 218/18723 | 7.64e-05 | 1.15e-03 | 44 |
| GO:003004110 | Endometrium | AEH | actin filament polymerization | 39/2100 | 191/18723 | 1.47e-04 | 1.96e-03 | 39 |
| GO:001063910 | Endometrium | AEH | negative regulation of organelle organization | 61/2100 | 348/18723 | 2.65e-04 | 3.09e-03 | 61 |
| GO:003083310 | Endometrium | AEH | regulation of actin filament polymerization | 35/2100 | 172/18723 | 3.36e-04 | 3.73e-03 | 35 |
| GO:000806410 | Endometrium | AEH | regulation of actin polymerization or depolymerization | 37/2100 | 188/18723 | 4.57e-04 | 4.80e-03 | 37 |
| GO:00308329 | Endometrium | AEH | regulation of actin filament length | 37/2100 | 189/18723 | 5.08e-04 | 5.18e-03 | 37 |
| GO:00514949 | Endometrium | AEH | negative regulation of cytoskeleton organization | 32/2100 | 163/18723 | 1.12e-03 | 9.74e-03 | 32 |
| Page: 1 2 3 4 5 6 7 8 9 10 11 12 13 14 15 16 17 |
| Pathway ID | Tissue | Disease Stage | Description | Gene Ratio | Bg Ratio | pvalue | p.adjust | qvalue | Count |
| hsa0414420 | Endometrium | AEH | Endocytosis | 56/1197 | 251/8465 | 2.58e-04 | 2.15e-03 | 1.57e-03 | 56 |
| hsa048144 | Endometrium | AEH | Motor proteins | 42/1197 | 193/8465 | 2.41e-03 | 1.42e-02 | 1.04e-02 | 42 |
| hsa04144110 | Endometrium | AEH | Endocytosis | 56/1197 | 251/8465 | 2.58e-04 | 2.15e-03 | 1.57e-03 | 56 |
| hsa0481411 | Endometrium | AEH | Motor proteins | 42/1197 | 193/8465 | 2.41e-03 | 1.42e-02 | 1.04e-02 | 42 |
| hsa0414424 | Endometrium | EEC | Endocytosis | 57/1237 | 251/8465 | 3.34e-04 | 2.82e-03 | 2.10e-03 | 57 |
| hsa048142 | Endometrium | EEC | Motor proteins | 42/1237 | 193/8465 | 4.43e-03 | 2.39e-02 | 1.78e-02 | 42 |
| hsa0414434 | Endometrium | EEC | Endocytosis | 57/1237 | 251/8465 | 3.34e-04 | 2.82e-03 | 2.10e-03 | 57 |
| hsa048143 | Endometrium | EEC | Motor proteins | 42/1237 | 193/8465 | 4.43e-03 | 2.39e-02 | 1.78e-02 | 42 |
| hsa04144210 | Esophagus | ESCC | Endocytosis | 186/4205 | 251/8465 | 9.74e-16 | 4.66e-14 | 2.39e-14 | 186 |
| hsa0414437 | Esophagus | ESCC | Endocytosis | 186/4205 | 251/8465 | 9.74e-16 | 4.66e-14 | 2.39e-14 | 186 |
| hsa0414412 | Liver | Cirrhotic | Endocytosis | 119/2530 | 251/8465 | 2.33e-09 | 4.56e-08 | 2.81e-08 | 119 |
| hsa0414413 | Liver | Cirrhotic | Endocytosis | 119/2530 | 251/8465 | 2.33e-09 | 4.56e-08 | 2.81e-08 | 119 |
| hsa0414422 | Liver | HCC | Endocytosis | 178/4020 | 251/8465 | 2.03e-14 | 5.22e-13 | 2.91e-13 | 178 |
| hsa0414432 | Liver | HCC | Endocytosis | 178/4020 | 251/8465 | 2.03e-14 | 5.22e-13 | 2.91e-13 | 178 |
| hsa0414427 | Oral cavity | OSCC | Endocytosis | 174/3704 | 251/8465 | 9.42e-17 | 4.51e-15 | 2.29e-15 | 174 |
| hsa04144112 | Oral cavity | OSCC | Endocytosis | 174/3704 | 251/8465 | 9.42e-17 | 4.51e-15 | 2.29e-15 | 174 |
| hsa0414428 | Oral cavity | LP | Endocytosis | 121/2418 | 251/8465 | 1.89e-11 | 3.70e-10 | 2.38e-10 | 121 |
| hsa0414436 | Oral cavity | LP | Endocytosis | 121/2418 | 251/8465 | 1.89e-11 | 3.70e-10 | 2.38e-10 | 121 |
| hsa0414425 | Prostate | BPH | Endocytosis | 89/1718 | 251/8465 | 1.06e-08 | 1.29e-07 | 7.99e-08 | 89 |
| hsa04144111 | Prostate | BPH | Endocytosis | 89/1718 | 251/8465 | 1.06e-08 | 1.29e-07 | 7.99e-08 | 89 |
| Page: 1 2 |
Top |
Cell-cell communication analysis |
| Identification of potential cell-cell interactions between two cell types and their ligand-receptor pairs for different disease states |
| Ligand | Receptor | LRpair | Pathway | Tissue | Disease Stage |
| Page: 1 |
Top |
Single-cell gene regulatory network inference analysis |
| Find out the significant the regulons (TFs) and the target genes of each regulon across cell types for different disease states |
| TF | Cell Type | Tissue | Disease Stage | Target Gene | RSS | Regulon Activity |
| ∗The dot plots of a searched regulon are shown for all cell subpopulations in each disease state of each tissue based on the regulon specific score inferred using pySCENIC and by calculating the average expression. |
| Page: 1 |
Top |
Somatic mutation of malignant transformation related genes |
| Annotation of somatic variants for genes involved in malignant transformation |
| Hugo Symbol | Variant Class | Variant Classification | dbSNP RS | HGVSc | HGVSp | HGVSp Short | SWISSPROT | BIOTYPE | SIFT | PolyPhen | Tumor Sample Barcode | Tissue | Histology | Sex | Age | Stage | Therapy Types | Drugs | Outcome |
| CAPZA2 | SNV | Missense_Mutation | c.593N>T | p.Tyr198Phe | p.Y198F | P47755 | protein_coding | deleterious(0.02) | possibly_damaging(0.75) | TCGA-A2-A0SW-01 | Breast | breast invasive carcinoma | Female | >=65 | III/IV | Hormone Therapy | arimidex | PD | |
| CAPZA2 | deletion | Frame_Shift_Del | novel | c.259delN | p.Leu88TrpfsTer14 | p.L88Wfs*14 | P47755 | protein_coding | TCGA-D8-A27V-01 | Breast | breast invasive carcinoma | Female | <65 | I/II | Hormone Therapy | tamoxiphen | SD | ||
| CAPZA2 | SNV | Missense_Mutation | c.273N>C | p.Lys91Asn | p.K91N | P47755 | protein_coding | deleterious(0.01) | benign(0.141) | TCGA-VS-A953-01 | Cervix | cervical & endocervical cancer | Female | <65 | I/II | Unknown | Unknown | PD | |
| CAPZA2 | SNV | Missense_Mutation | novel | c.836N>G | p.Ile279Ser | p.I279S | P47755 | protein_coding | deleterious(0) | probably_damaging(0.99) | TCGA-A6-2672-01 | Colorectum | colon adenocarcinoma | Female | >=65 | III/IV | Unknown | Unknown | SD |
| CAPZA2 | SNV | Missense_Mutation | c.67N>T | p.His23Tyr | p.H23Y | P47755 | protein_coding | deleterious(0.02) | possibly_damaging(0.596) | TCGA-AA-3864-01 | Colorectum | colon adenocarcinoma | Male | >=65 | I/II | Unknown | Unknown | SD | |
| CAPZA2 | SNV | Missense_Mutation | c.775N>T | p.Arg259Cys | p.R259C | P47755 | protein_coding | deleterious(0.01) | possibly_damaging(0.574) | TCGA-F4-6463-01 | Colorectum | colon adenocarcinoma | Male | <65 | I/II | Unknown | Unknown | SD | |
| CAPZA2 | SNV | Missense_Mutation | c.53C>A | p.Ala18Glu | p.A18E | P47755 | protein_coding | deleterious(0.01) | benign(0.081) | TCGA-QL-A97D-01 | Colorectum | colon adenocarcinoma | Female | >=65 | I/II | Unknown | Unknown | SD | |
| CAPZA2 | SNV | Missense_Mutation | c.32N>T | p.Glu11Val | p.E11V | P47755 | protein_coding | tolerated(0.07) | benign(0.083) | TCGA-AP-A059-01 | Endometrium | uterine corpus endometrioid carcinoma | Female | >=65 | I/II | Unknown | Unknown | SD | |
| CAPZA2 | SNV | Missense_Mutation | c.631N>T | p.Asp211Tyr | p.D211Y | P47755 | protein_coding | deleterious(0) | possibly_damaging(0.868) | TCGA-AP-A0LM-01 | Endometrium | uterine corpus endometrioid carcinoma | Female | <65 | III/IV | Chemotherapy | cisplatin | SD | |
| CAPZA2 | SNV | Missense_Mutation | c.719N>G | p.Gln240Arg | p.Q240R | P47755 | protein_coding | deleterious(0) | probably_damaging(0.987) | TCGA-AP-A0LM-01 | Endometrium | uterine corpus endometrioid carcinoma | Female | <65 | III/IV | Chemotherapy | cisplatin | SD |
| Page: 1 2 3 |
Top |
Related drugs of malignant transformation related genes |
| Identification of chemicals and drugs interact with genes involved in malignant transfromation |
| (DGIdb 4.0) |
| Entrez ID | Symbol | Category | Interaction Types | Drug Claim Name | Drug Name | PMIDs |
| Page: 1 |

Copyright 2023-Present -The University of Texas Health Science Center at Houston |