
|
|||||
|
 | |
| |
| |
| |
| |
| |
|
Gene: CAPS |
Gene summary for CAPS |
| Gene information | Species | Human | Gene symbol | CAPS | Gene ID | 828 |
| Gene name | calcyphosine | |
| Gene Alias | CAPS1 | |
| Cytomap | 19p13.3 | |
| Gene Type | protein-coding | GO ID | GO:0007154 | UniProtAcc | K7EL21 |
Top |
Malignant transformation analysis |
| Identification of the aberrant gene expression in precancerous and cancerous lesions by comparing the gene expression of stem-like cells in diseased tissues with normal stem cells |
| Entrez ID | Symbol | Replicates | Species | Organ | Tissue | Adj P-value | Log2FC | Malignancy |
| 828 | CAPS | GSM4909286 | Human | Breast | IDC | 5.78e-18 | 4.62e-01 | 0.1081 |
| 828 | CAPS | GSM4909287 | Human | Breast | IDC | 3.82e-04 | 2.42e-01 | 0.2057 |
| 828 | CAPS | GSM4909294 | Human | Breast | IDC | 2.77e-18 | 5.62e-01 | 0.2022 |
| 828 | CAPS | GSM4909297 | Human | Breast | IDC | 2.67e-11 | 4.39e-01 | 0.1517 |
| 828 | CAPS | GSM4909304 | Human | Breast | IDC | 1.95e-14 | 3.65e-01 | 0.1636 |
| 828 | CAPS | GSM4909305 | Human | Breast | IDC | 5.01e-04 | 2.23e-01 | 0.0436 |
| 828 | CAPS | GSM4909306 | Human | Breast | IDC | 4.67e-11 | 3.41e-01 | 0.1564 |
| 828 | CAPS | GSM4909308 | Human | Breast | IDC | 2.54e-05 | 1.96e-01 | 0.158 |
| 828 | CAPS | GSM4909309 | Human | Breast | IDC | 1.05e-04 | 2.77e-01 | 0.0483 |
| 828 | CAPS | GSM4909317 | Human | Breast | IDC | 7.57e-36 | 6.92e-01 | 0.1355 |
| 828 | CAPS | GSM4909318 | Human | Breast | IDC | 8.22e-05 | 5.30e-01 | 0.2031 |
| 828 | CAPS | GSM4909319 | Human | Breast | IDC | 2.86e-05 | 1.41e-01 | 0.1563 |
| 828 | CAPS | GSM4909320 | Human | Breast | IDC | 1.76e-28 | 1.11e+00 | 0.1575 |
| 828 | CAPS | GSM4909321 | Human | Breast | IDC | 3.11e-44 | 1.02e+00 | 0.1559 |
| 828 | CAPS | M1 | Human | Breast | IDC | 2.12e-20 | 5.54e-01 | 0.1577 |
| 828 | CAPS | M2 | Human | Breast | IDC | 1.48e-26 | 1.27e+00 | 0.21 |
| 828 | CAPS | NCCBC11 | Human | Breast | DCIS | 6.57e-09 | 8.20e-01 | 0.1232 |
| 828 | CAPS | NCCBC14 | Human | Breast | DCIS | 6.98e-05 | 3.55e-01 | 0.2021 |
| 828 | CAPS | NCCBC6 | Human | Breast | DCIS | 4.10e-12 | 9.36e-01 | 0.2095 |
| 828 | CAPS | P1 | Human | Breast | IDC | 1.88e-06 | 4.05e-01 | 0.1527 |
| Page: 1 2 3 4 |
| Tissue | Expression Dynamics | Abbreviation |
| Breast | 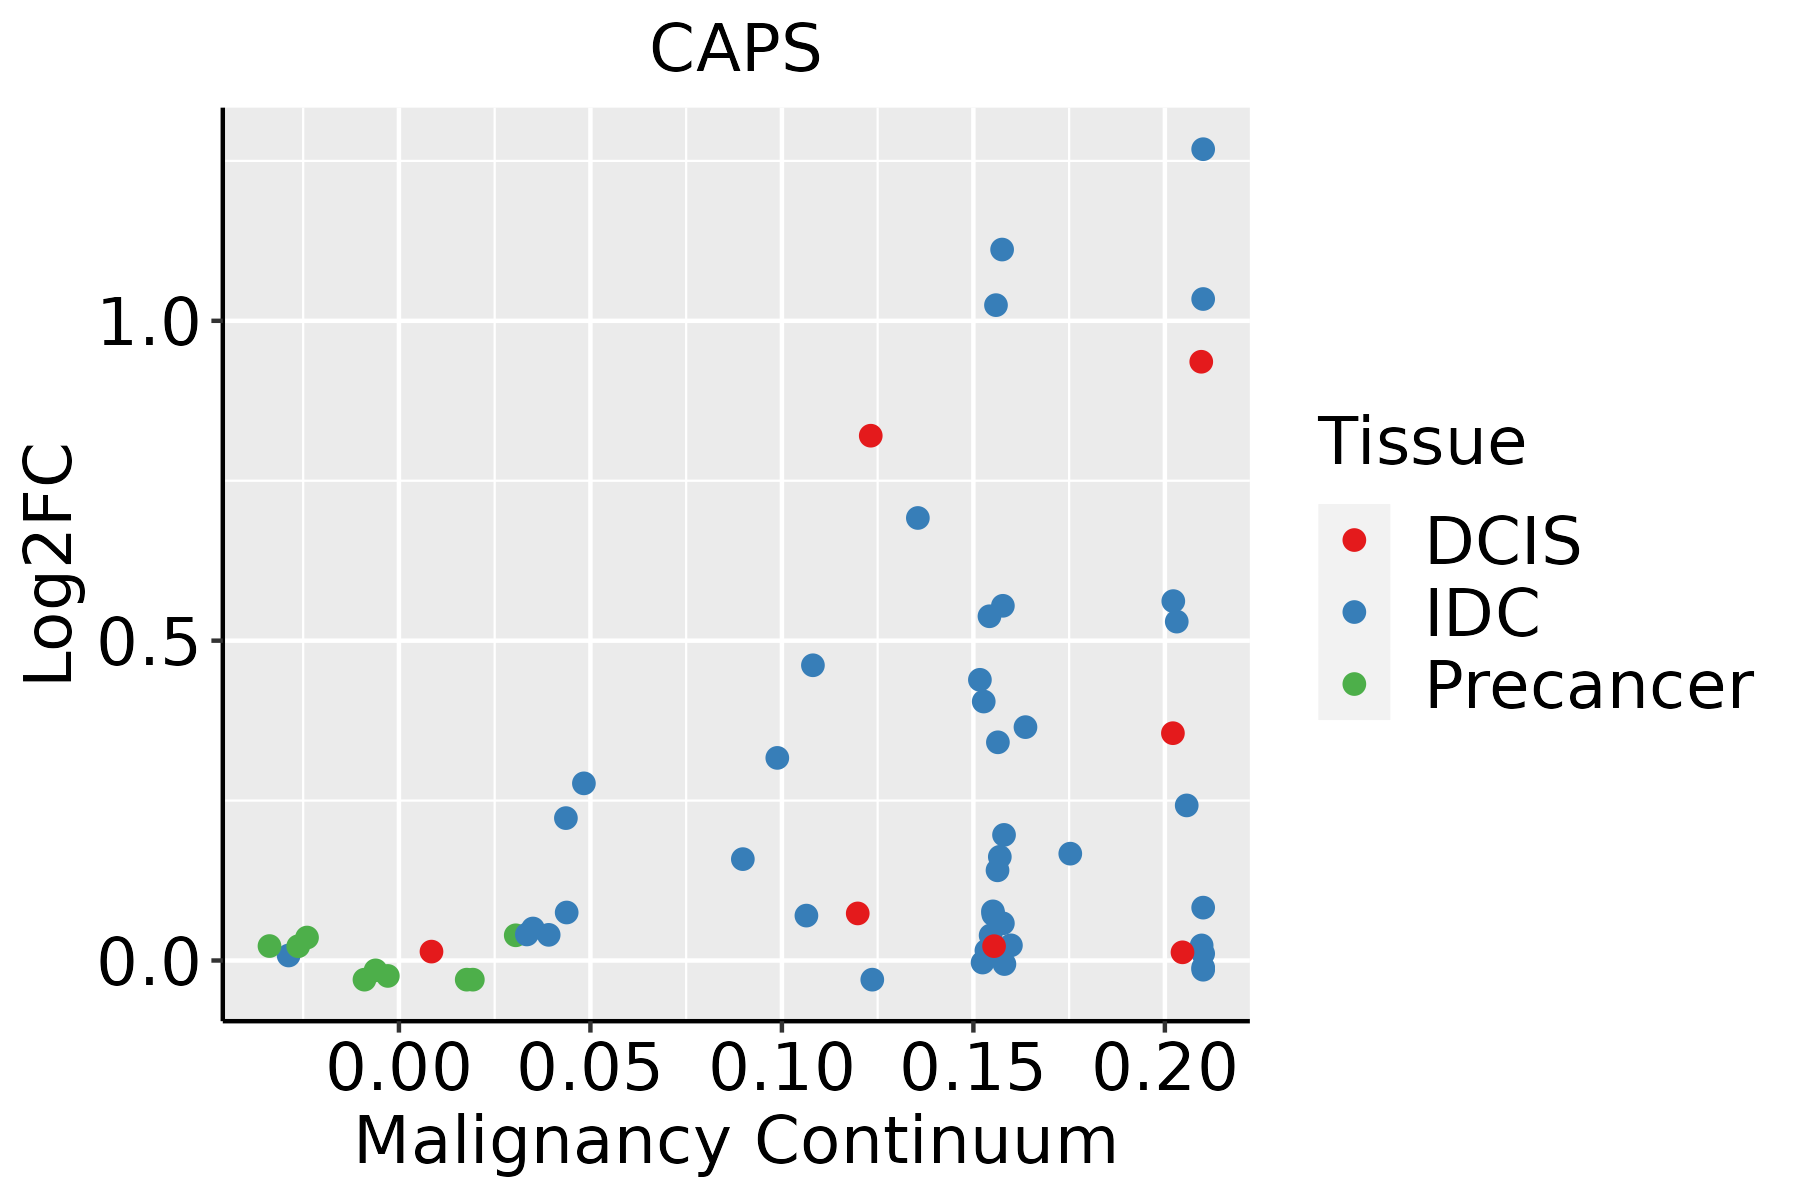 | IDC: Invasive ductal carcinoma |
| DCIS: Ductal carcinoma in situ | ||
| Precancer(BRCA1-mut): Precancerous lesion from BRCA1 mutation carriers | ||
| Endometrium | 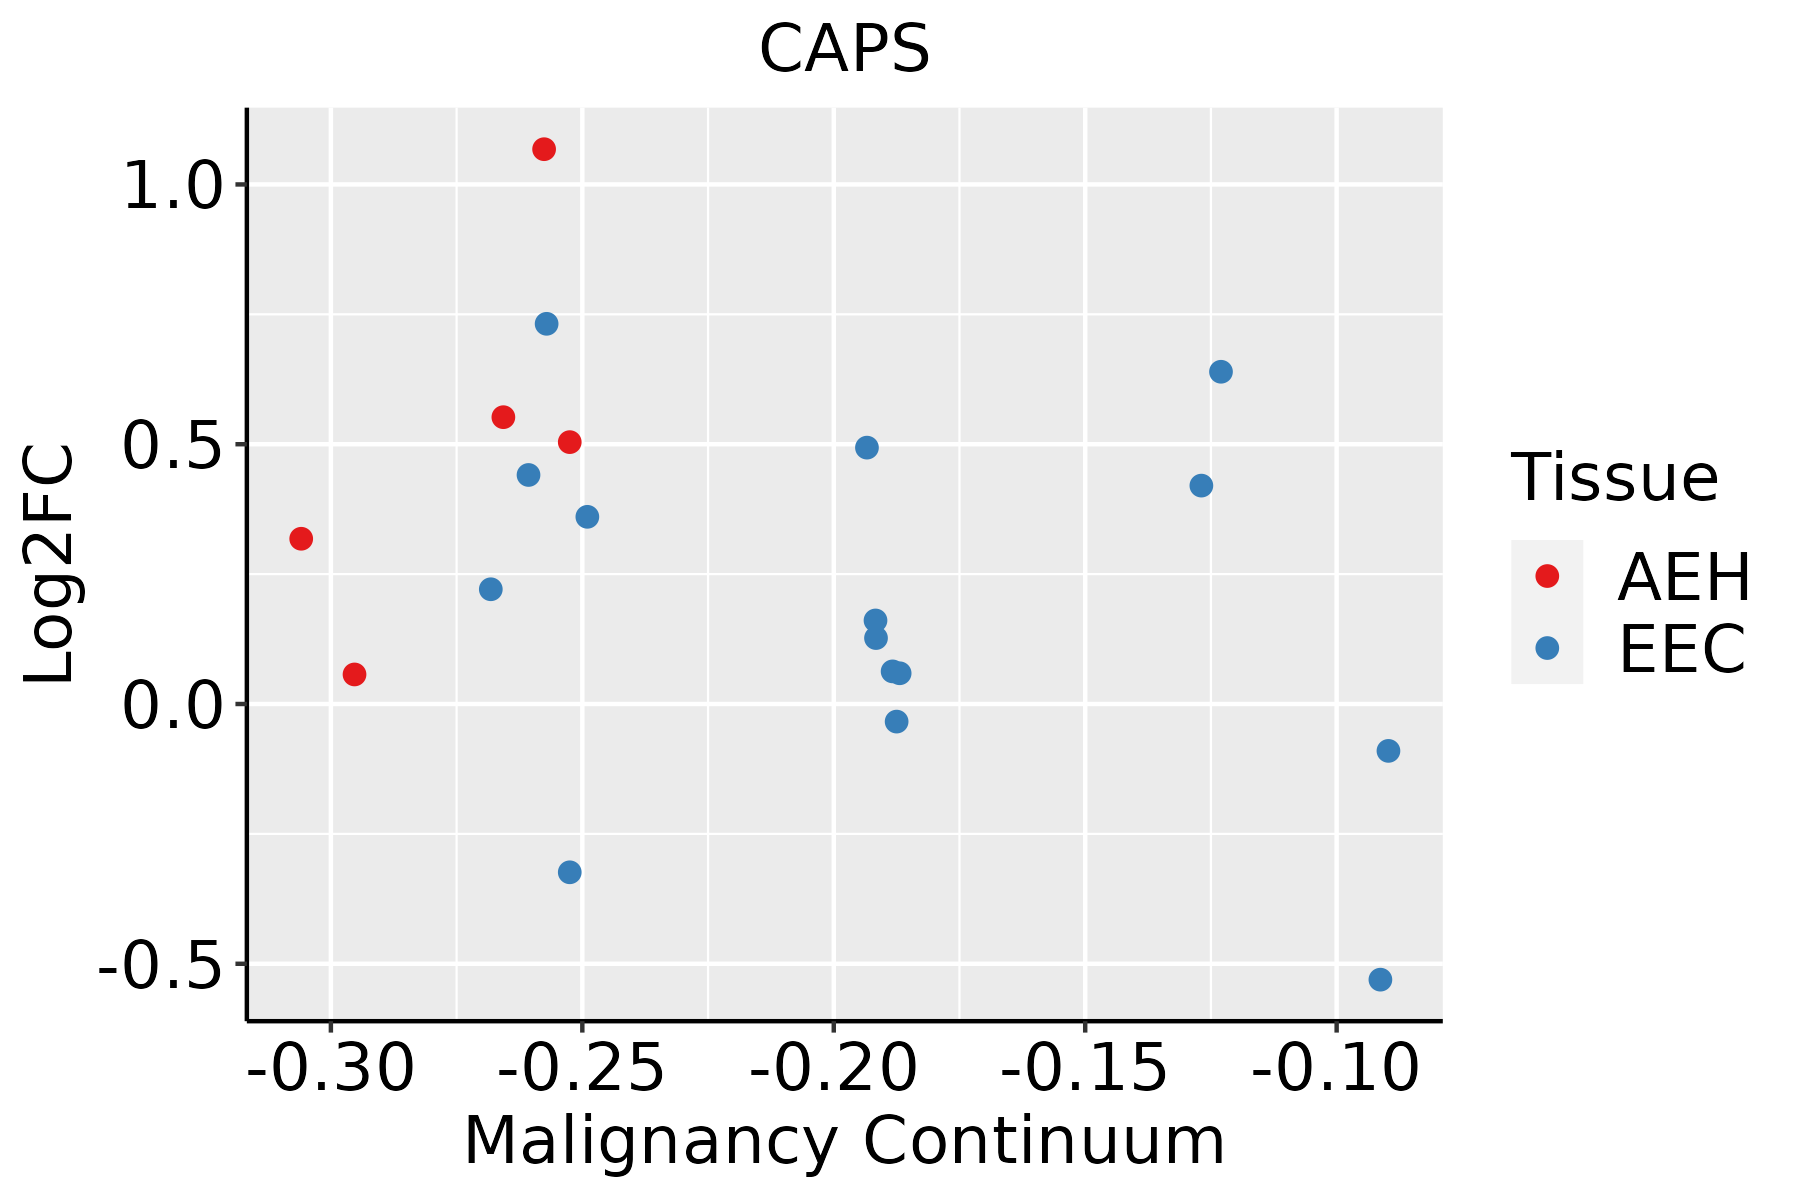 | AEH: Atypical endometrial hyperplasia |
| EEC: Endometrioid Cancer | ||
| Esophagus |  | ESCC: Esophageal squamous cell carcinoma |
| HGIN: High-grade intraepithelial neoplasias | ||
| LGIN: Low-grade intraepithelial neoplasias | ||
| Oral Cavity | 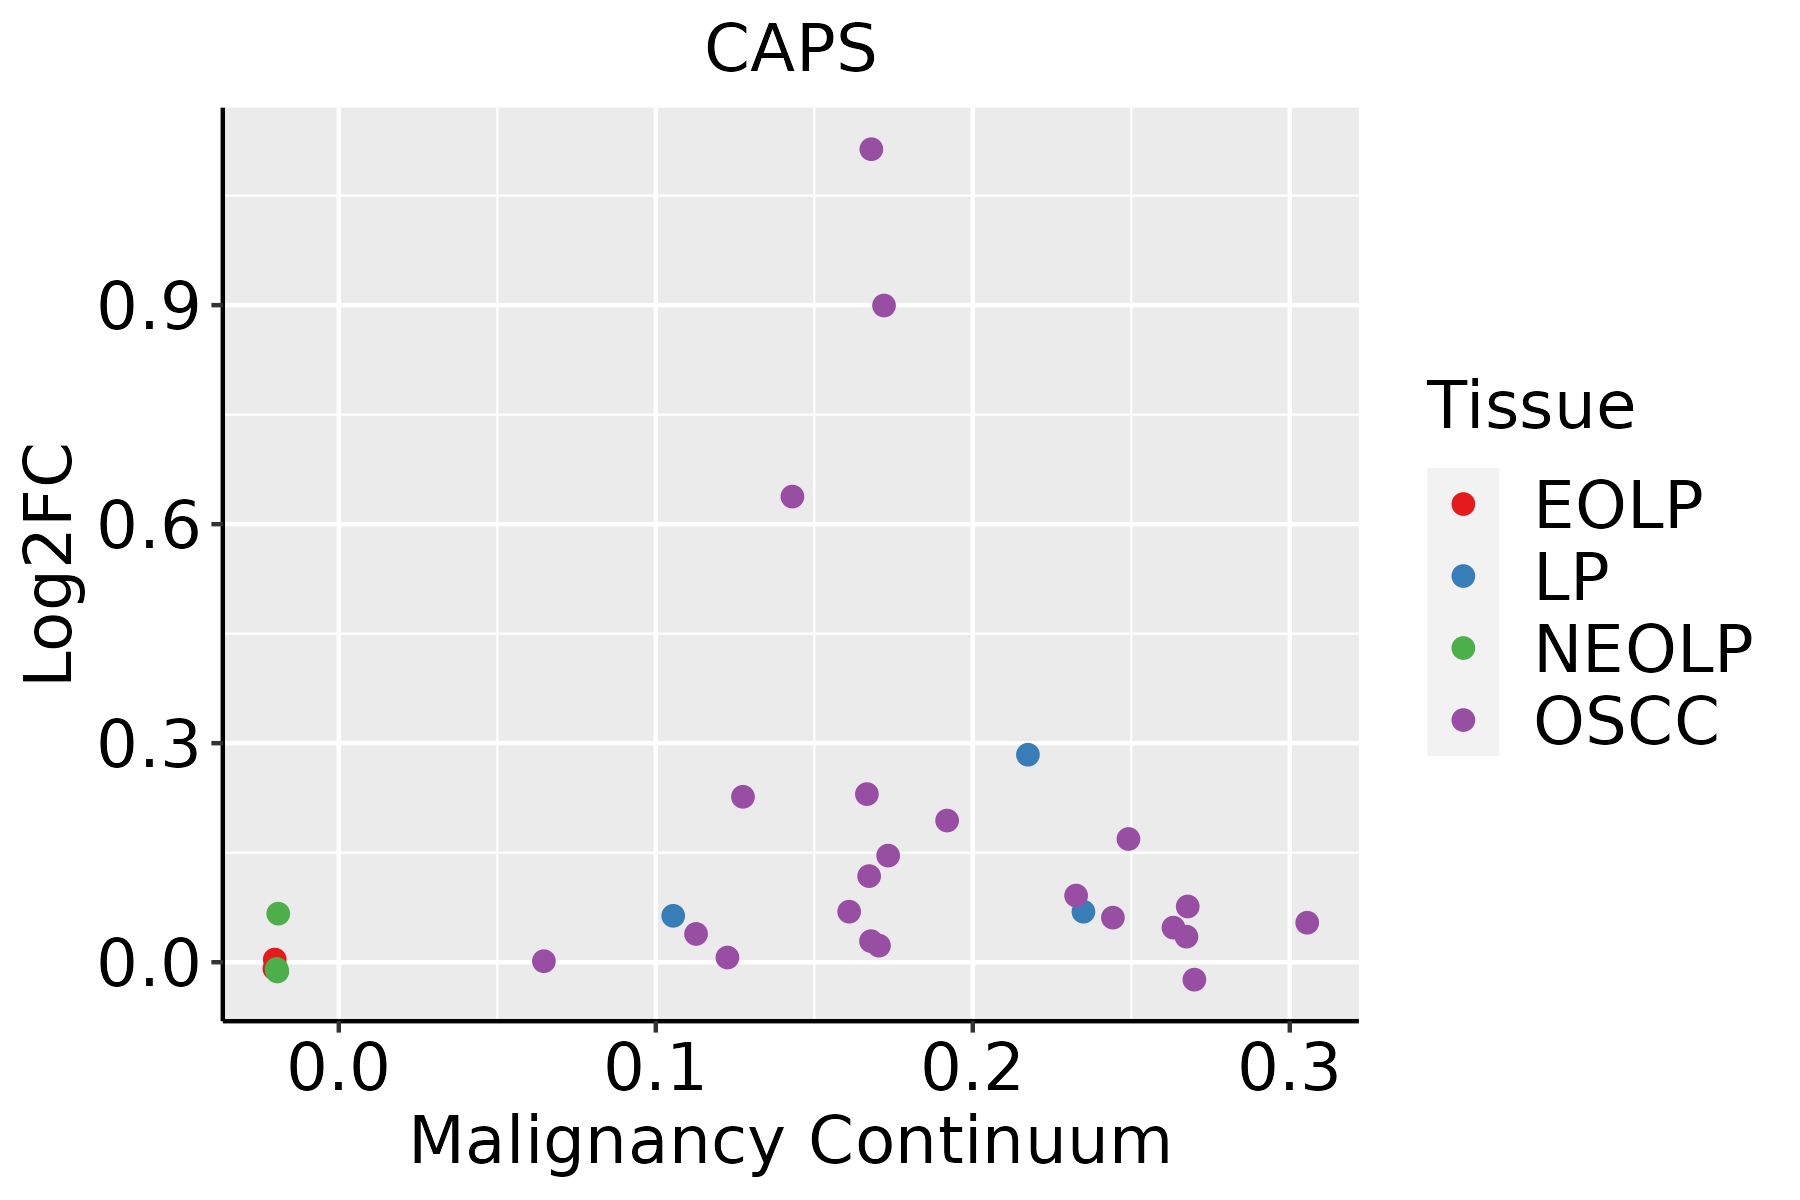 | EOLP: Erosive Oral lichen planus |
| LP: leukoplakia | ||
| NEOLP: Non-erosive oral lichen planus | ||
| OSCC: Oral squamous cell carcinoma | ||
| Thyroid | 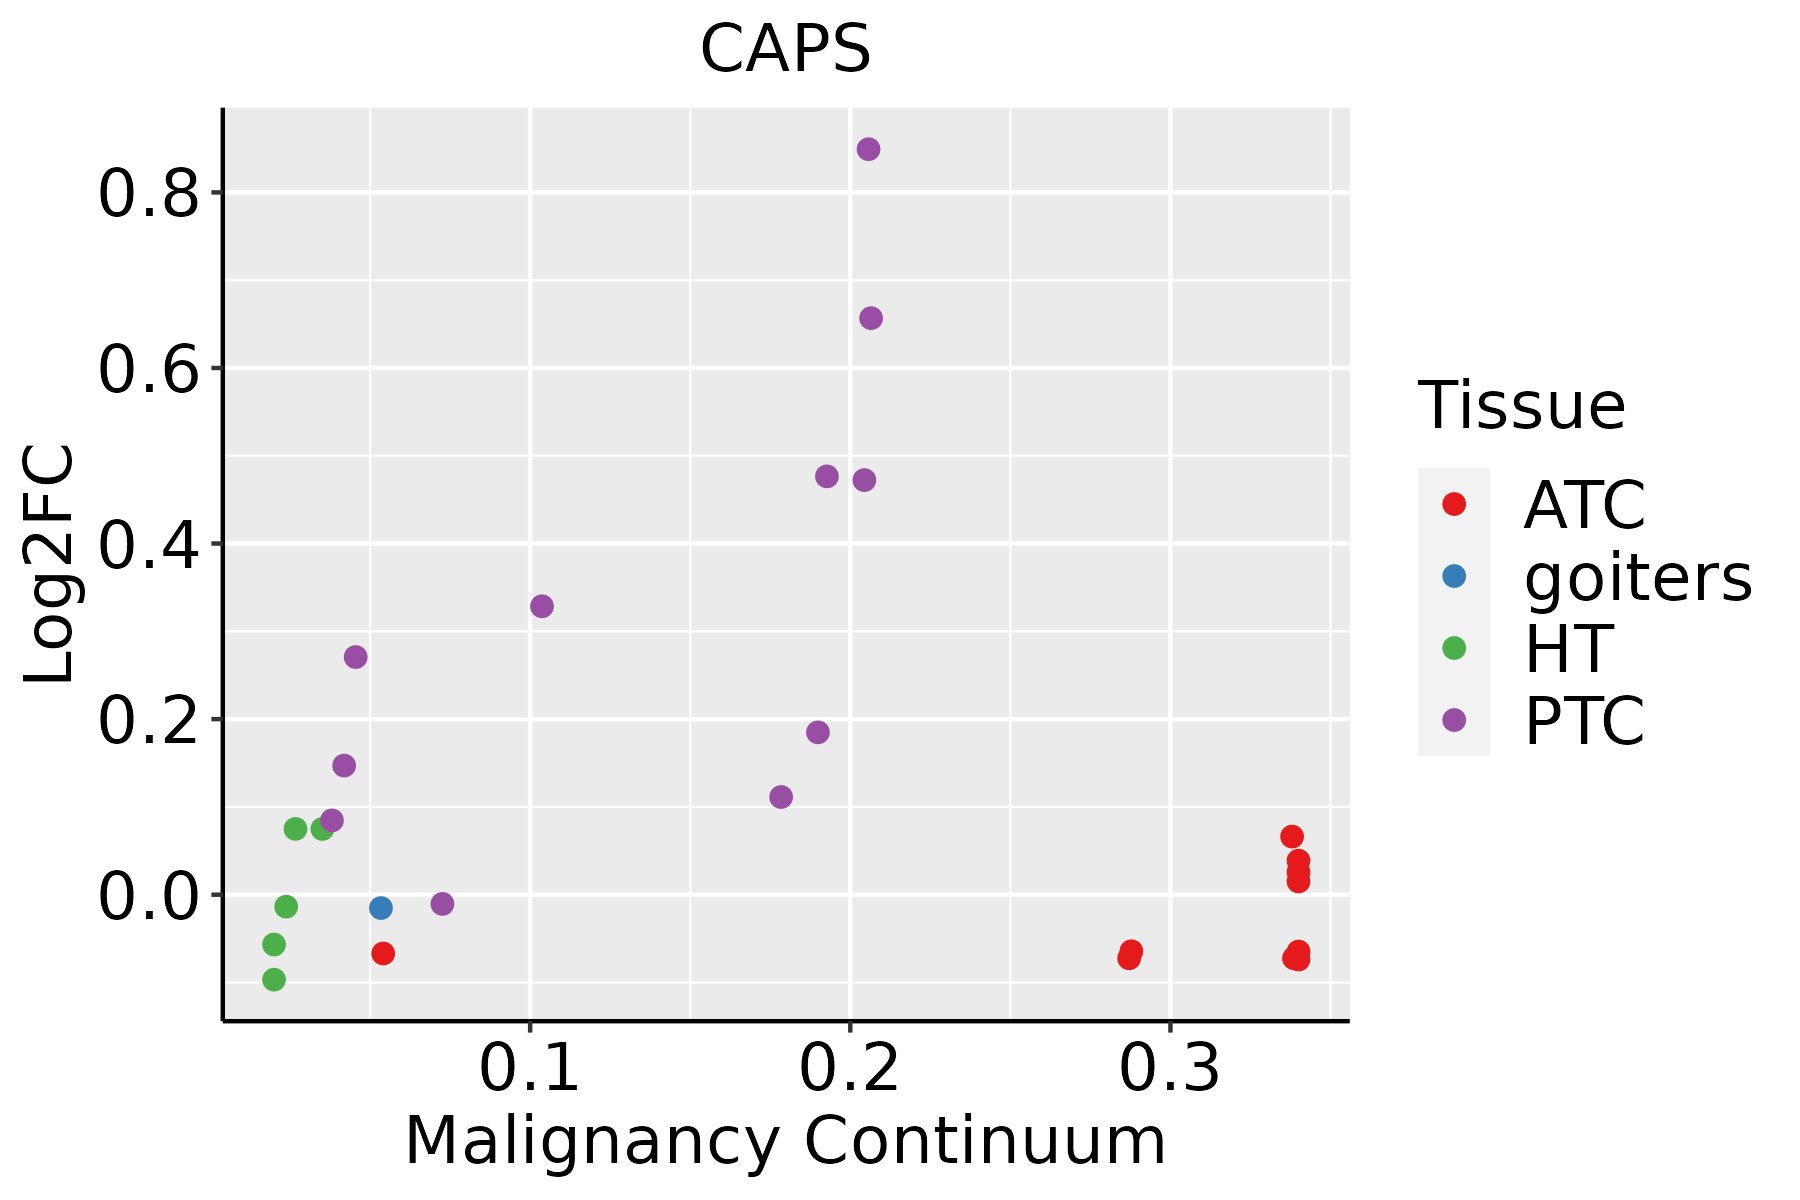 | ATC: Anaplastic thyroid cancer |
| HT: Hashimoto's thyroiditis | ||
| PTC: Papillary thyroid cancer |
| ∗log2FC in expression of this searched gene in stem-like cells from each diseased tissue sample relative to stem-like cells in normal samples in each tissue plotted against the malignancy continuum. Samples are colored based on if they are from different disease stage. |
Top |
Malignant transformation related pathway analysis |
| Find out the enriched GO biological processes and KEGG pathways involved in transition from healthy to precancer to cancer |
| Tissue | Disease Stage | Enriched GO biological Processes |
| Colorectum | AD |  |
| Colorectum | SER |  |
| Colorectum | MSS |  |
| Colorectum | MSI-H |  |
| Colorectum | FAP |  |
| ∗Top 15 enriched GO BP terms are showed in the bar plot of each disease state in each tissue. Each row represents a significant GO biological process which is colored according to the -log10(p.adjust). |
| Page: 1 2 3 4 5 6 7 8 9 |
| GO ID | Tissue | Disease Stage | Description | Gene Ratio | Bg Ratio | pvalue | p.adjust | Count |
| Page: 1 |
| Pathway ID | Tissue | Disease Stage | Description | Gene Ratio | Bg Ratio | pvalue | p.adjust | qvalue | Count |
| Page: 1 |
Top |
Cell-cell communication analysis |
| Identification of potential cell-cell interactions between two cell types and their ligand-receptor pairs for different disease states |
| Ligand | Receptor | LRpair | Pathway | Tissue | Disease Stage |
| Page: 1 |
Top |
Single-cell gene regulatory network inference analysis |
| Find out the significant the regulons (TFs) and the target genes of each regulon across cell types for different disease states |
| TF | Cell Type | Tissue | Disease Stage | Target Gene | RSS | Regulon Activity |
| ∗The dot plots of a searched regulon are shown for all cell subpopulations in each disease state of each tissue based on the regulon specific score inferred using pySCENIC and by calculating the average expression. |
| Page: 1 |
Top |
Somatic mutation of malignant transformation related genes |
| Annotation of somatic variants for genes involved in malignant transformation |
| Hugo Symbol | Variant Class | Variant Classification | dbSNP RS | HGVSc | HGVSp | HGVSp Short | SWISSPROT | BIOTYPE | SIFT | PolyPhen | Tumor Sample Barcode | Tissue | Histology | Sex | Age | Stage | Therapy Types | Drugs | Outcome |
| CAPS | SNV | Missense_Mutation | novel | c.396N>A | p.Phe132Leu | p.F132L | protein_coding | tolerated(0.46) | benign(0.001) | TCGA-AR-A0TQ-01 | Breast | breast invasive carcinoma | Female | <65 | III/IV | Chemotherapy | doxorubicin | SD | |
| CAPS | deletion | In_Frame_Del | c.480_482delCGG | p.Ser160_Gly161delinsArg | p.S160_G161delinsR | protein_coding | TCGA-AN-A04D-01 | Breast | breast invasive carcinoma | Female | <65 | I/II | Unknown | Unknown | SD | ||||
| CAPS | SNV | Missense_Mutation | rs199545548 | c.508C>T | p.Arg170Trp | p.R170W | protein_coding | deleterious(0.02) | benign(0.033) | TCGA-Q1-A5R2-01 | Cervix | cervical & endocervical cancer | Female | <65 | I/II | Chemotherapy | cisplatin | PR | |
| CAPS | SNV | Missense_Mutation | rs147762651 | c.721N>A | p.Gly241Arg | p.G241R | protein_coding | deleterious(0.02) | probably_damaging(1) | TCGA-D5-6539-01 | Colorectum | colon adenocarcinoma | Female | <65 | I/II | Unknown | Unknown | SD | |
| CAPS | SNV | Missense_Mutation | novel | c.569A>G | p.Lys190Arg | p.K190R | protein_coding | deleterious(0.02) | benign(0.4) | TCGA-AG-A02X-01 | Colorectum | rectum adenocarcinoma | Male | >=65 | I/II | Unknown | Unknown | SD | |
| CAPS | deletion | In_Frame_Del | novel | c.307_312delTCCCGC | p.Ser103_Arg104del | p.S103_R104del | protein_coding | TCGA-A6-3807-01 | Colorectum | colon adenocarcinoma | Female | <65 | III/IV | Ancillary | leucovorin | SD | |||
| CAPS | SNV | Missense_Mutation | novel | c.213G>T | p.Arg71Ser | p.R71S | protein_coding | tolerated(0.22) | benign(0.001) | TCGA-AP-A0LM-01 | Endometrium | uterine corpus endometrioid carcinoma | Female | <65 | III/IV | Chemotherapy | cisplatin | SD | |
| CAPS | SNV | Missense_Mutation | c.317C>A | p.Ala106Asp | p.A106D | protein_coding | deleterious(0) | benign(0.076) | TCGA-AP-A0LM-01 | Endometrium | uterine corpus endometrioid carcinoma | Female | <65 | III/IV | Chemotherapy | cisplatin | SD | ||
| CAPS | SNV | Missense_Mutation | novel | c.341N>T | p.Arg114Met | p.R114M | protein_coding | deleterious(0) | probably_damaging(0.921) | TCGA-B5-A1MR-01 | Endometrium | uterine corpus endometrioid carcinoma | Female | >=65 | III/IV | Unknown | Unknown | SD | |
| CAPS | SNV | Missense_Mutation | novel | c.476G>A | p.Gly159Asp | p.G159D | protein_coding | deleterious(0.04) | probably_damaging(0.955) | TCGA-B5-A3FC-01 | Endometrium | uterine corpus endometrioid carcinoma | Female | <65 | I/II | Unknown | Unknown | SD |
| Page: 1 2 |
Top |
Related drugs of malignant transformation related genes |
| Identification of chemicals and drugs interact with genes involved in malignant transfromation |
| (DGIdb 4.0) |
| Entrez ID | Symbol | Category | Interaction Types | Drug Claim Name | Drug Name | PMIDs |
| Page: 1 |

Copyright 2023-Present -The University of Texas Health Science Center at Houston |