
|
|||||
|
 | |
| |
| |
| |
| |
| |
|
Gene: CAPRIN2 |
Gene summary for CAPRIN2 |
| Gene information | Species | Human | Gene symbol | CAPRIN2 | Gene ID | 65981 |
| Gene name | caprin family member 2 | |
| Gene Alias | C1QDC1 | |
| Cytomap | 12p11.21 | |
| Gene Type | protein-coding | GO ID | GO:0000902 | UniProtAcc | Q6IMN6 |
Top |
Malignant transformation analysis |
| Identification of the aberrant gene expression in precancerous and cancerous lesions by comparing the gene expression of stem-like cells in diseased tissues with normal stem cells |
| Entrez ID | Symbol | Replicates | Species | Organ | Tissue | Adj P-value | Log2FC | Malignancy |
| 65981 | CAPRIN2 | HCC1_Meng | Human | Liver | HCC | 3.62e-08 | -1.38e-02 | 0.0246 |
| 65981 | CAPRIN2 | HCC2_Meng | Human | Liver | HCC | 7.08e-14 | 1.02e-01 | 0.0107 |
| 65981 | CAPRIN2 | HCC1 | Human | Liver | HCC | 1.31e-02 | 1.84e+00 | 0.5336 |
| 65981 | CAPRIN2 | HCC2 | Human | Liver | HCC | 2.40e-03 | 2.59e+00 | 0.5341 |
| 65981 | CAPRIN2 | S014 | Human | Liver | HCC | 1.36e-02 | 1.38e-01 | 0.2254 |
| 65981 | CAPRIN2 | S015 | Human | Liver | HCC | 1.37e-06 | 4.65e-01 | 0.2375 |
| 65981 | CAPRIN2 | S028 | Human | Liver | HCC | 1.99e-06 | 2.42e-01 | 0.2503 |
| 65981 | CAPRIN2 | male-WTA | Human | Thyroid | PTC | 2.84e-03 | 3.84e-02 | 0.1037 |
| 65981 | CAPRIN2 | PTC01 | Human | Thyroid | PTC | 4.11e-03 | 1.44e-02 | 0.1899 |
| 65981 | CAPRIN2 | PTC03 | Human | Thyroid | PTC | 3.50e-03 | 1.73e-01 | 0.1784 |
| 65981 | CAPRIN2 | PTC04 | Human | Thyroid | PTC | 1.47e-05 | 9.05e-02 | 0.1927 |
| 65981 | CAPRIN2 | PTC05 | Human | Thyroid | PTC | 6.14e-08 | 2.85e-01 | 0.2065 |
| 65981 | CAPRIN2 | PTC06 | Human | Thyroid | PTC | 2.36e-09 | 2.74e-01 | 0.2057 |
| 65981 | CAPRIN2 | PTC07 | Human | Thyroid | PTC | 1.39e-08 | 1.25e-01 | 0.2044 |
| 65981 | CAPRIN2 | ATC09 | Human | Thyroid | ATC | 2.40e-04 | 1.86e-01 | 0.2871 |
| 65981 | CAPRIN2 | ATC11 | Human | Thyroid | ATC | 2.61e-06 | 4.81e-01 | 0.3386 |
| 65981 | CAPRIN2 | ATC12 | Human | Thyroid | ATC | 3.40e-07 | 1.99e-01 | 0.34 |
| 65981 | CAPRIN2 | ATC13 | Human | Thyroid | ATC | 2.06e-39 | 6.74e-01 | 0.34 |
| 65981 | CAPRIN2 | ATC1 | Human | Thyroid | ATC | 1.81e-04 | 2.10e-01 | 0.2878 |
| 65981 | CAPRIN2 | ATC2 | Human | Thyroid | ATC | 1.89e-09 | 6.62e-01 | 0.34 |
| Page: 1 2 |
| Tissue | Expression Dynamics | Abbreviation |
| Liver | 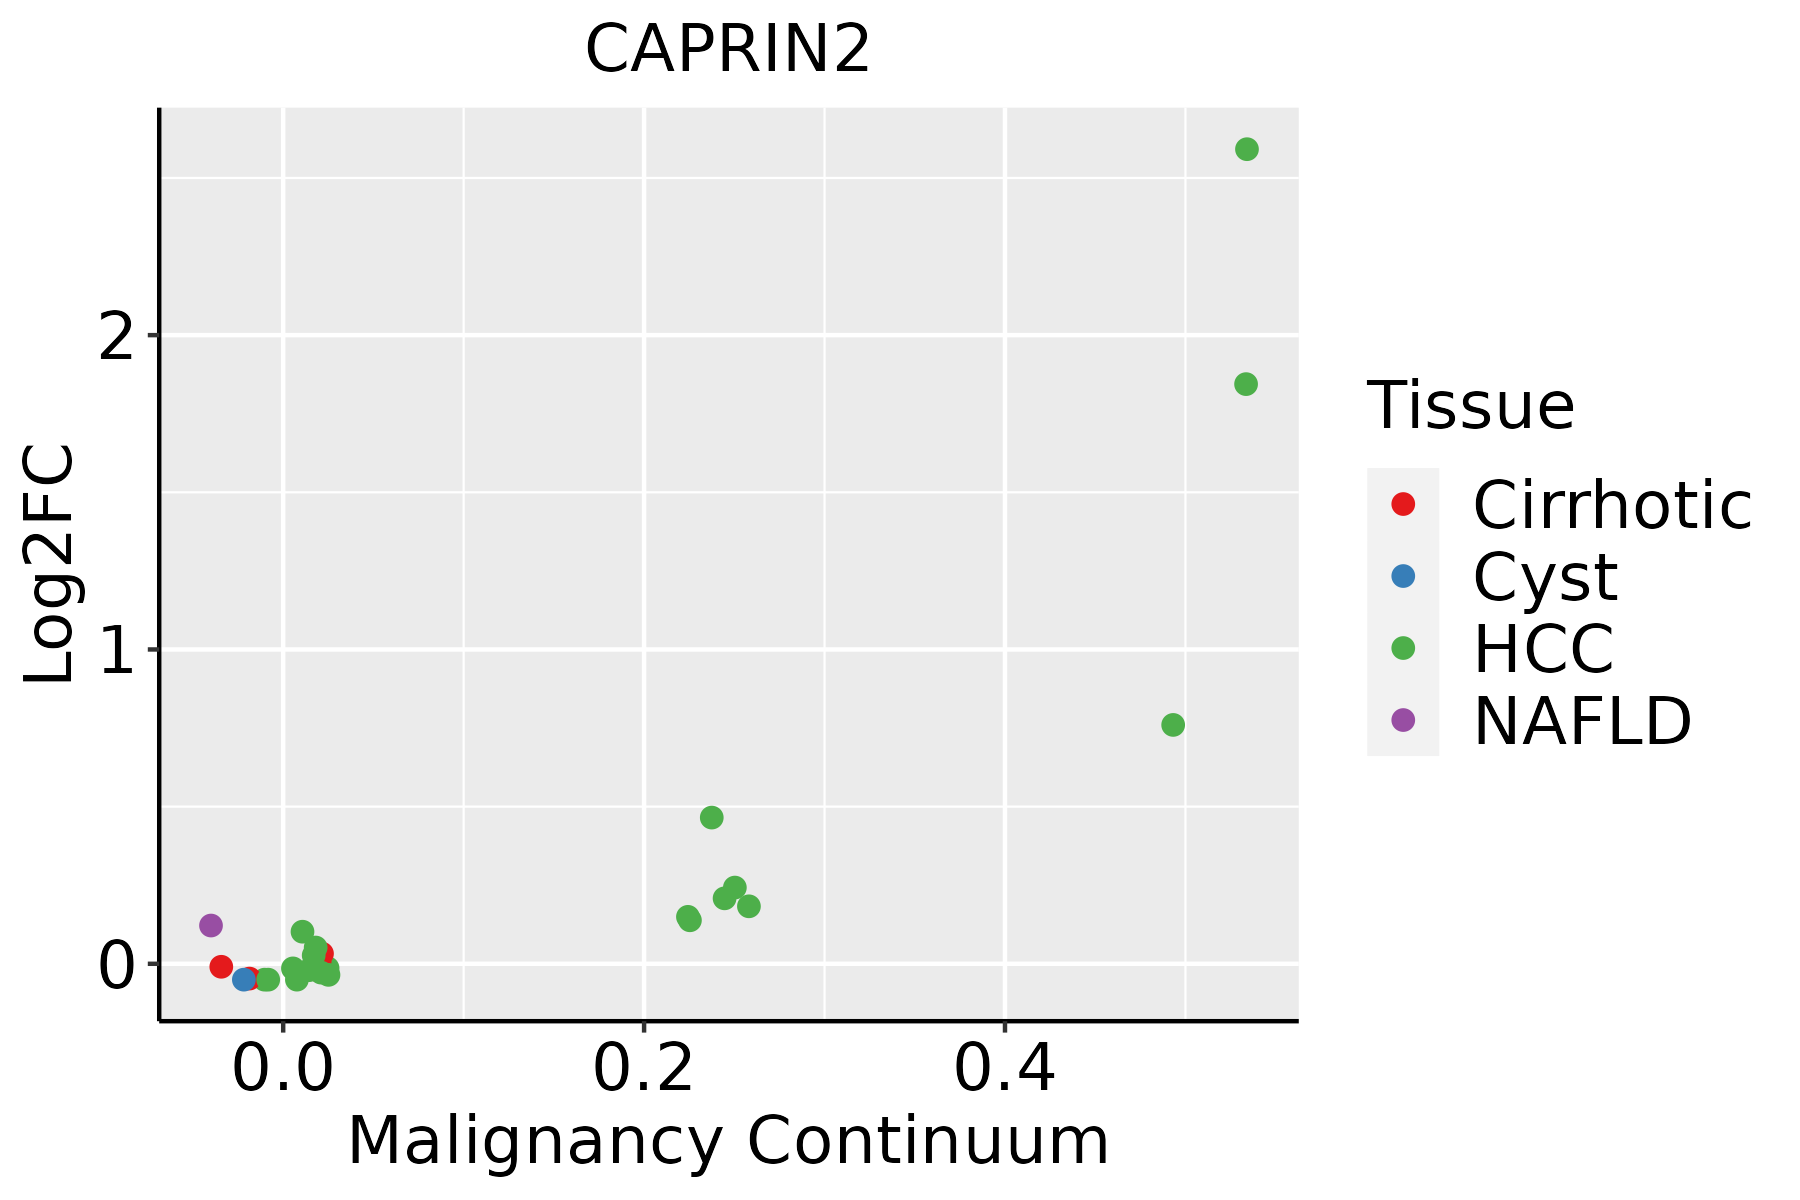 | HCC: Hepatocellular carcinoma |
| NAFLD: Non-alcoholic fatty liver disease | ||
| Thyroid | 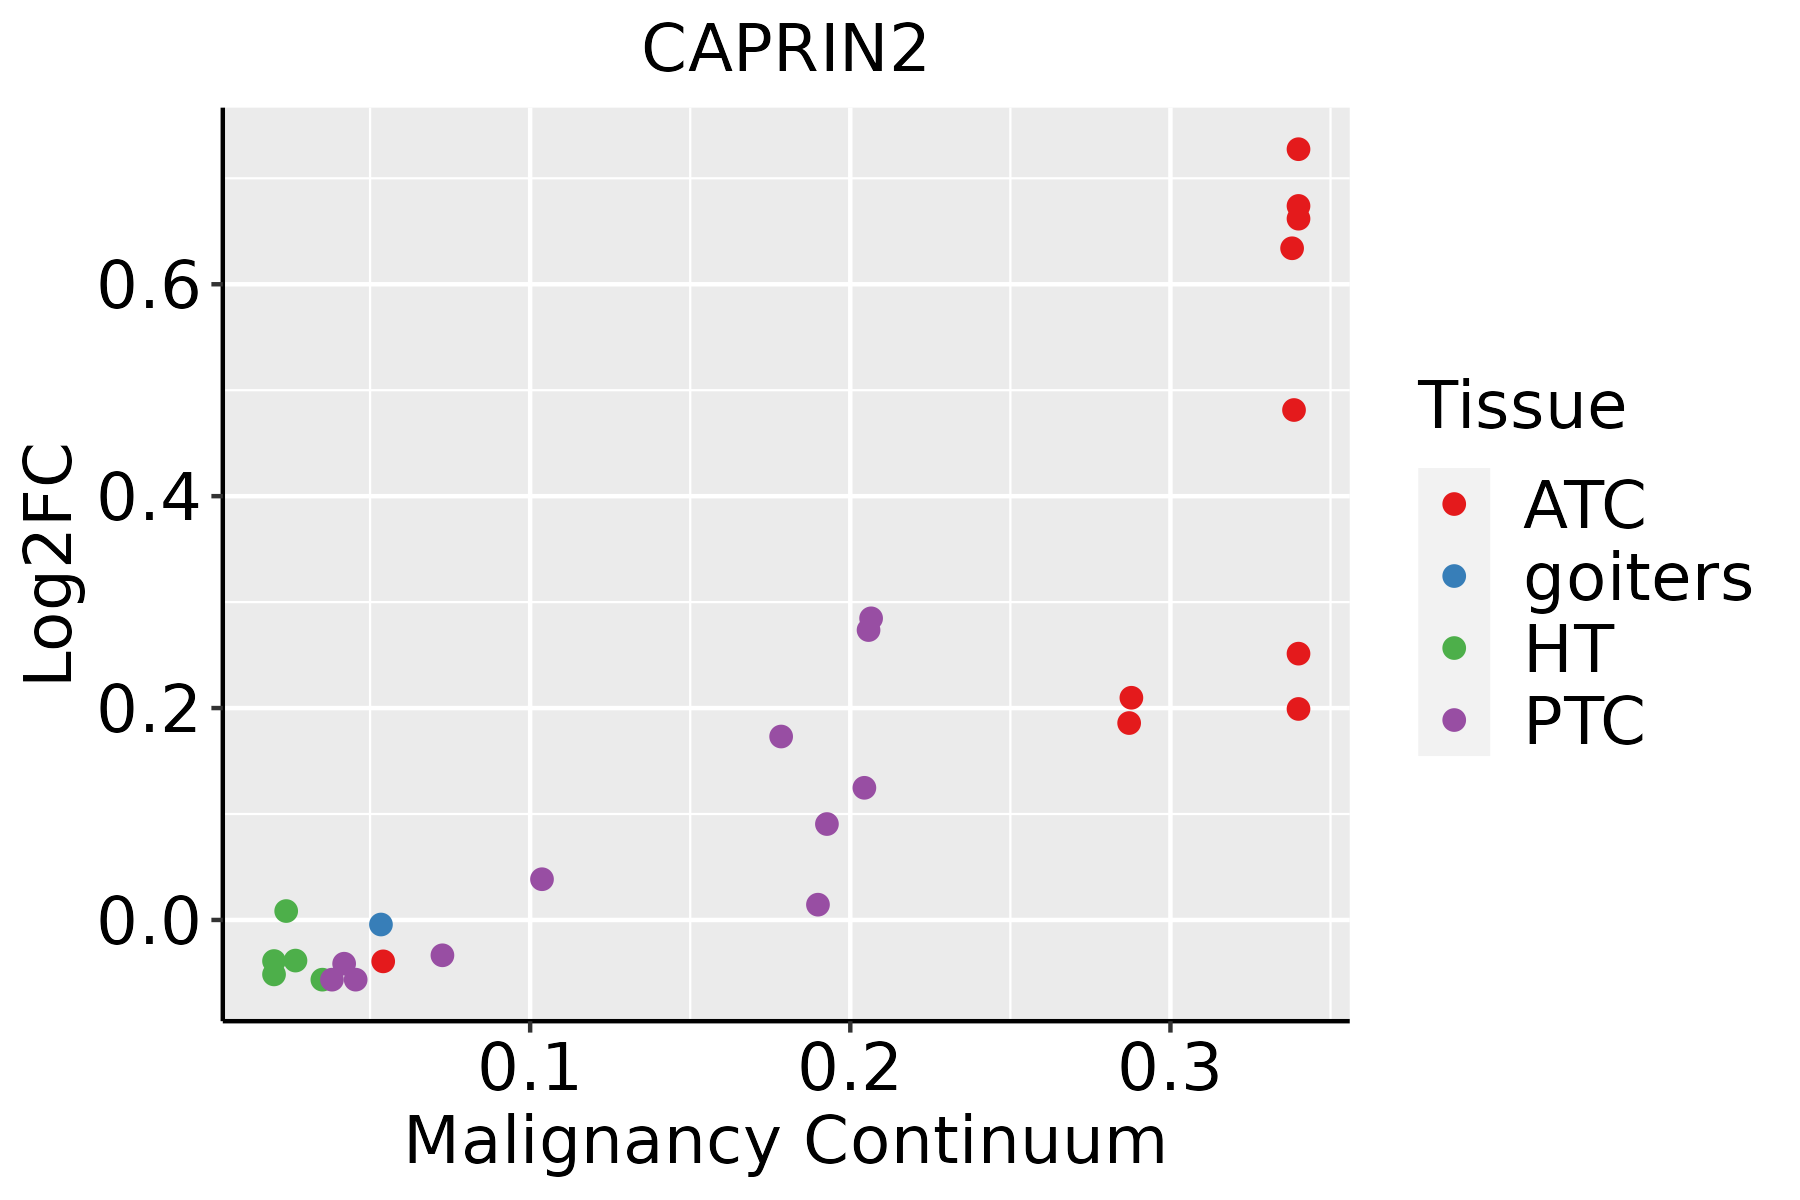 | ATC: Anaplastic thyroid cancer |
| HT: Hashimoto's thyroiditis | ||
| PTC: Papillary thyroid cancer |
| ∗log2FC in expression of this searched gene in stem-like cells from each diseased tissue sample relative to stem-like cells in normal samples in each tissue plotted against the malignancy continuum. Samples are colored based on if they are from different disease stage. |
Top |
Malignant transformation related pathway analysis |
| Find out the enriched GO biological processes and KEGG pathways involved in transition from healthy to precancer to cancer |
| Tissue | Disease Stage | Enriched GO biological Processes |
| Colorectum | AD |  |
| Colorectum | SER |  |
| Colorectum | MSS |  |
| Colorectum | MSI-H |  |
| Colorectum | FAP |  |
| ∗Top 15 enriched GO BP terms are showed in the bar plot of each disease state in each tissue. Each row represents a significant GO biological process which is colored according to the -log10(p.adjust). |
| Page: 1 2 3 4 5 6 7 8 9 |
| GO ID | Tissue | Disease Stage | Description | Gene Ratio | Bg Ratio | pvalue | p.adjust | Count |
| GO:000641722 | Liver | HCC | regulation of translation | 287/7958 | 468/18723 | 8.79e-17 | 8.08e-15 | 287 |
| GO:005109822 | Liver | HCC | regulation of binding | 225/7958 | 363/18723 | 3.78e-14 | 2.37e-12 | 225 |
| GO:004339322 | Liver | HCC | regulation of protein binding | 129/7958 | 196/18723 | 3.27e-11 | 1.26e-09 | 129 |
| GO:002260422 | Liver | HCC | regulation of cell morphogenesis | 188/7958 | 309/18723 | 4.84e-11 | 1.82e-09 | 188 |
| GO:001604921 | Liver | HCC | cell growth | 269/7958 | 482/18723 | 1.84e-09 | 5.35e-08 | 269 |
| GO:019873821 | Liver | HCC | cell-cell signaling by wnt | 247/7958 | 446/18723 | 2.11e-08 | 4.96e-07 | 247 |
| GO:001605521 | Liver | HCC | Wnt signaling pathway | 245/7958 | 444/18723 | 3.68e-08 | 8.09e-07 | 245 |
| GO:005109922 | Liver | HCC | positive regulation of binding | 108/7958 | 173/18723 | 9.22e-08 | 1.83e-06 | 108 |
| GO:000155821 | Liver | HCC | regulation of cell growth | 228/7958 | 414/18723 | 1.34e-07 | 2.55e-06 | 228 |
| GO:003209221 | Liver | HCC | positive regulation of protein binding | 59/7958 | 85/18723 | 4.66e-07 | 7.61e-06 | 59 |
| GO:001076922 | Liver | HCC | regulation of cell morphogenesis involved in differentiation | 65/7958 | 96/18723 | 5.17e-07 | 8.37e-06 | 65 |
| GO:003134611 | Liver | HCC | positive regulation of cell projection organization | 193/7958 | 353/18723 | 2.28e-06 | 3.08e-05 | 193 |
| GO:003011121 | Liver | HCC | regulation of Wnt signaling pathway | 180/7958 | 328/18723 | 3.62e-06 | 4.72e-05 | 180 |
| GO:001077022 | Liver | HCC | positive regulation of cell morphogenesis involved in differentiation | 53/7958 | 79/18723 | 8.69e-06 | 1.02e-04 | 53 |
| GO:001810511 | Liver | HCC | peptidyl-serine phosphorylation | 169/7958 | 315/18723 | 3.86e-05 | 3.81e-04 | 169 |
| GO:006007021 | Liver | HCC | canonical Wnt signaling pathway | 162/7958 | 303/18723 | 7.00e-05 | 6.32e-04 | 162 |
| GO:006082821 | Liver | HCC | regulation of canonical Wnt signaling pathway | 137/7958 | 253/18723 | 1.15e-04 | 9.70e-04 | 137 |
| GO:001820911 | Liver | HCC | peptidyl-serine modification | 177/7958 | 338/18723 | 1.45e-04 | 1.17e-03 | 177 |
| GO:003017721 | Liver | HCC | positive regulation of Wnt signaling pathway | 81/7958 | 140/18723 | 1.73e-04 | 1.36e-03 | 81 |
| GO:003424921 | Liver | HCC | negative regulation of cellular amide metabolic process | 144/7958 | 273/18723 | 3.80e-04 | 2.61e-03 | 144 |
| Page: 1 2 3 4 5 6 7 |
| Pathway ID | Tissue | Disease Stage | Description | Gene Ratio | Bg Ratio | pvalue | p.adjust | qvalue | Count |
| Page: 1 |
Top |
Cell-cell communication analysis |
| Identification of potential cell-cell interactions between two cell types and their ligand-receptor pairs for different disease states |
| Ligand | Receptor | LRpair | Pathway | Tissue | Disease Stage |
| Page: 1 |
Top |
Single-cell gene regulatory network inference analysis |
| Find out the significant the regulons (TFs) and the target genes of each regulon across cell types for different disease states |
| TF | Cell Type | Tissue | Disease Stage | Target Gene | RSS | Regulon Activity |
| ∗The dot plots of a searched regulon are shown for all cell subpopulations in each disease state of each tissue based on the regulon specific score inferred using pySCENIC and by calculating the average expression. |
| Page: 1 |
Top |
Somatic mutation of malignant transformation related genes |
| Annotation of somatic variants for genes involved in malignant transformation |
| Hugo Symbol | Variant Class | Variant Classification | dbSNP RS | HGVSc | HGVSp | HGVSp Short | SWISSPROT | BIOTYPE | SIFT | PolyPhen | Tumor Sample Barcode | Tissue | Histology | Sex | Age | Stage | Therapy Types | Drugs | Outcome |
| CAPRIN2 | SNV | Missense_Mutation | novel | c.1673N>G | p.Ser558Cys | p.S558C | Q6IMN6 | protein_coding | deleterious(0.04) | possibly_damaging(0.513) | TCGA-3C-AALI-01 | Breast | breast invasive carcinoma | Female | <65 | I/II | Unspecific | Poly E | Complete Response |
| CAPRIN2 | SNV | Missense_Mutation | c.588N>C | p.Lys196Asn | p.K196N | Q6IMN6 | protein_coding | deleterious(0.02) | benign(0.27) | TCGA-A2-A0YK-01 | Breast | breast invasive carcinoma | Female | <65 | I/II | Chemotherapy | cytoxan | SD | |
| CAPRIN2 | SNV | Missense_Mutation | novel | c.409N>A | p.Glu137Lys | p.E137K | Q6IMN6 | protein_coding | deleterious(0.01) | probably_damaging(0.998) | TCGA-AN-A046-01 | Breast | breast invasive carcinoma | Female | >=65 | I/II | Unknown | Unknown | SD |
| CAPRIN2 | SNV | Missense_Mutation | c.587A>C | p.Lys196Thr | p.K196T | Q6IMN6 | protein_coding | deleterious(0) | possibly_damaging(0.784) | TCGA-AR-A0TS-01 | Breast | breast invasive carcinoma | Female | <65 | I/II | Chemotherapy | doxorubicin | SD | |
| CAPRIN2 | SNV | Missense_Mutation | c.554N>T | p.Ser185Phe | p.S185F | Q6IMN6 | protein_coding | tolerated(0.12) | probably_damaging(0.992) | TCGA-C8-A1HM-01 | Breast | breast invasive carcinoma | Female | >=65 | I/II | Chemotherapy | doxorubicin | CR | |
| CAPRIN2 | SNV | Missense_Mutation | novel | c.1820C>T | p.Ser607Phe | p.S607F | Q6IMN6 | protein_coding | deleterious(0.04) | benign(0.023) | TCGA-UU-A93S-01 | Breast | breast invasive carcinoma | Female | <65 | III/IV | Unknown | Unknown | PD |
| CAPRIN2 | insertion | In_Frame_Ins | novel | c.3125_3126insAGGATGTTATTTTATGTATTTTAA | p.Leu1042_Gln1043insGlyCysTyrPheMetTyrPheAsn | p.L1042_Q1043insGCYFMYFN | Q6IMN6 | protein_coding | TCGA-A8-A09Q-01 | Breast | breast invasive carcinoma | Female | >=65 | III/IV | Hormone Therapy | anastrozole | SD | ||
| CAPRIN2 | insertion | Frame_Shift_Ins | novel | c.3123_3124insGTGAGCCTTATGATAA | p.Leu1042ValfsTer27 | p.L1042Vfs*27 | Q6IMN6 | protein_coding | TCGA-A8-A09Q-01 | Breast | breast invasive carcinoma | Female | >=65 | III/IV | Hormone Therapy | anastrozole | SD | ||
| CAPRIN2 | deletion | Frame_Shift_Del | novel | c.1596delN | p.Met533CysfsTer27 | p.M533Cfs*27 | Q6IMN6 | protein_coding | TCGA-D8-A27V-01 | Breast | breast invasive carcinoma | Female | <65 | I/II | Hormone Therapy | tamoxiphen | SD | ||
| CAPRIN2 | SNV | Missense_Mutation | novel | c.1175C>A | p.Ala392Glu | p.A392E | Q6IMN6 | protein_coding | tolerated(0.16) | benign(0.003) | TCGA-C5-A8ZZ-01 | Cervix | cervical & endocervical cancer | Female | <65 | I/II | Unspecific | Cisplatin | SD |
| Page: 1 2 3 4 5 6 7 8 9 10 11 12 13 |
Top |
Related drugs of malignant transformation related genes |
| Identification of chemicals and drugs interact with genes involved in malignant transfromation |
| (DGIdb 4.0) |
| Entrez ID | Symbol | Category | Interaction Types | Drug Claim Name | Drug Name | PMIDs |
| Page: 1 |

Copyright 2023-Present -The University of Texas Health Science Center at Houston |