| Tissue | Expression Dynamics | Abbreviation |
| Colorectum (GSE201348) |  | FAP: Familial adenomatous polyposis |
| CRC: Colorectal cancer |
| Colorectum (HTA11) | 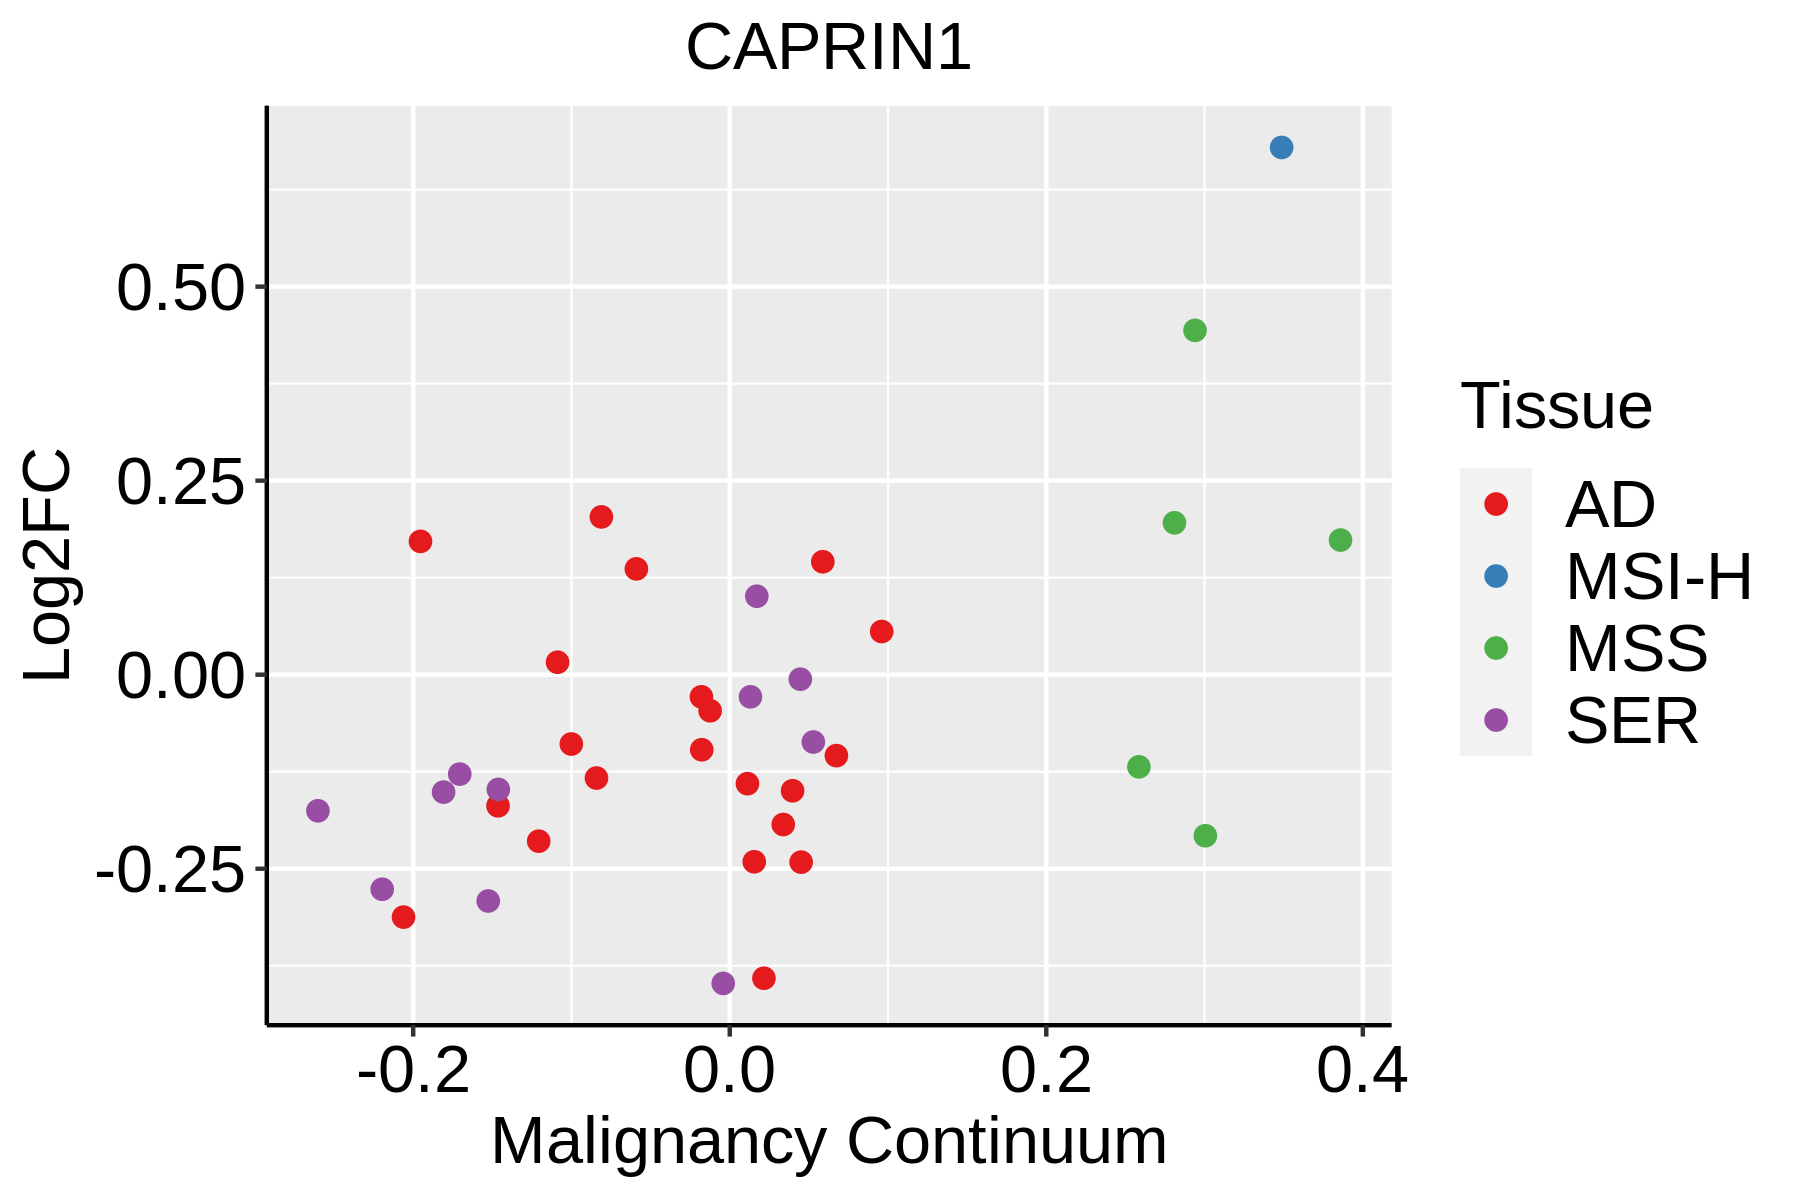 | AD: Adenomas |
| SER: Sessile serrated lesions |
| MSI-H: Microsatellite-high colorectal cancer |
| MSS: Microsatellite stable colorectal cancer |
| Esophagus | 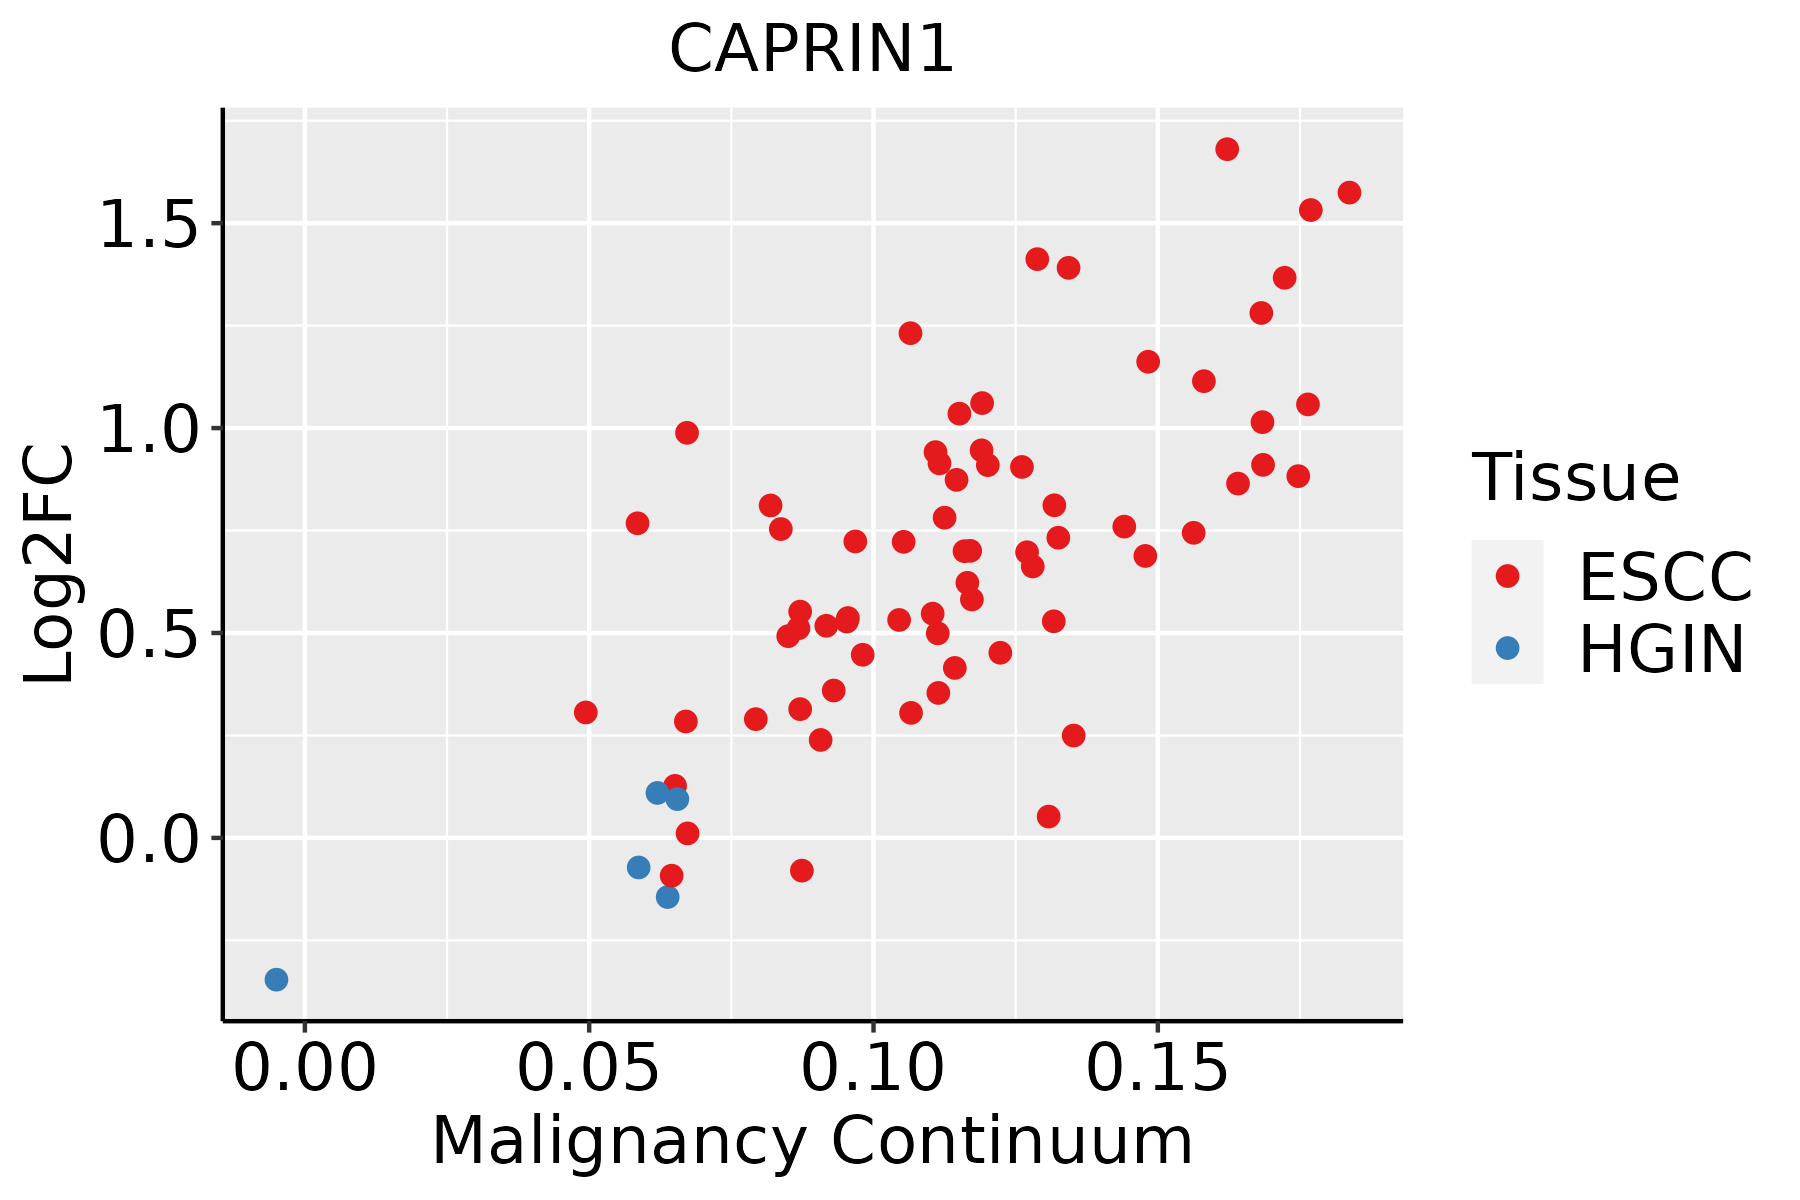 | ESCC: Esophageal squamous cell carcinoma |
| HGIN: High-grade intraepithelial neoplasias |
| LGIN: Low-grade intraepithelial neoplasias |
| Liver | 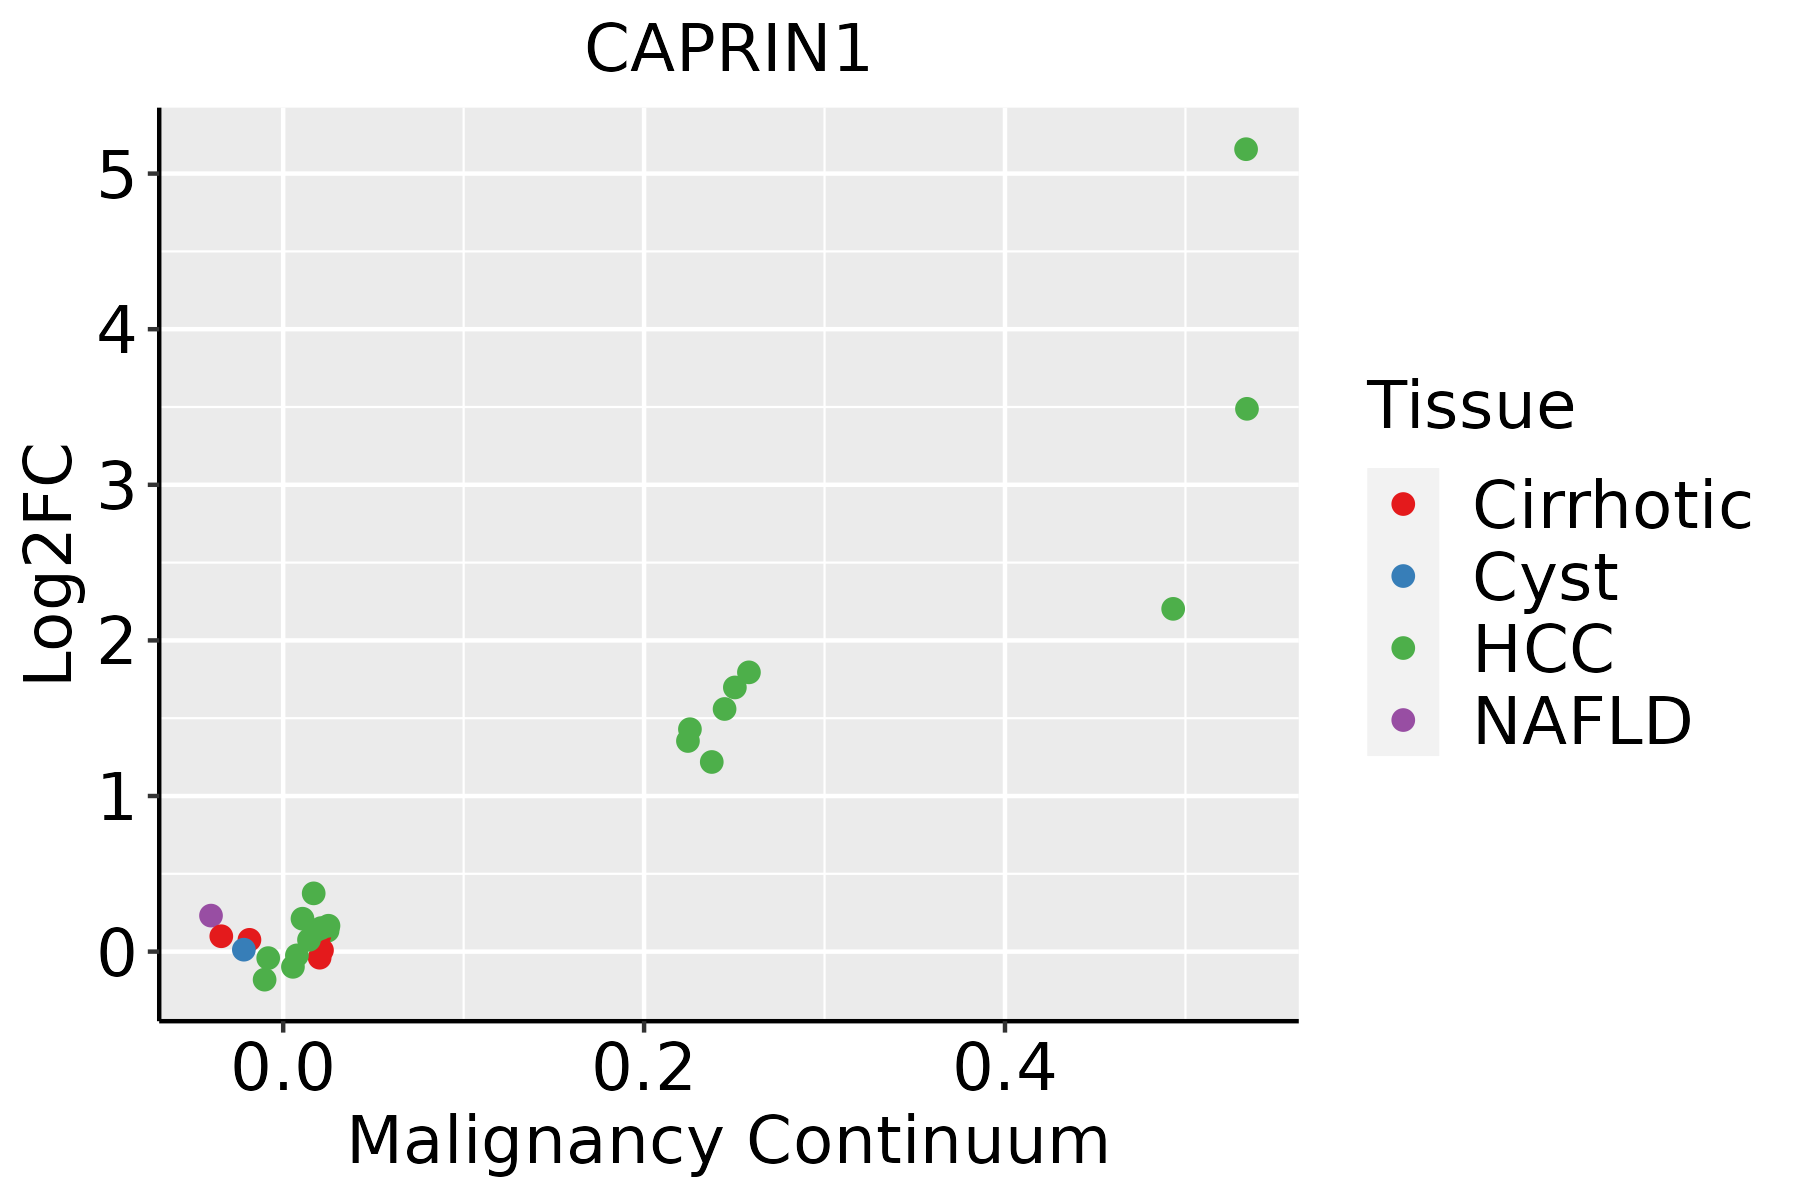 | HCC: Hepatocellular carcinoma |
| NAFLD: Non-alcoholic fatty liver disease |
| Oral Cavity | 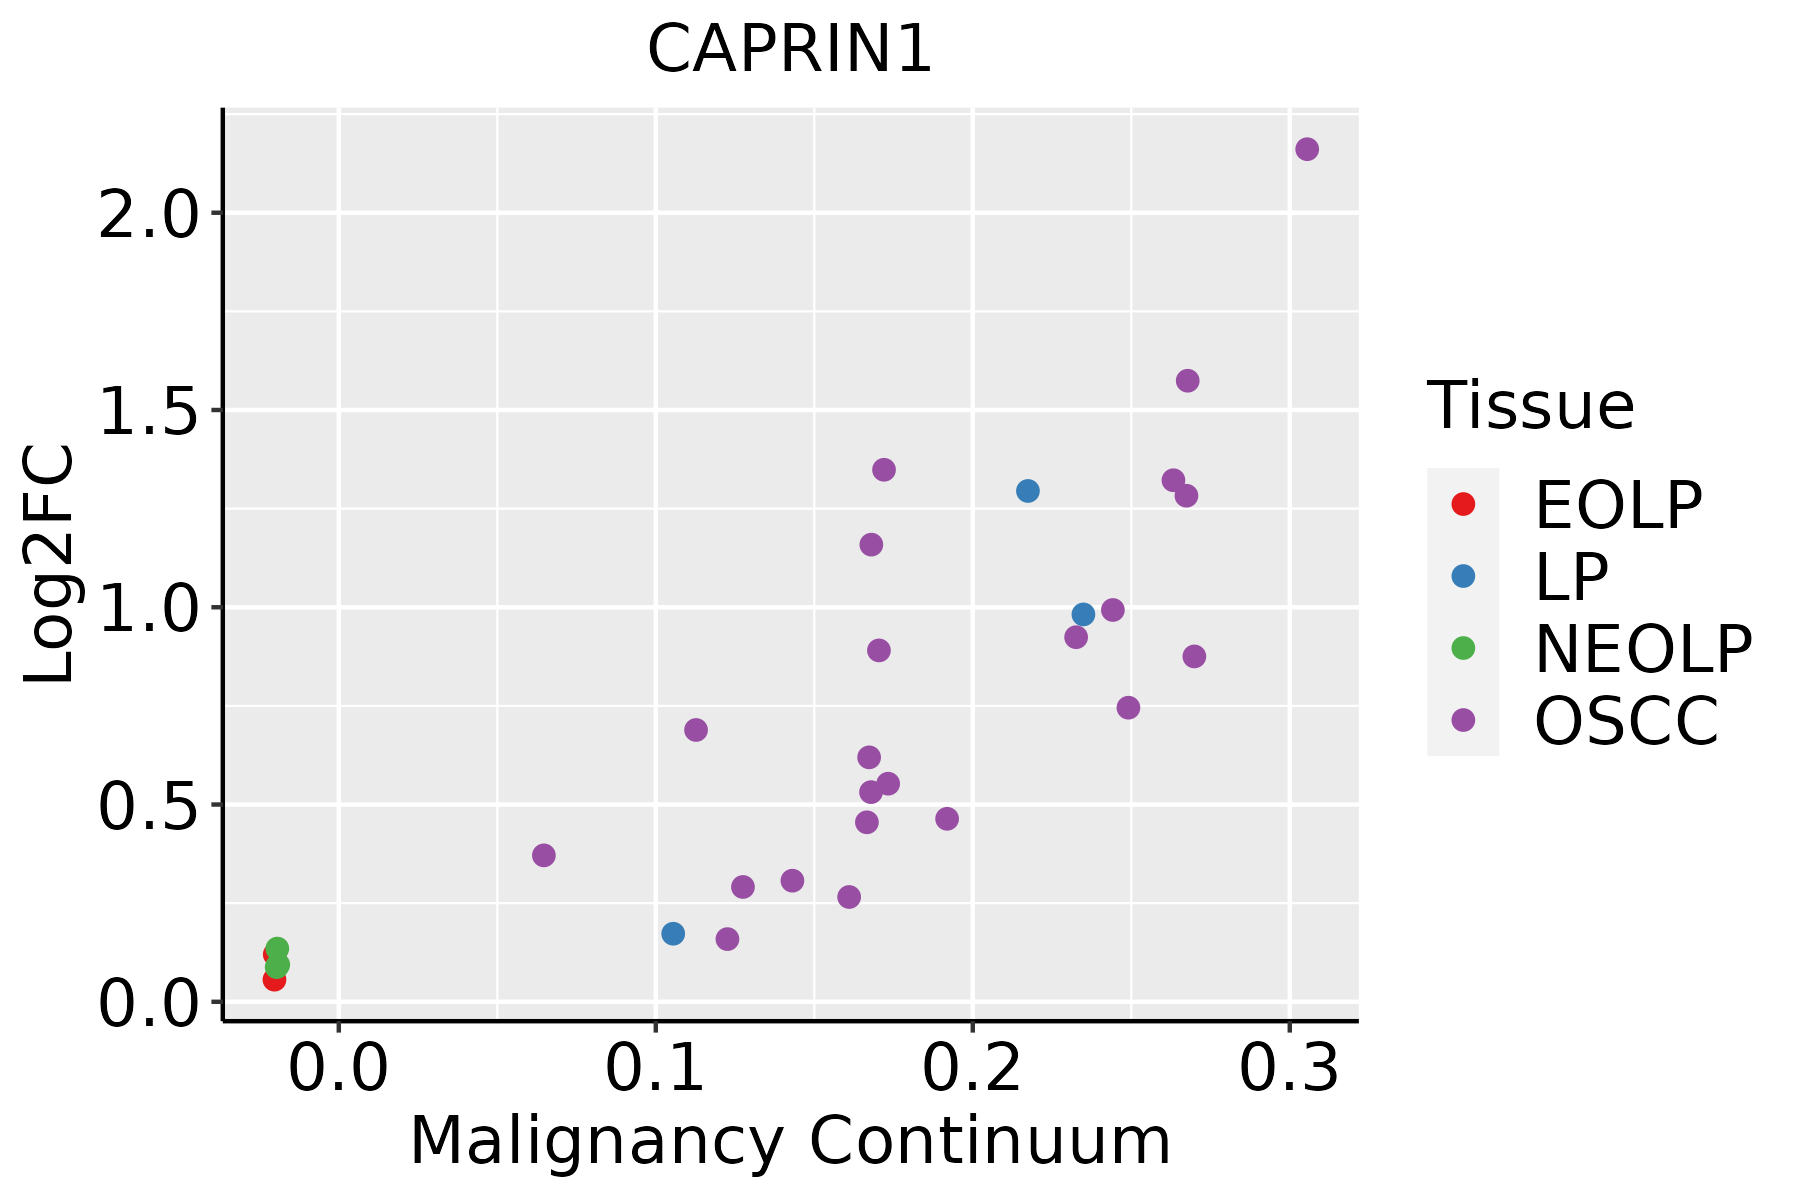 | EOLP: Erosive Oral lichen planus |
| LP: leukoplakia |
| NEOLP: Non-erosive oral lichen planus |
| OSCC: Oral squamous cell carcinoma |
| Prostate |  | BPH: Benign Prostatic Hyperplasia |
| Skin |  | AK: Actinic keratosis |
| cSCC: Cutaneous squamous cell carcinoma |
| SCCIS:squamous cell carcinoma in situ |
| Thyroid |  | ATC: Anaplastic thyroid cancer |
| HT: Hashimoto's thyroiditis |
| PTC: Papillary thyroid cancer |
| GO ID | Tissue | Disease Stage | Description | Gene Ratio | Bg Ratio | pvalue | p.adjust | Count |
| GO:00226042 | Colorectum | MSS | regulation of cell morphogenesis | 103/3467 | 309/18723 | 2.70e-10 | 2.56e-08 | 103 |
| GO:00064172 | Colorectum | MSS | regulation of translation | 134/3467 | 468/18723 | 4.43e-08 | 2.38e-06 | 134 |
| GO:01060272 | Colorectum | MSS | neuron projection organization | 34/3467 | 93/18723 | 3.04e-05 | 6.14e-04 | 34 |
| GO:00313462 | Colorectum | MSS | positive regulation of cell projection organization | 96/3467 | 353/18723 | 3.44e-05 | 6.70e-04 | 96 |
| GO:00107692 | Colorectum | MSS | regulation of cell morphogenesis involved in differentiation | 34/3467 | 96/18723 | 6.43e-05 | 1.12e-03 | 34 |
| GO:00109752 | Colorectum | MSS | regulation of neuron projection development | 115/3467 | 445/18723 | 6.91e-05 | 1.20e-03 | 115 |
| GO:00107702 | Colorectum | MSS | positive regulation of cell morphogenesis involved in differentiation | 29/3467 | 79/18723 | 1.04e-04 | 1.63e-03 | 29 |
| GO:00107202 | Colorectum | MSS | positive regulation of cell development | 81/3467 | 298/18723 | 1.38e-04 | 2.06e-03 | 81 |
| GO:00507671 | Colorectum | MSS | regulation of neurogenesis | 94/3467 | 364/18723 | 3.12e-04 | 4.06e-03 | 94 |
| GO:00970612 | Colorectum | MSS | dendritic spine organization | 29/3467 | 84/18723 | 3.54e-04 | 4.50e-03 | 29 |
| GO:00991732 | Colorectum | MSS | postsynapse organization | 48/3467 | 168/18723 | 9.32e-04 | 9.44e-03 | 48 |
| GO:00163582 | Colorectum | MSS | dendrite development | 65/3467 | 243/18723 | 9.41e-04 | 9.50e-03 | 65 |
| GO:0017148 | Colorectum | MSS | negative regulation of translation | 64/3467 | 245/18723 | 1.94e-03 | 1.67e-02 | 64 |
| GO:0034249 | Colorectum | MSS | negative regulation of cellular amide metabolic process | 70/3467 | 273/18723 | 2.07e-03 | 1.76e-02 | 70 |
| GO:00508082 | Colorectum | MSS | synapse organization | 101/3467 | 426/18723 | 3.96e-03 | 2.89e-02 | 101 |
| GO:0050769 | Colorectum | MSS | positive regulation of neurogenesis | 57/3467 | 225/18723 | 6.60e-03 | 4.38e-02 | 57 |
| GO:0051960 | Colorectum | MSS | regulation of nervous system development | 103/3467 | 443/18723 | 6.68e-03 | 4.38e-02 | 103 |
| GO:00226044 | Colorectum | FAP | regulation of cell morphogenesis | 87/2622 | 309/18723 | 4.89e-11 | 1.87e-08 | 87 |
| GO:00064174 | Colorectum | FAP | regulation of translation | 111/2622 | 468/18723 | 8.47e-09 | 1.13e-06 | 111 |
| GO:00109753 | Colorectum | FAP | regulation of neuron projection development | 102/2622 | 445/18723 | 2.04e-07 | 1.24e-05 | 102 |
| Hugo Symbol | Variant Class | Variant Classification | dbSNP RS | HGVSc | HGVSp | HGVSp Short | SWISSPROT | BIOTYPE | SIFT | PolyPhen | Tumor Sample Barcode | Tissue | Histology | Sex | Age | Stage | Therapy Types | Drugs | Outcome |
| CAPRIN1 | SNV | Missense_Mutation | rs772325651 | c.1624C>G | p.Gln542Glu | p.Q542E | Q14444 | protein_coding | tolerated(0.23) | possibly_damaging(0.814) | TCGA-AO-A12H-01 | Breast | breast invasive carcinoma | Female | >=65 | I/II | Hormone Therapy | arimidex | SD |
| CAPRIN1 | SNV | Missense_Mutation | novel | c.233A>G | p.Tyr78Cys | p.Y78C | Q14444 | protein_coding | deleterious(0.01) | benign(0.014) | TCGA-BH-A0HW-01 | Breast | breast invasive carcinoma | Female | <65 | I/II | Chemotherapy | doxorubicin | SD |
| CAPRIN1 | SNV | Missense_Mutation | novel | c.253N>A | p.Gly85Arg | p.G85R | Q14444 | protein_coding | deleterious(0) | probably_damaging(0.963) | TCGA-LL-A5YP-01 | Breast | breast invasive carcinoma | Female | <65 | I/II | Chemotherapy | cytoxan | SD |
| CAPRIN1 | SNV | Missense_Mutation | novel | c.1141N>A | p.Glu381Lys | p.E381K | Q14444 | protein_coding | deleterious(0) | possibly_damaging(0.828) | TCGA-PE-A5DE-01 | Breast | breast invasive carcinoma | Female | <65 | I/II | Chemotherapy | taxotere | CR |
| CAPRIN1 | SNV | Missense_Mutation | rs148571717 | c.1744N>G | p.Gln582Glu | p.Q582E | Q14444 | protein_coding | tolerated(0.44) | possibly_damaging(0.498) | TCGA-S3-AA17-01 | Breast | breast invasive carcinoma | Female | <65 | I/II | Hormone Therapy | anastrozole | SD |
| CAPRIN1 | SNV | Missense_Mutation | novel | c.395N>T | p.Arg132Leu | p.R132L | Q14444 | protein_coding | deleterious(0) | probably_damaging(0.998) | TCGA-C5-A8YR-01 | Cervix | cervical & endocervical cancer | Female | <65 | I/II | Unknown | Unknown | PD |
| CAPRIN1 | SNV | Missense_Mutation | | c.370C>G | p.Gln124Glu | p.Q124E | Q14444 | protein_coding | tolerated(0.14) | probably_damaging(0.98) | TCGA-EK-A2RC-01 | Cervix | cervical & endocervical cancer | Female | <65 | I/II | Unknown | Unknown | SD |
| CAPRIN1 | SNV | Missense_Mutation | | c.418N>C | p.Glu140Gln | p.E140Q | Q14444 | protein_coding | deleterious(0) | probably_damaging(0.998) | TCGA-Q1-A73O-01 | Cervix | cervical & endocervical cancer | Female | <65 | I/II | Chemotherapy | cisplatin | CR |
| CAPRIN1 | SNV | Missense_Mutation | | c.2054N>A | p.Gly685Glu | p.G685E | Q14444 | protein_coding | deleterious(0) | possibly_damaging(0.617) | TCGA-Q1-A73O-01 | Cervix | cervical & endocervical cancer | Female | <65 | I/II | Chemotherapy | cisplatin | CR |
| CAPRIN1 | SNV | Missense_Mutation | novel | c.1244C>G | p.Ser415Cys | p.S415C | Q14444 | protein_coding | deleterious(0) | probably_damaging(0.911) | TCGA-VS-A8Q8-01 | Cervix | cervical & endocervical cancer | Female | <65 | I/II | Unknown | Unknown | PD |


