
|
|||||
|
 | |
| |
| |
| |
| |
| |
|
Gene: CAPNS1 |
Gene summary for CAPNS1 |
| Gene information | Species | Human | Gene symbol | CAPNS1 | Gene ID | 826 |
| Gene name | calpain small subunit 1 | |
| Gene Alias | CALPAIN4 | |
| Cytomap | 19q13.12 | |
| Gene Type | protein-coding | GO ID | GO:0006508 | UniProtAcc | P04632 |
Top |
Malignant transformation analysis |
| Identification of the aberrant gene expression in precancerous and cancerous lesions by comparing the gene expression of stem-like cells in diseased tissues with normal stem cells |
| Entrez ID | Symbol | Replicates | Species | Organ | Tissue | Adj P-value | Log2FC | Malignancy |
| 826 | CAPNS1 | CA_HPV_1 | Human | Cervix | CC | 8.69e-04 | -1.61e-01 | 0.0264 |
| 826 | CAPNS1 | N_HPV_2 | Human | Cervix | N_HPV | 2.72e-02 | 6.46e-02 | -0.0131 |
| 826 | CAPNS1 | CCII_1 | Human | Cervix | CC | 2.11e-11 | -5.49e-01 | 0.3249 |
| 826 | CAPNS1 | Tumor | Human | Cervix | CC | 1.18e-23 | 5.52e-01 | 0.1241 |
| 826 | CAPNS1 | sample3 | Human | Cervix | CC | 3.47e-22 | 5.28e-01 | 0.1387 |
| 826 | CAPNS1 | T3 | Human | Cervix | CC | 8.21e-19 | 4.76e-01 | 0.1389 |
| 826 | CAPNS1 | HTA11_3410_2000001011 | Human | Colorectum | AD | 4.36e-46 | 1.02e+00 | 0.0155 |
| 826 | CAPNS1 | HTA11_2487_2000001011 | Human | Colorectum | SER | 1.65e-48 | 1.49e+00 | -0.1808 |
| 826 | CAPNS1 | HTA11_2951_2000001011 | Human | Colorectum | AD | 2.33e-17 | 1.17e+00 | 0.0216 |
| 826 | CAPNS1 | HTA11_1938_2000001011 | Human | Colorectum | AD | 5.28e-52 | 1.76e+00 | -0.0811 |
| 826 | CAPNS1 | HTA11_78_2000001011 | Human | Colorectum | AD | 7.76e-36 | 1.22e+00 | -0.1088 |
| 826 | CAPNS1 | HTA11_347_2000001011 | Human | Colorectum | AD | 6.31e-67 | 1.44e+00 | -0.1954 |
| 826 | CAPNS1 | HTA11_411_2000001011 | Human | Colorectum | SER | 3.13e-19 | 2.00e+00 | -0.2602 |
| 826 | CAPNS1 | HTA11_2112_2000001011 | Human | Colorectum | SER | 4.70e-15 | 1.47e+00 | -0.2196 |
| 826 | CAPNS1 | HTA11_3361_2000001011 | Human | Colorectum | AD | 3.94e-40 | 1.54e+00 | -0.1207 |
| 826 | CAPNS1 | HTA11_83_2000001011 | Human | Colorectum | SER | 2.19e-27 | 1.17e+00 | -0.1526 |
| 826 | CAPNS1 | HTA11_696_2000001011 | Human | Colorectum | AD | 1.47e-57 | 1.32e+00 | -0.1464 |
| 826 | CAPNS1 | HTA11_866_2000001011 | Human | Colorectum | AD | 1.83e-34 | 1.04e+00 | -0.1001 |
| 826 | CAPNS1 | HTA11_1391_2000001011 | Human | Colorectum | AD | 6.82e-48 | 1.64e+00 | -0.059 |
| 826 | CAPNS1 | HTA11_2992_2000001011 | Human | Colorectum | SER | 3.15e-16 | 1.18e+00 | -0.1706 |
| Page: 1 2 3 4 5 6 7 8 9 10 11 |
| Tissue | Expression Dynamics | Abbreviation |
| Cervix | 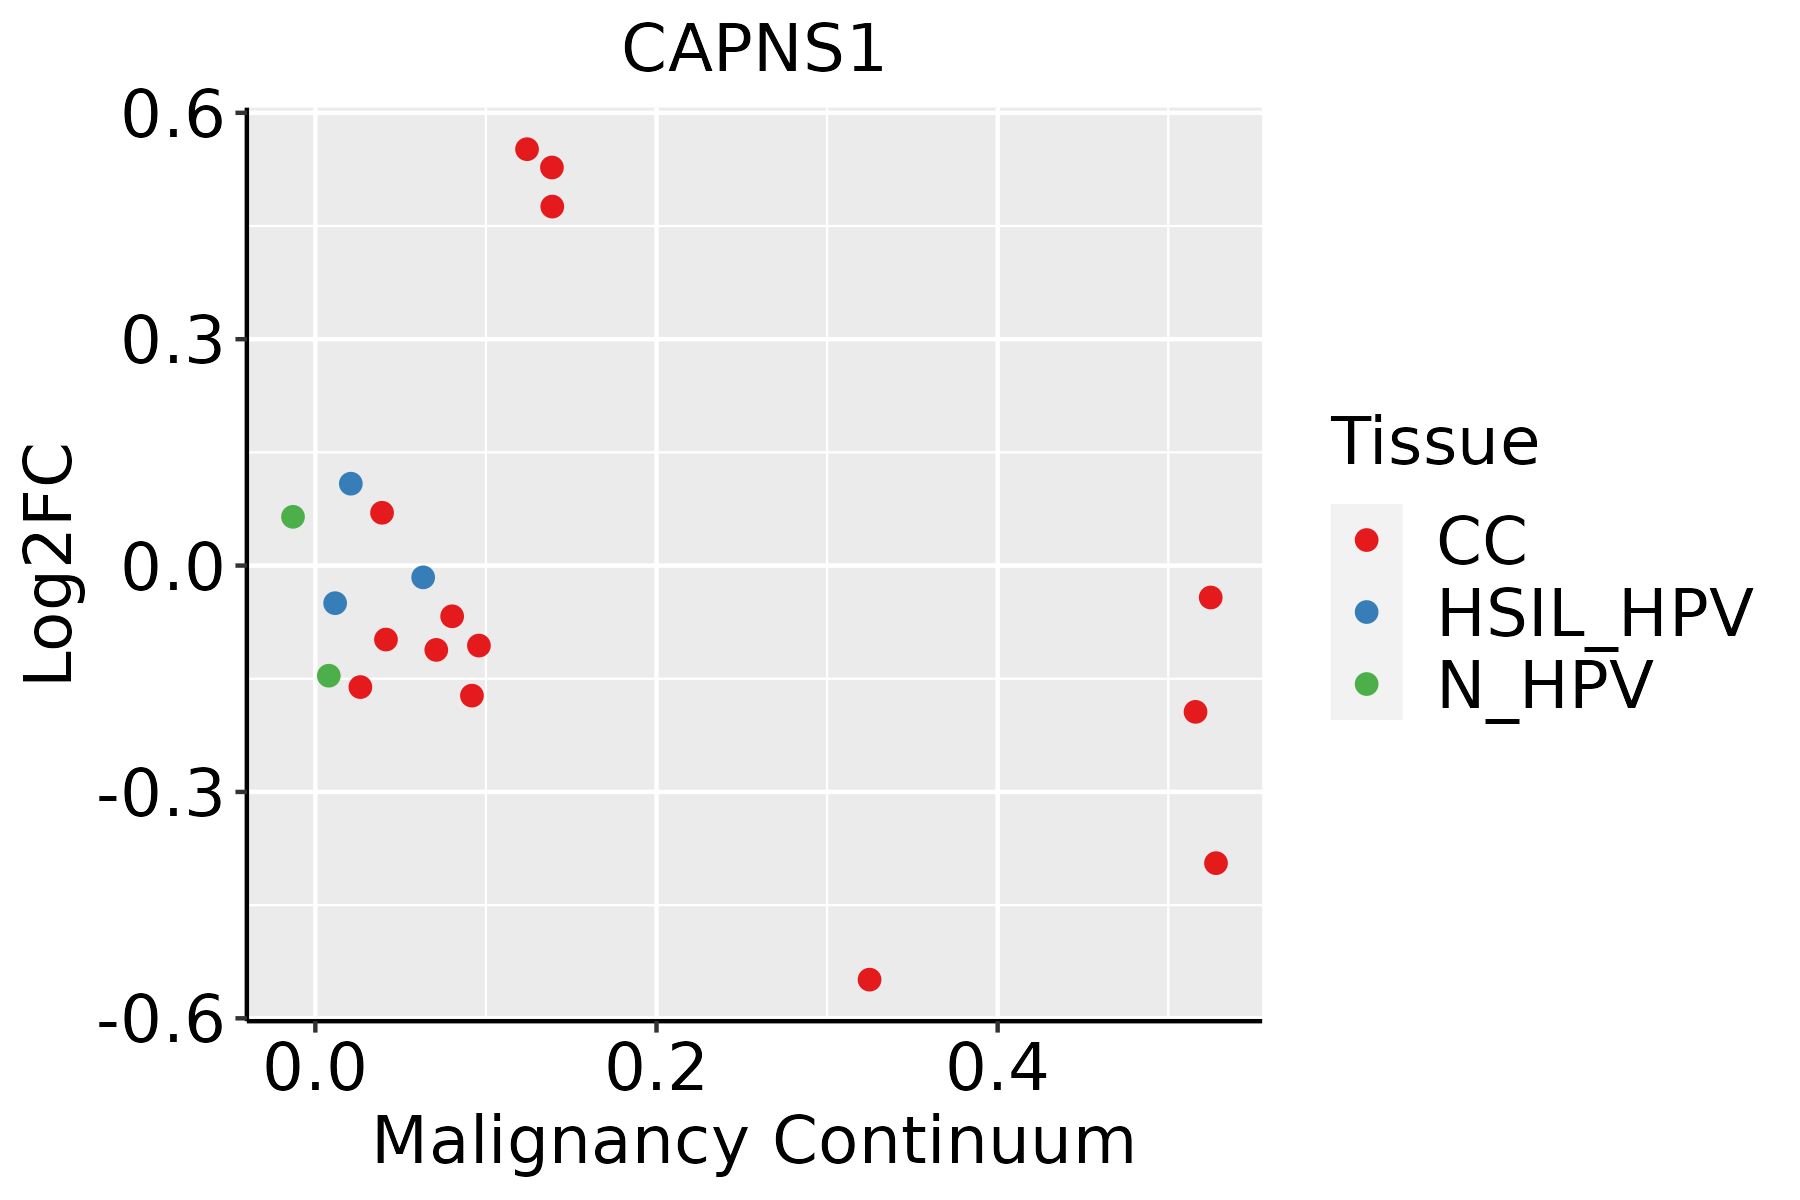 | CC: Cervix cancer |
| HSIL_HPV: HPV-infected high-grade squamous intraepithelial lesions | ||
| N_HPV: HPV-infected normal cervix | ||
| Colorectum (GSE201348) |  | FAP: Familial adenomatous polyposis |
| CRC: Colorectal cancer | ||
| Colorectum (HTA11) |  | AD: Adenomas |
| SER: Sessile serrated lesions | ||
| MSI-H: Microsatellite-high colorectal cancer | ||
| MSS: Microsatellite stable colorectal cancer | ||
| Endometrium | 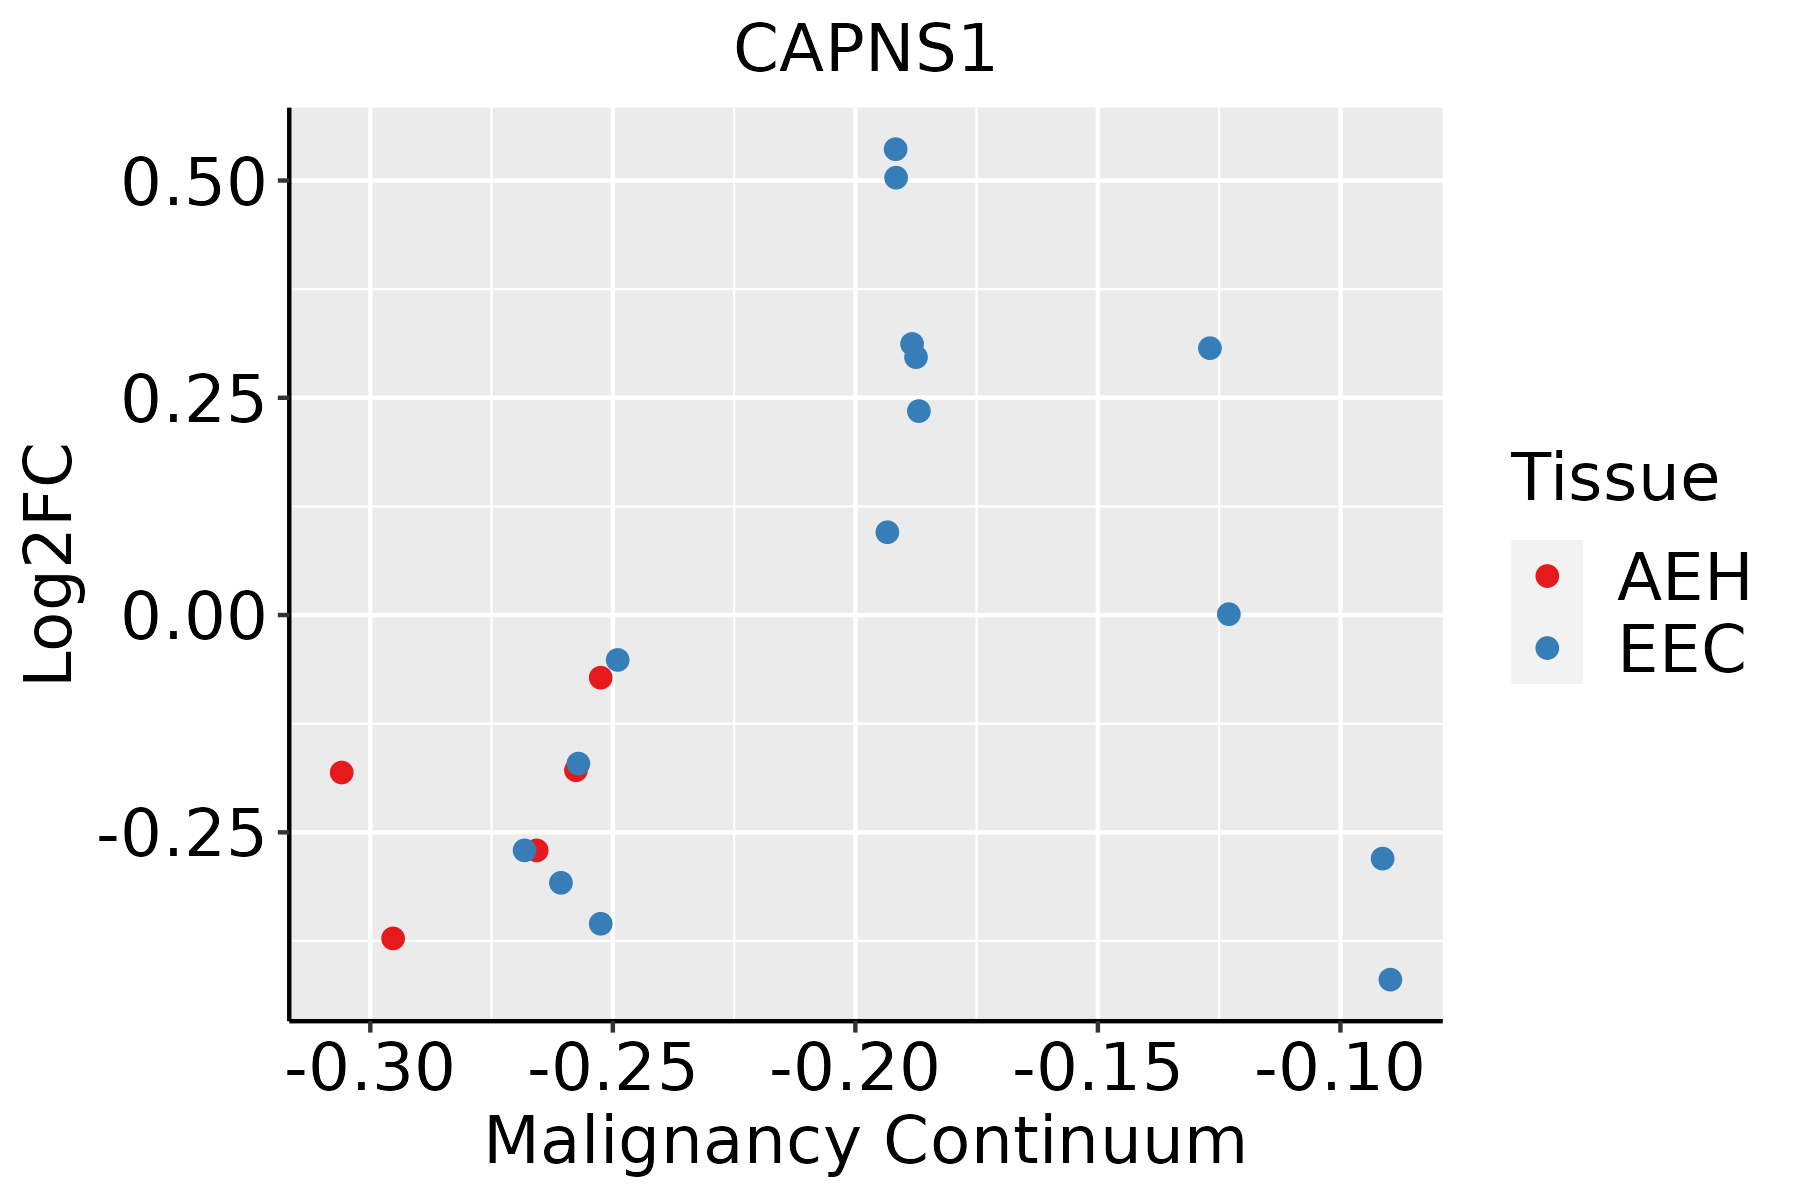 | AEH: Atypical endometrial hyperplasia |
| EEC: Endometrioid Cancer | ||
| Esophagus | 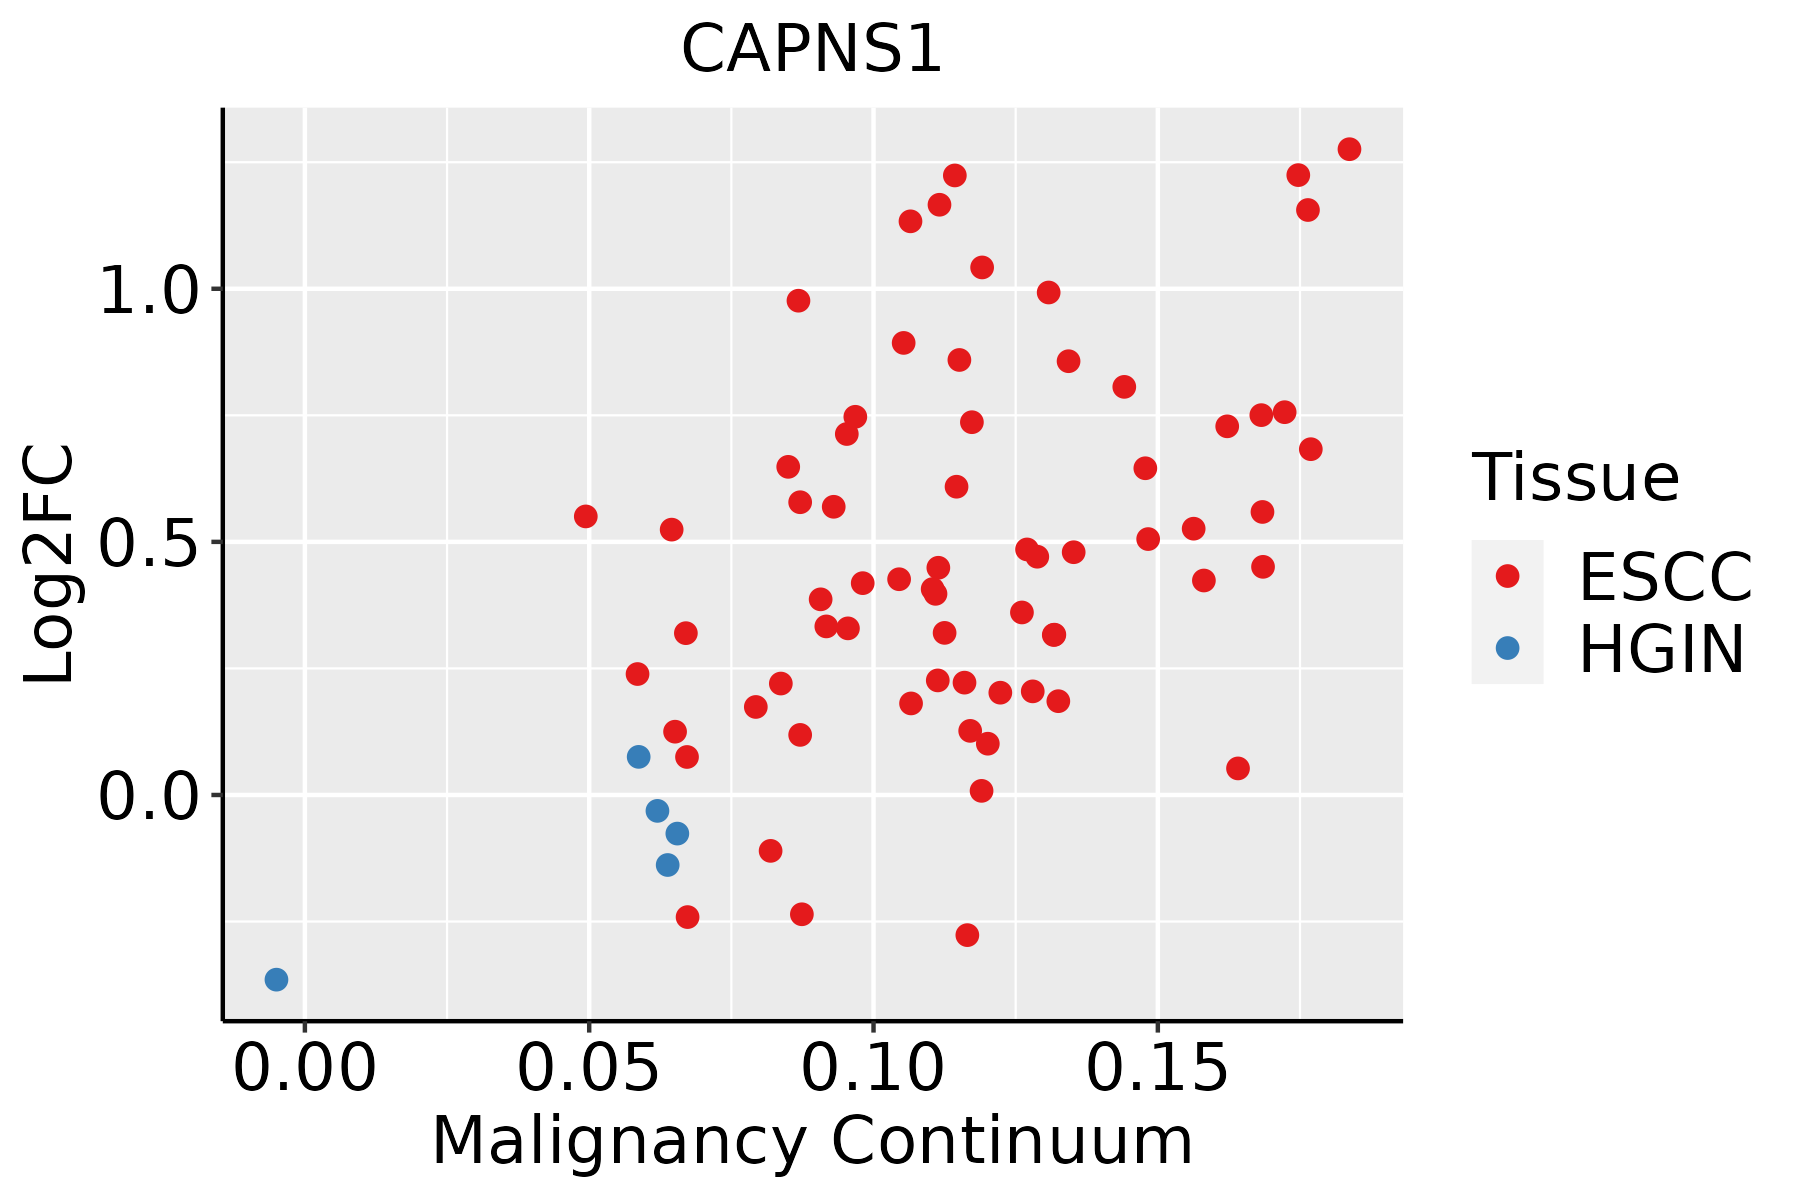 | ESCC: Esophageal squamous cell carcinoma |
| HGIN: High-grade intraepithelial neoplasias | ||
| LGIN: Low-grade intraepithelial neoplasias | ||
| Liver |  | HCC: Hepatocellular carcinoma |
| NAFLD: Non-alcoholic fatty liver disease | ||
| Oral Cavity |  | EOLP: Erosive Oral lichen planus |
| LP: leukoplakia | ||
| NEOLP: Non-erosive oral lichen planus | ||
| OSCC: Oral squamous cell carcinoma | ||
| Prostate | 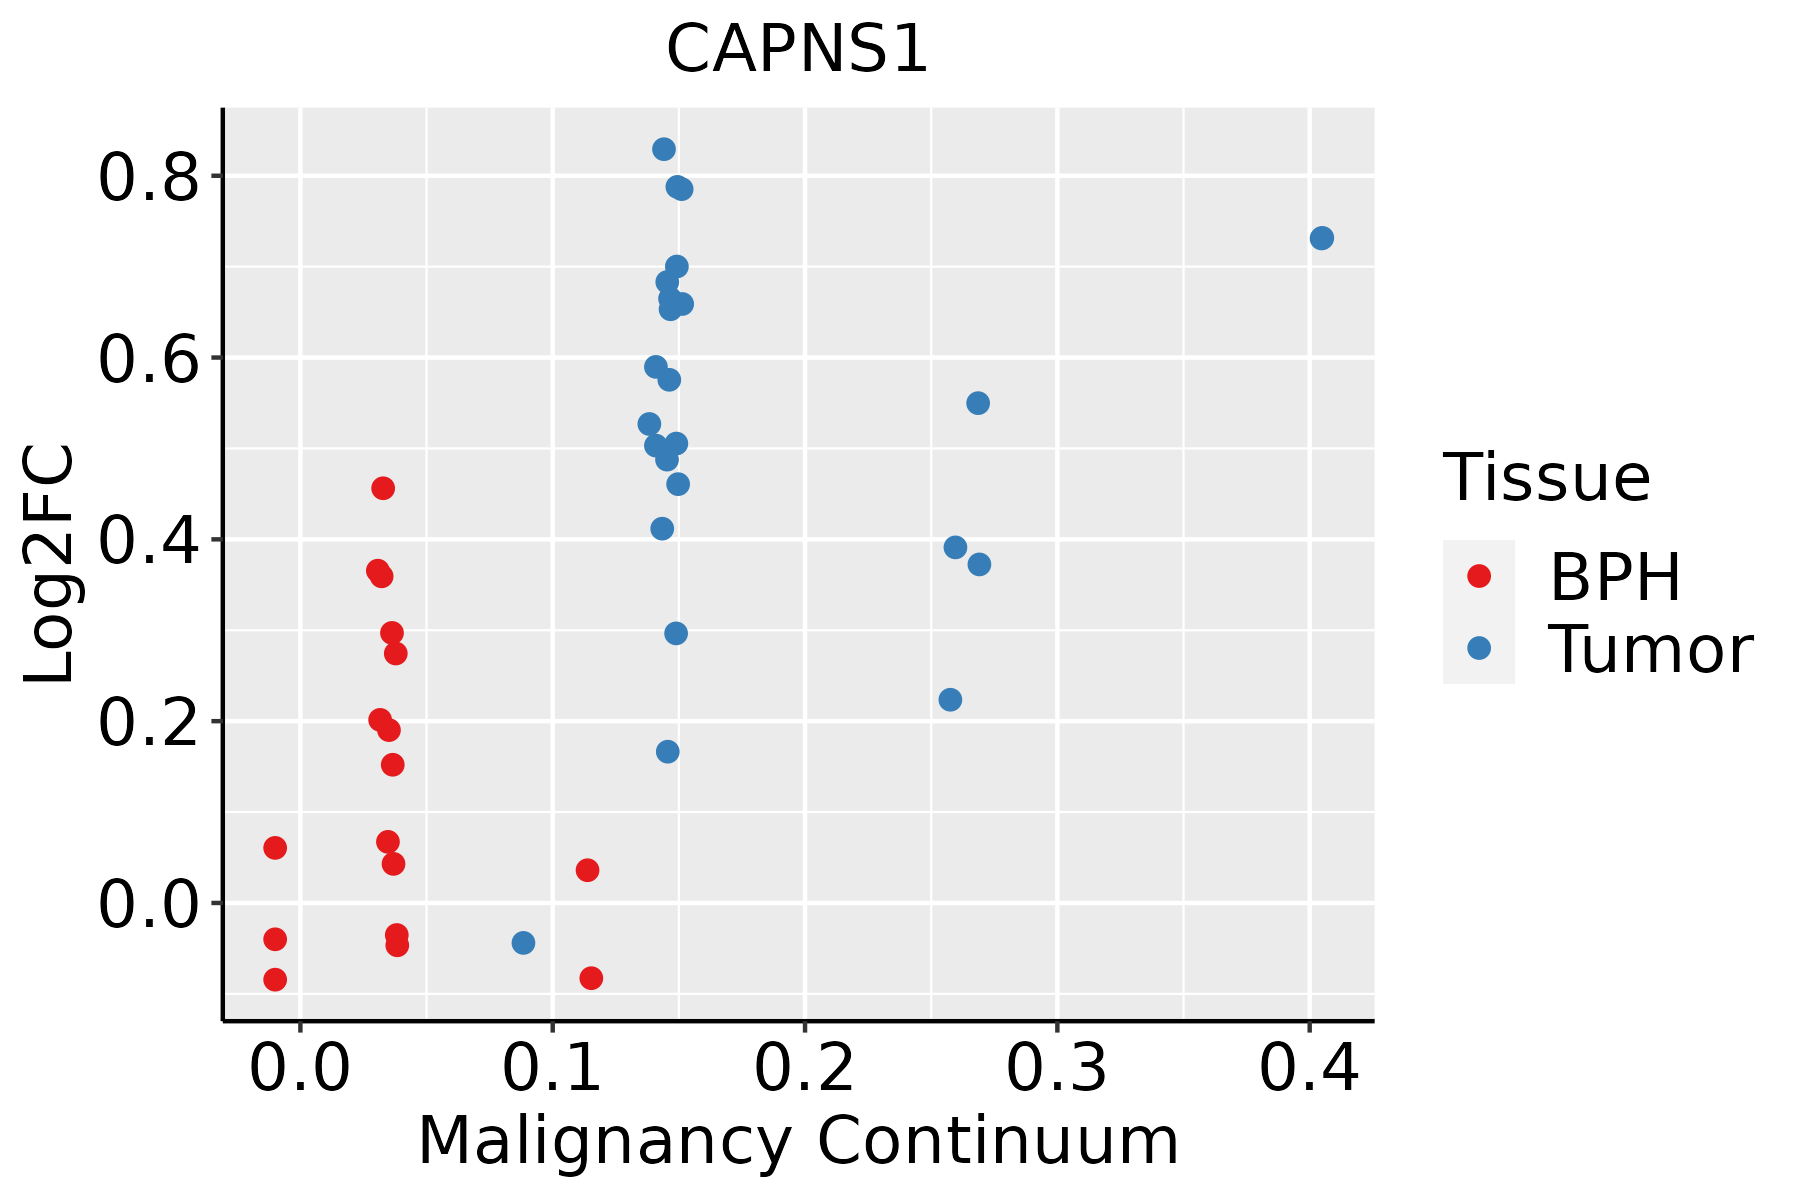 | BPH: Benign Prostatic Hyperplasia |
| Skin |  | AK: Actinic keratosis |
| cSCC: Cutaneous squamous cell carcinoma | ||
| SCCIS:squamous cell carcinoma in situ | ||
| Thyroid |  | ATC: Anaplastic thyroid cancer |
| HT: Hashimoto's thyroiditis | ||
| PTC: Papillary thyroid cancer |
| ∗log2FC in expression of this searched gene in stem-like cells from each diseased tissue sample relative to stem-like cells in normal samples in each tissue plotted against the malignancy continuum. Samples are colored based on if they are from different disease stage. |
Top |
Malignant transformation related pathway analysis |
| Find out the enriched GO biological processes and KEGG pathways involved in transition from healthy to precancer to cancer |
| Tissue | Disease Stage | Enriched GO biological Processes |
| Colorectum | AD |  |
| Colorectum | SER |  |
| Colorectum | MSS |  |
| Colorectum | MSI-H |  |
| Colorectum | FAP |  |
| ∗Top 15 enriched GO BP terms are showed in the bar plot of each disease state in each tissue. Each row represents a significant GO biological process which is colored according to the -log10(p.adjust). |
| Page: 1 2 3 4 5 6 7 8 9 |
| GO ID | Tissue | Disease Stage | Description | Gene Ratio | Bg Ratio | pvalue | p.adjust | Count |
| GO:00162367 | Cervix | CC | macroautophagy | 58/2311 | 291/18723 | 1.40e-04 | 1.70e-03 | 58 |
| GO:00105067 | Cervix | CC | regulation of autophagy | 61/2311 | 317/18723 | 2.61e-04 | 2.87e-03 | 61 |
| GO:0010506 | Colorectum | AD | regulation of autophagy | 111/3918 | 317/18723 | 3.57e-09 | 2.35e-07 | 111 |
| GO:0016236 | Colorectum | AD | macroautophagy | 103/3918 | 291/18723 | 6.76e-09 | 4.15e-07 | 103 |
| GO:0016241 | Colorectum | AD | regulation of macroautophagy | 50/3918 | 141/18723 | 4.55e-05 | 7.92e-04 | 50 |
| GO:00162361 | Colorectum | SER | macroautophagy | 79/2897 | 291/18723 | 1.97e-07 | 1.10e-05 | 79 |
| GO:00105061 | Colorectum | SER | regulation of autophagy | 74/2897 | 317/18723 | 1.39e-04 | 2.77e-03 | 74 |
| GO:00162411 | Colorectum | SER | regulation of macroautophagy | 34/2897 | 141/18723 | 4.74e-03 | 3.72e-02 | 34 |
| GO:00162362 | Colorectum | MSS | macroautophagy | 93/3467 | 291/18723 | 2.08e-08 | 1.17e-06 | 93 |
| GO:00105062 | Colorectum | MSS | regulation of autophagy | 95/3467 | 317/18723 | 4.36e-07 | 1.71e-05 | 95 |
| GO:00162412 | Colorectum | MSS | regulation of macroautophagy | 44/3467 | 141/18723 | 1.88e-04 | 2.64e-03 | 44 |
| GO:00162368 | Endometrium | AEH | macroautophagy | 52/2100 | 291/18723 | 4.56e-04 | 4.80e-03 | 52 |
| GO:00105068 | Endometrium | AEH | regulation of autophagy | 54/2100 | 317/18723 | 1.15e-03 | 9.97e-03 | 54 |
| GO:001623613 | Endometrium | EEC | macroautophagy | 53/2168 | 291/18723 | 5.40e-04 | 5.42e-03 | 53 |
| GO:001050613 | Endometrium | EEC | regulation of autophagy | 55/2168 | 317/18723 | 1.40e-03 | 1.14e-02 | 55 |
| GO:001050616 | Esophagus | HGIN | regulation of autophagy | 84/2587 | 317/18723 | 1.39e-09 | 1.08e-07 | 84 |
| GO:001623616 | Esophagus | HGIN | macroautophagy | 77/2587 | 291/18723 | 7.15e-09 | 4.61e-07 | 77 |
| GO:00162418 | Esophagus | HGIN | regulation of macroautophagy | 38/2587 | 141/18723 | 2.80e-05 | 7.21e-04 | 38 |
| GO:001623617 | Esophagus | ESCC | macroautophagy | 216/8552 | 291/18723 | 1.94e-23 | 4.57e-21 | 216 |
| GO:001050617 | Esophagus | ESCC | regulation of autophagy | 220/8552 | 317/18723 | 6.72e-18 | 6.36e-16 | 220 |
| Page: 1 2 3 |
| Pathway ID | Tissue | Disease Stage | Description | Gene Ratio | Bg Ratio | pvalue | p.adjust | qvalue | Count |
| hsa0513120 | Cervix | CC | Shigellosis | 69/1267 | 247/8465 | 7.64e-08 | 1.03e-06 | 6.10e-07 | 69 |
| hsa05131110 | Cervix | CC | Shigellosis | 69/1267 | 247/8465 | 7.64e-08 | 1.03e-06 | 6.10e-07 | 69 |
| hsa0513145 | Cervix | N_HPV | Shigellosis | 23/349 | 247/8465 | 2.10e-04 | 1.75e-03 | 1.37e-03 | 23 |
| hsa0513155 | Cervix | N_HPV | Shigellosis | 23/349 | 247/8465 | 2.10e-04 | 1.75e-03 | 1.37e-03 | 23 |
| hsa05131 | Colorectum | AD | Shigellosis | 109/2092 | 247/8465 | 1.09e-11 | 2.44e-10 | 1.55e-10 | 109 |
| hsa051311 | Colorectum | AD | Shigellosis | 109/2092 | 247/8465 | 1.09e-11 | 2.44e-10 | 1.55e-10 | 109 |
| hsa051312 | Colorectum | SER | Shigellosis | 87/1580 | 247/8465 | 3.07e-10 | 7.27e-09 | 5.28e-09 | 87 |
| hsa051313 | Colorectum | SER | Shigellosis | 87/1580 | 247/8465 | 3.07e-10 | 7.27e-09 | 5.28e-09 | 87 |
| hsa051314 | Colorectum | MSS | Shigellosis | 94/1875 | 247/8465 | 6.82e-09 | 1.34e-07 | 8.23e-08 | 94 |
| hsa051315 | Colorectum | MSS | Shigellosis | 94/1875 | 247/8465 | 6.82e-09 | 1.34e-07 | 8.23e-08 | 94 |
| hsa051316 | Colorectum | MSI-H | Shigellosis | 40/797 | 247/8465 | 4.28e-04 | 5.34e-03 | 4.47e-03 | 40 |
| hsa051317 | Colorectum | MSI-H | Shigellosis | 40/797 | 247/8465 | 4.28e-04 | 5.34e-03 | 4.47e-03 | 40 |
| hsa0513126 | Endometrium | AEH | Shigellosis | 78/1197 | 247/8465 | 9.23e-13 | 2.00e-11 | 1.46e-11 | 78 |
| hsa05131111 | Endometrium | AEH | Shigellosis | 78/1197 | 247/8465 | 9.23e-13 | 2.00e-11 | 1.46e-11 | 78 |
| hsa0513127 | Endometrium | EEC | Shigellosis | 79/1237 | 247/8465 | 1.80e-12 | 3.95e-11 | 2.95e-11 | 79 |
| hsa0513136 | Endometrium | EEC | Shigellosis | 79/1237 | 247/8465 | 1.80e-12 | 3.95e-11 | 2.95e-11 | 79 |
| hsa0513139 | Esophagus | HGIN | Shigellosis | 71/1383 | 247/8465 | 4.89e-07 | 7.98e-06 | 6.34e-06 | 71 |
| hsa05131114 | Esophagus | HGIN | Shigellosis | 71/1383 | 247/8465 | 4.89e-07 | 7.98e-06 | 6.34e-06 | 71 |
| hsa05131211 | Esophagus | ESCC | Shigellosis | 176/4205 | 247/8465 | 2.27e-12 | 4.01e-11 | 2.05e-11 | 176 |
| hsa05131310 | Esophagus | ESCC | Shigellosis | 176/4205 | 247/8465 | 2.27e-12 | 4.01e-11 | 2.05e-11 | 176 |
| Page: 1 2 |
Top |
Cell-cell communication analysis |
| Identification of potential cell-cell interactions between two cell types and their ligand-receptor pairs for different disease states |
| Ligand | Receptor | LRpair | Pathway | Tissue | Disease Stage |
| Page: 1 |
Top |
Single-cell gene regulatory network inference analysis |
| Find out the significant the regulons (TFs) and the target genes of each regulon across cell types for different disease states |
| TF | Cell Type | Tissue | Disease Stage | Target Gene | RSS | Regulon Activity |
| ∗The dot plots of a searched regulon are shown for all cell subpopulations in each disease state of each tissue based on the regulon specific score inferred using pySCENIC and by calculating the average expression. |
| Page: 1 |
Top |
Somatic mutation of malignant transformation related genes |
| Annotation of somatic variants for genes involved in malignant transformation |
| Hugo Symbol | Variant Class | Variant Classification | dbSNP RS | HGVSc | HGVSp | HGVSp Short | SWISSPROT | BIOTYPE | SIFT | PolyPhen | Tumor Sample Barcode | Tissue | Histology | Sex | Age | Stage | Therapy Types | Drugs | Outcome |
| CAPNS1 | SNV | Missense_Mutation | rs768772206 | c.31N>T | p.Gly11Cys | p.G11C | P04632 | protein_coding | deleterious_low_confidence(0) | probably_damaging(0.975) | TCGA-C8-A1HL-01 | Breast | breast invasive carcinoma | Female | <65 | III/IV | Unknown | Unknown | SD |
| CAPNS1 | SNV | Missense_Mutation | novel | c.101N>A | p.Ser34Asn | p.S34N | P04632 | protein_coding | tolerated_low_confidence(0.08) | benign(0.014) | TCGA-2W-A8YY-01 | Cervix | cervical & endocervical cancer | Female | <65 | I/II | Chemotherapy | cisplatin | CR |
| CAPNS1 | SNV | Missense_Mutation | novel | c.445N>A | p.Ala149Thr | p.A149T | P04632 | protein_coding | deleterious(0.03) | probably_damaging(0.982) | TCGA-2W-A8YY-01 | Cervix | cervical & endocervical cancer | Female | <65 | I/II | Chemotherapy | cisplatin | CR |
| CAPNS1 | SNV | Missense_Mutation | novel | c.289N>C | p.Glu97Gln | p.E97Q | P04632 | protein_coding | tolerated(0.07) | probably_damaging(0.95) | TCGA-C5-A1BJ-01 | Cervix | cervical & endocervical cancer | Female | <65 | I/II | Unknown | Unknown | SD |
| CAPNS1 | SNV | Missense_Mutation | novel | c.803N>T | p.Ser268Phe | p.S268F | P04632 | protein_coding | deleterious(0) | probably_damaging(0.995) | TCGA-FU-A23L-01 | Cervix | cervical & endocervical cancer | Female | <65 | I/II | Chemotherapy | cisplatin | CR |
| CAPNS1 | SNV | Missense_Mutation | novel | c.759A>C | p.Gln253His | p.Q253H | P04632 | protein_coding | tolerated(0.4) | benign(0.012) | TCGA-AA-3984-01 | Colorectum | colon adenocarcinoma | Female | <65 | I/II | Unknown | Unknown | SD |
| CAPNS1 | SNV | Missense_Mutation | c.292N>A | p.Val98Ile | p.V98I | P04632 | protein_coding | tolerated(0.52) | benign(0.005) | TCGA-F4-6570-01 | Colorectum | colon adenocarcinoma | Female | >=65 | I/II | Unknown | Unknown | SD | |
| CAPNS1 | SNV | Missense_Mutation | c.614N>C | p.Leu205Pro | p.L205P | P04632 | protein_coding | deleterious(0.01) | probably_damaging(1) | TCGA-F4-6856-01 | Colorectum | colon adenocarcinoma | Male | <65 | I/II | Ancillary | leucovorin | CR | |
| CAPNS1 | SNV | Missense_Mutation | novel | c.583C>A | p.Pro195Thr | p.P195T | P04632 | protein_coding | deleterious(0.05) | possibly_damaging(0.791) | TCGA-A5-A0G2-01 | Endometrium | uterine corpus endometrioid carcinoma | Female | <65 | III/IV | Unknown | Unknown | SD |
| CAPNS1 | SNV | Missense_Mutation | novel | c.623A>G | p.His208Arg | p.H208R | P04632 | protein_coding | tolerated(0.06) | benign(0) | TCGA-AJ-A3EK-01 | Endometrium | uterine corpus endometrioid carcinoma | Female | <65 | I/II | Chemotherapy | carboplatin | CR |
| Page: 1 2 3 |
Top |
Related drugs of malignant transformation related genes |
| Identification of chemicals and drugs interact with genes involved in malignant transfromation |
| (DGIdb 4.0) |
| Entrez ID | Symbol | Category | Interaction Types | Drug Claim Name | Drug Name | PMIDs |
| Page: 1 |

Copyright 2023-Present -The University of Texas Health Science Center at Houston |