
|
|||||
|
 | |
| |
| |
| |
| |
| |
|
Gene: CAPN7 |
Gene summary for CAPN7 |
| Gene information | Species | Human | Gene symbol | CAPN7 | Gene ID | 23473 |
| Gene name | calpain 7 | |
| Gene Alias | CALPAIN7 | |
| Cytomap | 3p25.1 | |
| Gene Type | protein-coding | GO ID | GO:0001667 | UniProtAcc | Q7Z479 |
Top |
Malignant transformation analysis |
| Identification of the aberrant gene expression in precancerous and cancerous lesions by comparing the gene expression of stem-like cells in diseased tissues with normal stem cells |
| Entrez ID | Symbol | Replicates | Species | Organ | Tissue | Adj P-value | Log2FC | Malignancy |
| 23473 | CAPN7 | LZE4T | Human | Esophagus | ESCC | 6.15e-07 | 2.47e-01 | 0.0811 |
| 23473 | CAPN7 | LZE7T | Human | Esophagus | ESCC | 9.78e-03 | 2.47e-01 | 0.0667 |
| 23473 | CAPN7 | LZE20T | Human | Esophagus | ESCC | 1.93e-03 | 1.37e-01 | 0.0662 |
| 23473 | CAPN7 | LZE24T | Human | Esophagus | ESCC | 1.45e-11 | 3.02e-01 | 0.0596 |
| 23473 | CAPN7 | P2T-E | Human | Esophagus | ESCC | 3.51e-16 | 3.33e-01 | 0.1177 |
| 23473 | CAPN7 | P4T-E | Human | Esophagus | ESCC | 5.70e-20 | 4.42e-01 | 0.1323 |
| 23473 | CAPN7 | P5T-E | Human | Esophagus | ESCC | 8.24e-32 | 5.72e-01 | 0.1327 |
| 23473 | CAPN7 | P8T-E | Human | Esophagus | ESCC | 8.43e-16 | 2.66e-01 | 0.0889 |
| 23473 | CAPN7 | P9T-E | Human | Esophagus | ESCC | 4.54e-13 | 2.26e-01 | 0.1131 |
| 23473 | CAPN7 | P10T-E | Human | Esophagus | ESCC | 3.45e-20 | 4.06e-01 | 0.116 |
| 23473 | CAPN7 | P11T-E | Human | Esophagus | ESCC | 2.09e-15 | 4.68e-01 | 0.1426 |
| 23473 | CAPN7 | P12T-E | Human | Esophagus | ESCC | 1.32e-21 | 3.51e-01 | 0.1122 |
| 23473 | CAPN7 | P15T-E | Human | Esophagus | ESCC | 7.44e-09 | 2.08e-01 | 0.1149 |
| 23473 | CAPN7 | P16T-E | Human | Esophagus | ESCC | 6.88e-21 | 2.89e-01 | 0.1153 |
| 23473 | CAPN7 | P17T-E | Human | Esophagus | ESCC | 9.46e-09 | 2.59e-01 | 0.1278 |
| 23473 | CAPN7 | P20T-E | Human | Esophagus | ESCC | 2.69e-19 | 5.05e-01 | 0.1124 |
| 23473 | CAPN7 | P21T-E | Human | Esophagus | ESCC | 3.73e-21 | 3.32e-01 | 0.1617 |
| 23473 | CAPN7 | P22T-E | Human | Esophagus | ESCC | 1.03e-20 | 2.90e-01 | 0.1236 |
| 23473 | CAPN7 | P23T-E | Human | Esophagus | ESCC | 8.77e-24 | 5.50e-01 | 0.108 |
| 23473 | CAPN7 | P24T-E | Human | Esophagus | ESCC | 4.84e-13 | 2.44e-01 | 0.1287 |
| Page: 1 2 3 4 5 |
| Tissue | Expression Dynamics | Abbreviation |
| Esophagus | 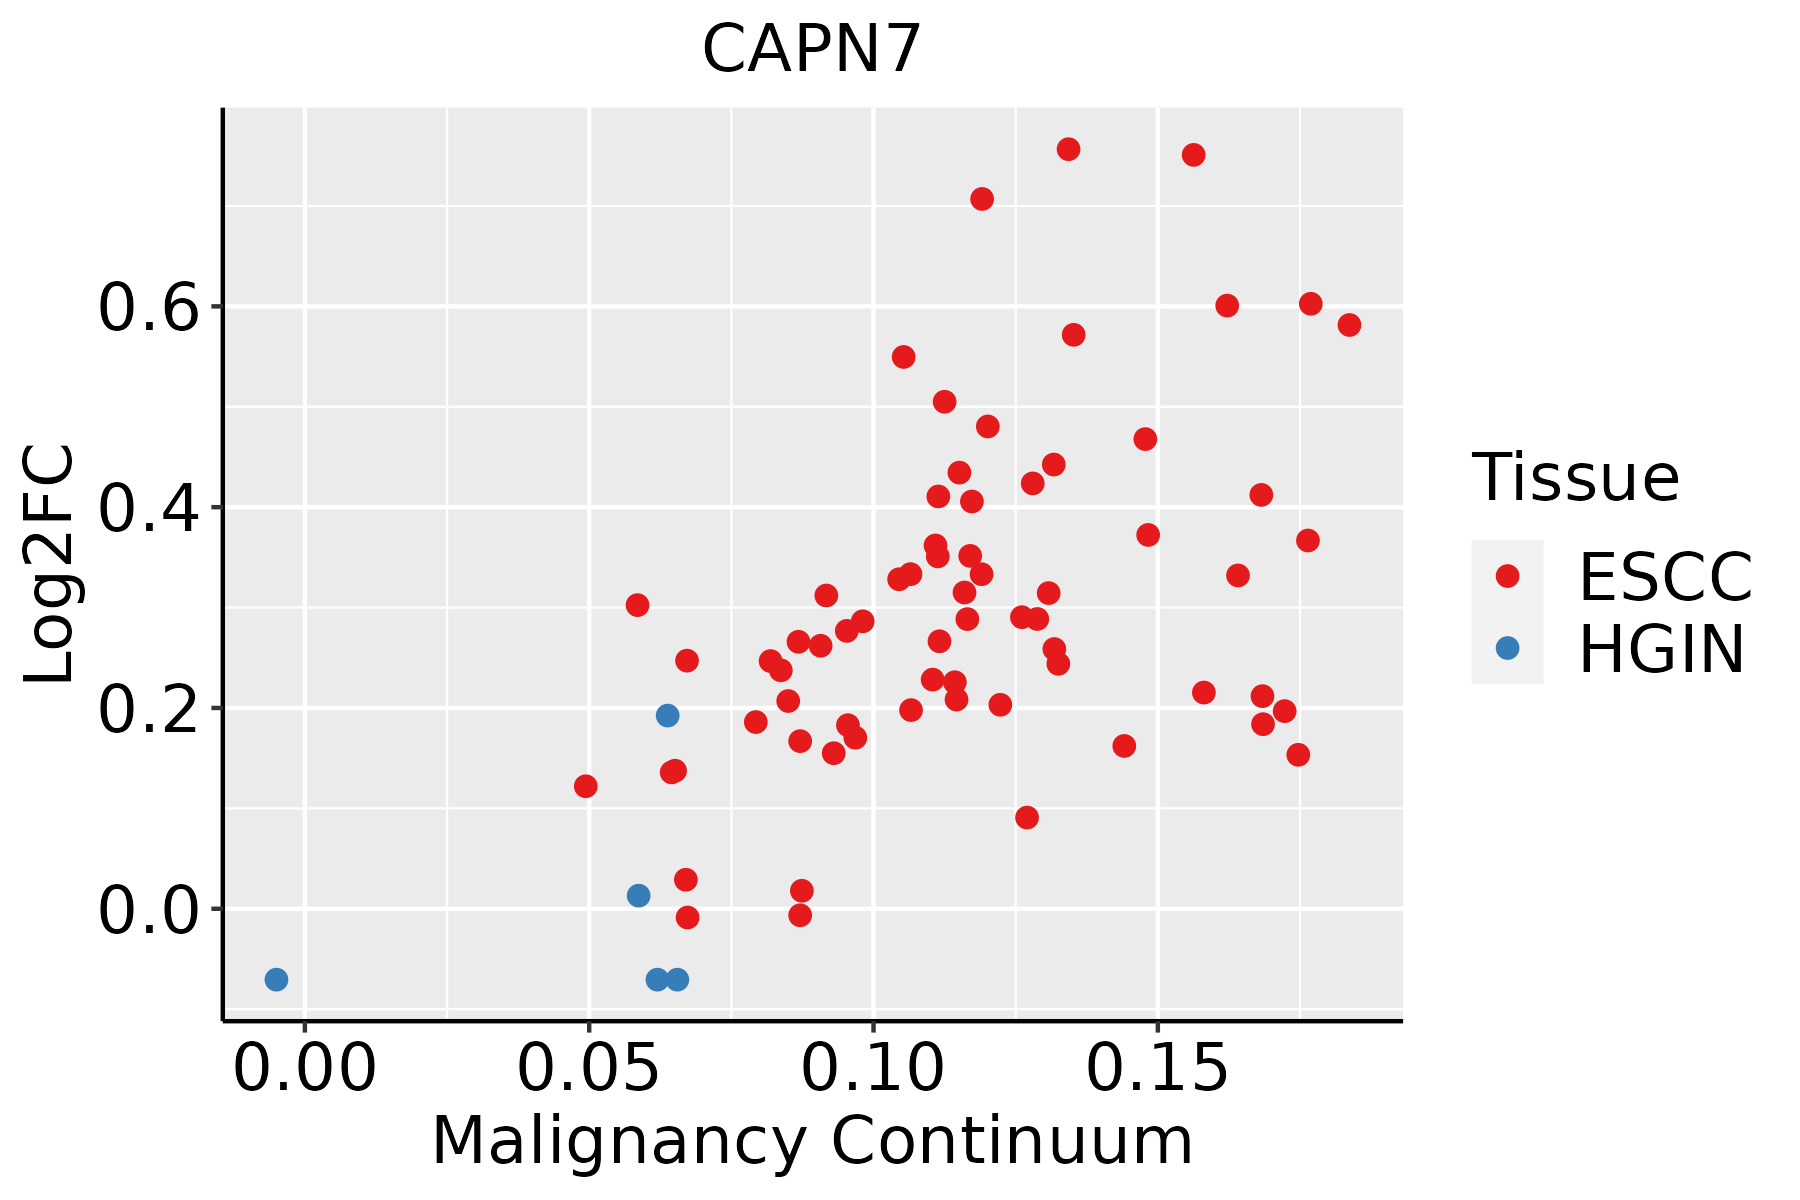 | ESCC: Esophageal squamous cell carcinoma |
| HGIN: High-grade intraepithelial neoplasias | ||
| LGIN: Low-grade intraepithelial neoplasias | ||
| Liver | 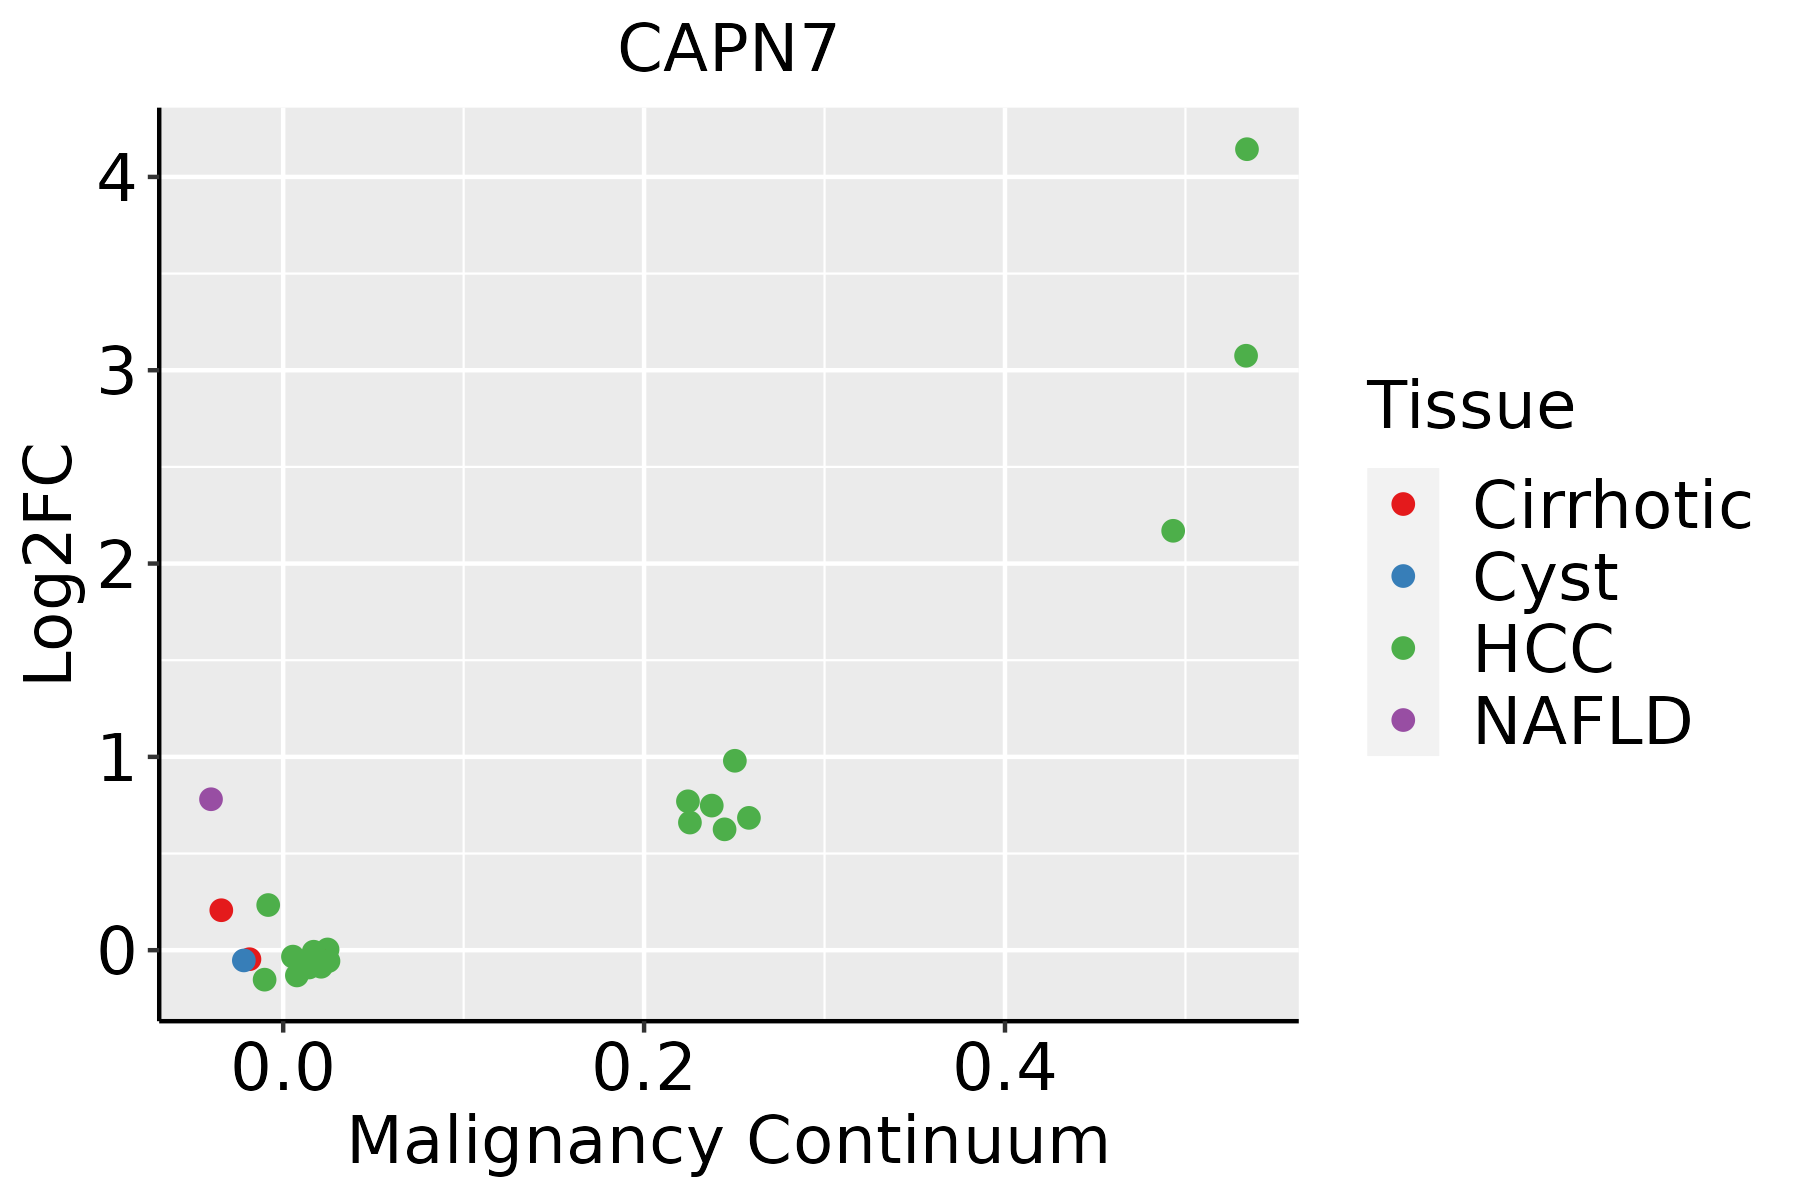 | HCC: Hepatocellular carcinoma |
| NAFLD: Non-alcoholic fatty liver disease | ||
| Thyroid | 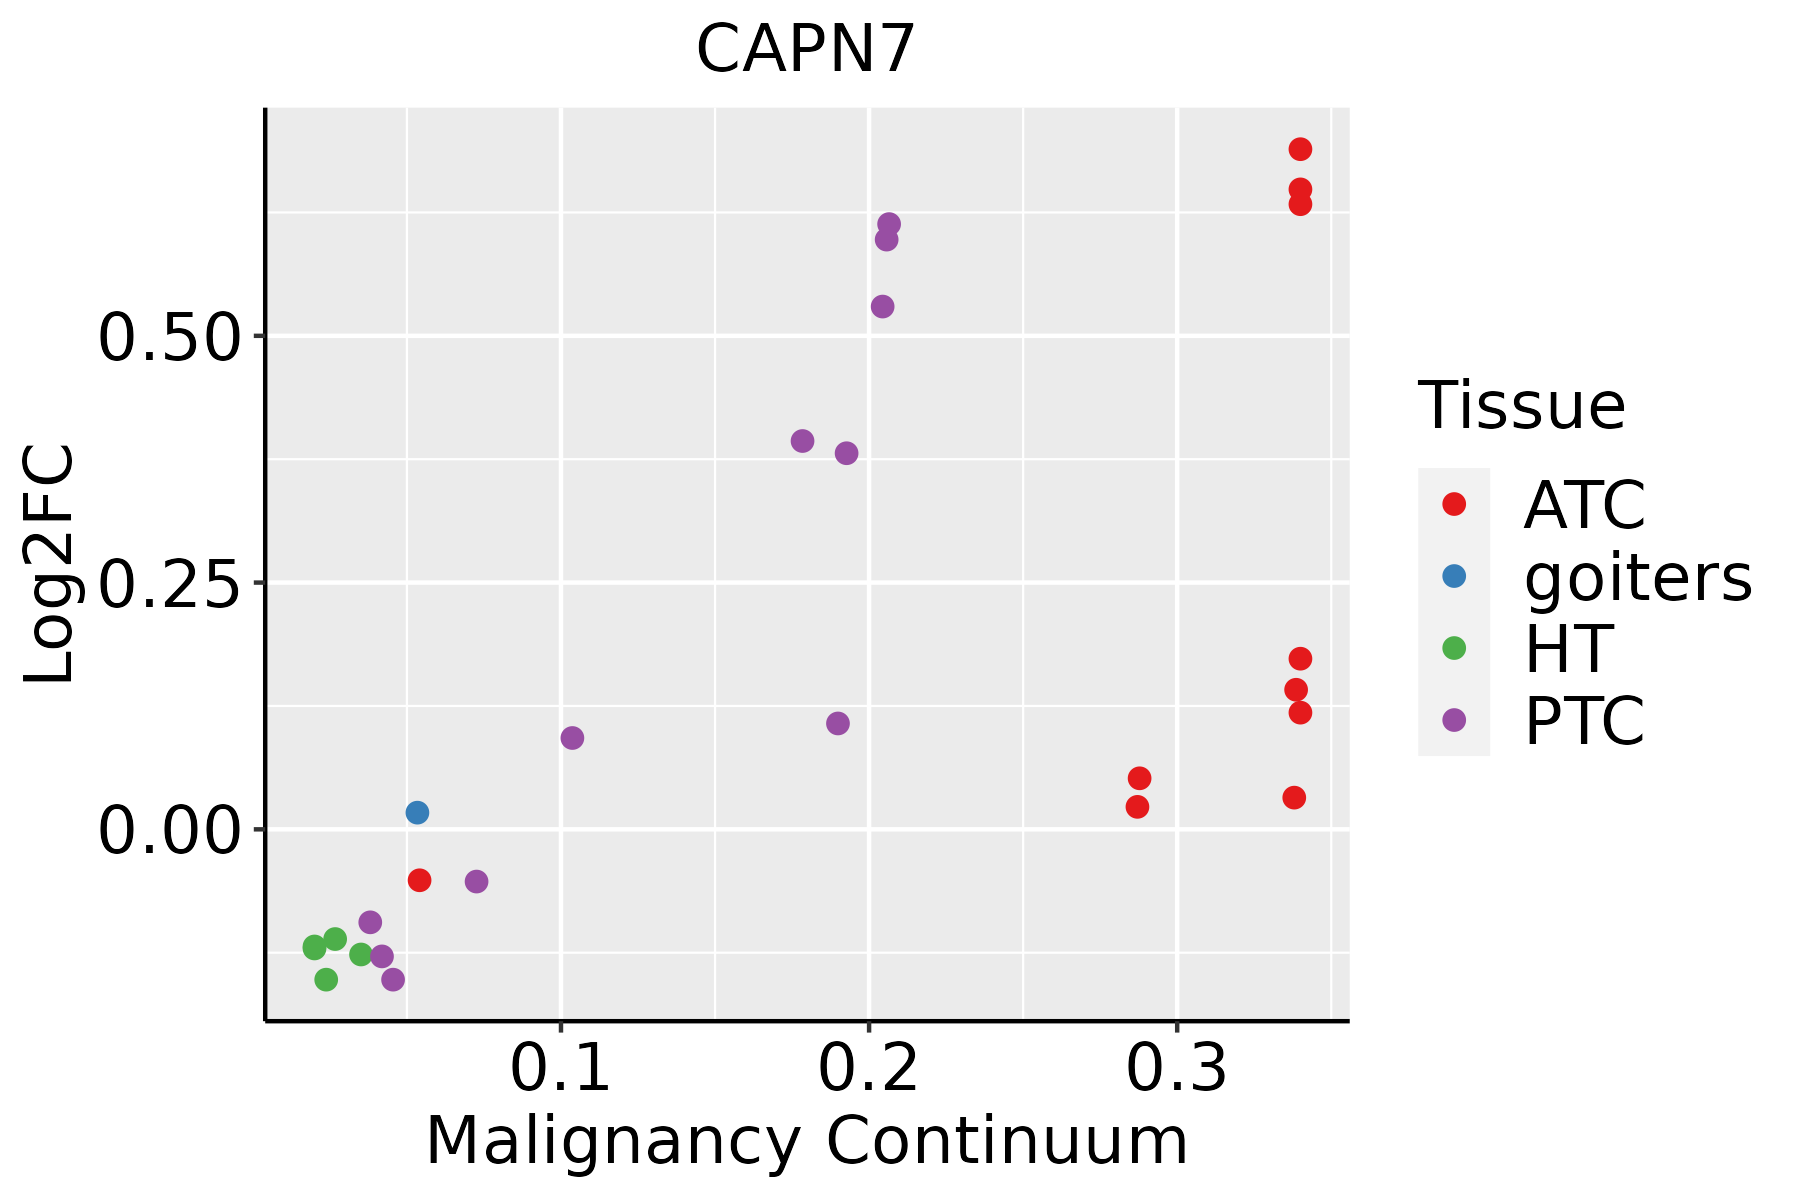 | ATC: Anaplastic thyroid cancer |
| HT: Hashimoto's thyroiditis | ||
| PTC: Papillary thyroid cancer |
| ∗log2FC in expression of this searched gene in stem-like cells from each diseased tissue sample relative to stem-like cells in normal samples in each tissue plotted against the malignancy continuum. Samples are colored based on if they are from different disease stage. |
Top |
Malignant transformation related pathway analysis |
| Find out the enriched GO biological processes and KEGG pathways involved in transition from healthy to precancer to cancer |
| Tissue | Disease Stage | Enriched GO biological Processes |
| Colorectum | AD |  |
| Colorectum | SER |  |
| Colorectum | MSS |  |
| Colorectum | MSI-H |  |
| Colorectum | FAP |  |
| ∗Top 15 enriched GO BP terms are showed in the bar plot of each disease state in each tissue. Each row represents a significant GO biological process which is colored according to the -log10(p.adjust). |
| Page: 1 2 3 4 5 6 7 8 9 |
| GO ID | Tissue | Disease Stage | Description | Gene Ratio | Bg Ratio | pvalue | p.adjust | Count |
| GO:000166720 | Esophagus | ESCC | ameboidal-type cell migration | 250/8552 | 475/18723 | 1.22e-03 | 5.97e-03 | 250 |
| GO:001063120 | Esophagus | ESCC | epithelial cell migration | 187/8552 | 357/18723 | 6.05e-03 | 2.23e-02 | 187 |
| GO:009013220 | Esophagus | ESCC | epithelium migration | 188/8552 | 360/18723 | 6.96e-03 | 2.54e-02 | 188 |
| GO:009013020 | Esophagus | ESCC | tissue migration | 190/8552 | 365/18723 | 7.91e-03 | 2.82e-02 | 190 |
| GO:00016676 | Liver | NAFLD | ameboidal-type cell migration | 65/1882 | 475/18723 | 6.32e-03 | 4.69e-02 | 65 |
| GO:000166721 | Liver | HCC | ameboidal-type cell migration | 226/7958 | 475/18723 | 1.35e-02 | 4.81e-02 | 226 |
| GO:0001667112 | Thyroid | PTC | ameboidal-type cell migration | 198/5968 | 475/18723 | 3.36e-06 | 4.34e-05 | 198 |
| GO:0010634111 | Thyroid | PTC | positive regulation of epithelial cell migration | 85/5968 | 176/18723 | 3.83e-06 | 4.80e-05 | 85 |
| GO:0010631111 | Thyroid | PTC | epithelial cell migration | 149/5968 | 357/18723 | 4.83e-05 | 4.33e-04 | 149 |
| GO:0090132111 | Thyroid | PTC | epithelium migration | 149/5968 | 360/18723 | 7.89e-05 | 6.74e-04 | 149 |
| GO:0090130111 | Thyroid | PTC | tissue migration | 150/5968 | 365/18723 | 1.13e-04 | 9.01e-04 | 150 |
| GO:0010632111 | Thyroid | PTC | regulation of epithelial cell migration | 123/5968 | 292/18723 | 1.33e-04 | 1.05e-03 | 123 |
| GO:000166731 | Thyroid | ATC | ameboidal-type cell migration | 228/6293 | 475/18723 | 3.72e-11 | 1.22e-09 | 228 |
| GO:001063131 | Thyroid | ATC | epithelial cell migration | 169/6293 | 357/18723 | 4.21e-08 | 7.69e-07 | 169 |
| GO:009013031 | Thyroid | ATC | tissue migration | 171/6293 | 365/18723 | 8.55e-08 | 1.47e-06 | 171 |
| GO:009013231 | Thyroid | ATC | epithelium migration | 169/6293 | 360/18723 | 8.57e-08 | 1.47e-06 | 169 |
| GO:001063432 | Thyroid | ATC | positive regulation of epithelial cell migration | 92/6293 | 176/18723 | 2.38e-07 | 3.70e-06 | 92 |
| GO:001063231 | Thyroid | ATC | regulation of epithelial cell migration | 137/6293 | 292/18723 | 1.44e-06 | 1.77e-05 | 137 |
| Page: 1 |
| Pathway ID | Tissue | Disease Stage | Description | Gene Ratio | Bg Ratio | pvalue | p.adjust | qvalue | Count |
| Page: 1 |
Top |
Cell-cell communication analysis |
| Identification of potential cell-cell interactions between two cell types and their ligand-receptor pairs for different disease states |
| Ligand | Receptor | LRpair | Pathway | Tissue | Disease Stage |
| Page: 1 |
Top |
Single-cell gene regulatory network inference analysis |
| Find out the significant the regulons (TFs) and the target genes of each regulon across cell types for different disease states |
| TF | Cell Type | Tissue | Disease Stage | Target Gene | RSS | Regulon Activity |
| ∗The dot plots of a searched regulon are shown for all cell subpopulations in each disease state of each tissue based on the regulon specific score inferred using pySCENIC and by calculating the average expression. |
| Page: 1 |
Top |
Somatic mutation of malignant transformation related genes |
| Annotation of somatic variants for genes involved in malignant transformation |
| Hugo Symbol | Variant Class | Variant Classification | dbSNP RS | HGVSc | HGVSp | HGVSp Short | SWISSPROT | BIOTYPE | SIFT | PolyPhen | Tumor Sample Barcode | Tissue | Histology | Sex | Age | Stage | Therapy Types | Drugs | Outcome |
| CAPN7 | SNV | Missense_Mutation | c.853N>G | p.Thr285Ala | p.T285A | Q9Y6W3 | protein_coding | deleterious(0) | probably_damaging(0.968) | TCGA-A8-A09K-01 | Breast | breast invasive carcinoma | Female | >=65 | I/II | Unknown | Unknown | SD | |
| CAPN7 | SNV | Missense_Mutation | c.326C>T | p.Ala109Val | p.A109V | Q9Y6W3 | protein_coding | deleterious(0) | probably_damaging(0.999) | TCGA-A8-A09Z-01 | Breast | breast invasive carcinoma | Female | >=65 | I/II | Unknown | Unknown | SD | |
| CAPN7 | SNV | Missense_Mutation | c.1010N>T | p.His337Leu | p.H337L | Q9Y6W3 | protein_coding | deleterious(0) | possibly_damaging(0.579) | TCGA-D8-A1XK-01 | Breast | breast invasive carcinoma | Female | <65 | I/II | Chemotherapy | doxorubicine+cyclophosphamide | SD | |
| CAPN7 | SNV | Missense_Mutation | novel | c.2224N>C | p.Glu742Gln | p.E742Q | Q9Y6W3 | protein_coding | deleterious(0.04) | possibly_damaging(0.693) | TCGA-MA-AA41-01 | Cervix | cervical & endocervical cancer | Female | <65 | I/II | Unknown | Unknown | SD |
| CAPN7 | SNV | Missense_Mutation | c.1799N>T | p.Ala600Val | p.A600V | Q9Y6W3 | protein_coding | deleterious(0.03) | probably_damaging(0.957) | TCGA-A6-4107-01 | Colorectum | colon adenocarcinoma | Female | <65 | III/IV | Chemotherapy | 5 | SD | |
| CAPN7 | SNV | Missense_Mutation | rs758288294 | c.863N>T | p.Ser288Leu | p.S288L | Q9Y6W3 | protein_coding | deleterious(0) | probably_damaging(0.991) | TCGA-A6-6141-01 | Colorectum | colon adenocarcinoma | Male | <65 | I/II | Chemotherapy | 5-fu | SD |
| CAPN7 | SNV | Missense_Mutation | c.1453N>C | p.Trp485Arg | p.W485R | Q9Y6W3 | protein_coding | deleterious(0) | probably_damaging(0.999) | TCGA-A6-6780-01 | Colorectum | colon adenocarcinoma | Male | >=65 | I/II | Unknown | Unknown | SD | |
| CAPN7 | SNV | Missense_Mutation | rs776786847 | c.2072N>A | p.Arg691Gln | p.R691Q | Q9Y6W3 | protein_coding | tolerated(0.32) | benign(0.378) | TCGA-AA-3492-01 | Colorectum | colon adenocarcinoma | Female | >=65 | I/II | Unknown | Unknown | SD |
| CAPN7 | SNV | Missense_Mutation | rs755588973 | c.2024N>A | p.Cys675Tyr | p.C675Y | Q9Y6W3 | protein_coding | deleterious(0.01) | possibly_damaging(0.619) | TCGA-AA-3864-01 | Colorectum | colon adenocarcinoma | Male | >=65 | I/II | Unknown | Unknown | SD |
| CAPN7 | SNV | Missense_Mutation | c.390N>C | p.Lys130Asn | p.K130N | Q9Y6W3 | protein_coding | tolerated(0.34) | benign(0.011) | TCGA-AA-A00N-01 | Colorectum | colon adenocarcinoma | Male | >=65 | I/II | Unknown | Unknown | PD |
| Page: 1 2 3 4 5 6 |
Top |
Related drugs of malignant transformation related genes |
| Identification of chemicals and drugs interact with genes involved in malignant transfromation |
| (DGIdb 4.0) |
| Entrez ID | Symbol | Category | Interaction Types | Drug Claim Name | Drug Name | PMIDs |
| Page: 1 |

Copyright 2023-Present -The University of Texas Health Science Center at Houston |