
|
|||||
|
 | |
| |
| |
| |
| |
| |
|
Gene: CAPN2 |
Gene summary for CAPN2 |
| Gene information | Species | Human | Gene symbol | CAPN2 | Gene ID | 824 |
| Gene name | calpain 2 | |
| Gene Alias | CANP2 | |
| Cytomap | 1q41 | |
| Gene Type | protein-coding | GO ID | GO:0000003 | UniProtAcc | B4DN77 |
Top |
Malignant transformation analysis |
| Identification of the aberrant gene expression in precancerous and cancerous lesions by comparing the gene expression of stem-like cells in diseased tissues with normal stem cells |
| Entrez ID | Symbol | Replicates | Species | Organ | Tissue | Adj P-value | Log2FC | Malignancy |
| 824 | CAPN2 | GSM4909282 | Human | Breast | IDC | 1.53e-02 | -2.20e-01 | -0.0288 |
| 824 | CAPN2 | GSM4909285 | Human | Breast | IDC | 3.22e-06 | -3.21e-01 | 0.21 |
| 824 | CAPN2 | GSM4909286 | Human | Breast | IDC | 4.58e-22 | -4.48e-01 | 0.1081 |
| 824 | CAPN2 | GSM4909293 | Human | Breast | IDC | 7.17e-16 | -4.14e-01 | 0.1581 |
| 824 | CAPN2 | GSM4909294 | Human | Breast | IDC | 1.41e-08 | -3.21e-01 | 0.2022 |
| 824 | CAPN2 | GSM4909296 | Human | Breast | IDC | 1.67e-14 | -3.54e-01 | 0.1524 |
| 824 | CAPN2 | GSM4909297 | Human | Breast | IDC | 1.78e-18 | -3.96e-01 | 0.1517 |
| 824 | CAPN2 | GSM4909301 | Human | Breast | IDC | 3.65e-16 | -4.40e-01 | 0.1577 |
| 824 | CAPN2 | GSM4909302 | Human | Breast | IDC | 1.88e-07 | -3.10e-01 | 0.1545 |
| 824 | CAPN2 | GSM4909304 | Human | Breast | IDC | 6.80e-16 | -4.17e-01 | 0.1636 |
| 824 | CAPN2 | GSM4909305 | Human | Breast | IDC | 1.69e-02 | -2.85e-01 | 0.0436 |
| 824 | CAPN2 | GSM4909306 | Human | Breast | IDC | 1.42e-16 | -4.52e-01 | 0.1564 |
| 824 | CAPN2 | GSM4909307 | Human | Breast | IDC | 1.77e-06 | -3.27e-01 | 0.1569 |
| 824 | CAPN2 | GSM4909308 | Human | Breast | IDC | 1.08e-06 | -3.42e-01 | 0.158 |
| 824 | CAPN2 | GSM4909309 | Human | Breast | IDC | 8.71e-12 | -3.96e-01 | 0.0483 |
| 824 | CAPN2 | GSM4909311 | Human | Breast | IDC | 1.94e-25 | -4.12e-01 | 0.1534 |
| 824 | CAPN2 | GSM4909312 | Human | Breast | IDC | 1.45e-12 | -2.28e-01 | 0.1552 |
| 824 | CAPN2 | GSM4909316 | Human | Breast | IDC | 1.13e-02 | -1.75e-01 | 0.21 |
| 824 | CAPN2 | GSM4909319 | Human | Breast | IDC | 1.72e-26 | -4.57e-01 | 0.1563 |
| 824 | CAPN2 | GSM4909320 | Human | Breast | IDC | 3.20e-10 | -4.89e-01 | 0.1575 |
| Page: 1 2 3 4 5 6 7 8 9 10 11 12 13 |
| Tissue | Expression Dynamics | Abbreviation |
| Breast | 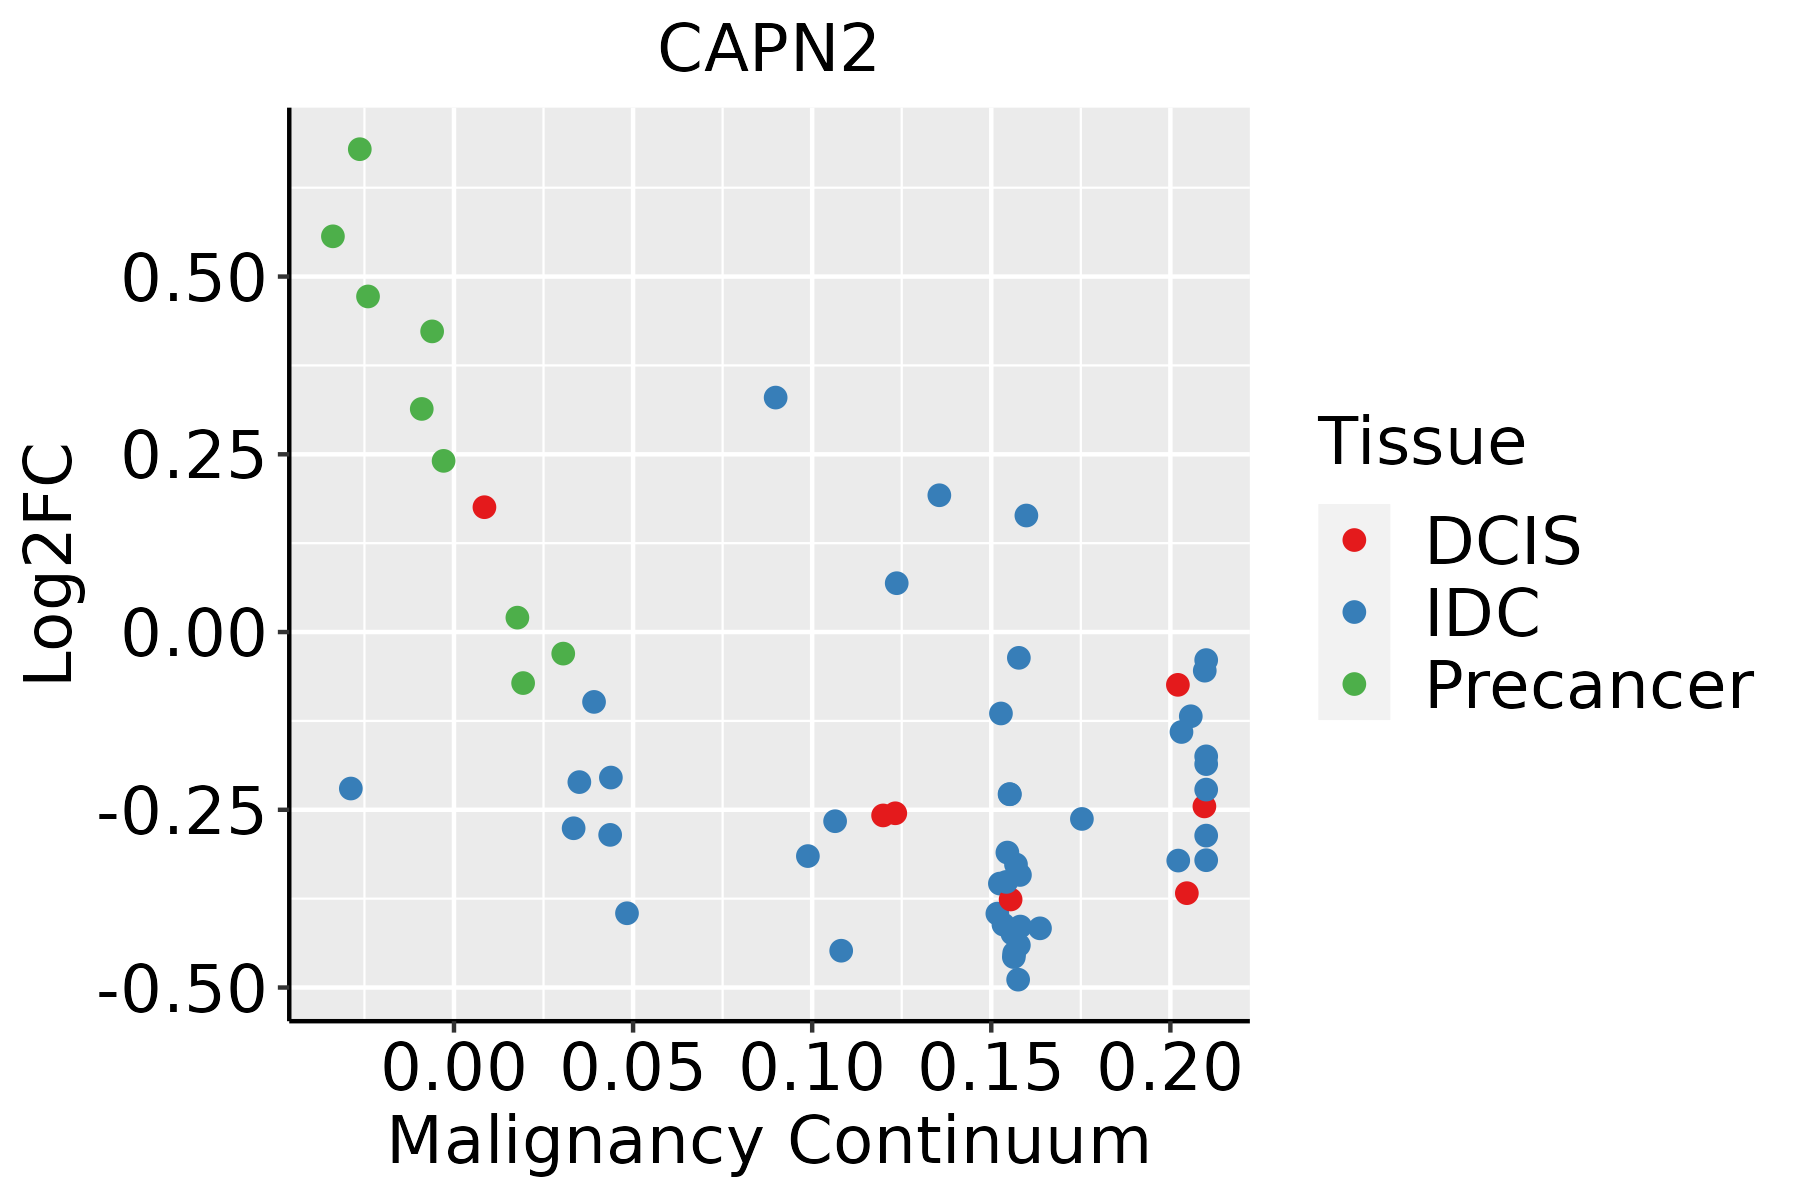 | IDC: Invasive ductal carcinoma |
| DCIS: Ductal carcinoma in situ | ||
| Precancer(BRCA1-mut): Precancerous lesion from BRCA1 mutation carriers | ||
| Cervix |  | CC: Cervix cancer |
| HSIL_HPV: HPV-infected high-grade squamous intraepithelial lesions | ||
| N_HPV: HPV-infected normal cervix | ||
| Colorectum (GSE201348) |  | FAP: Familial adenomatous polyposis |
| CRC: Colorectal cancer | ||
| Colorectum (HTA11) |  | AD: Adenomas |
| SER: Sessile serrated lesions | ||
| MSI-H: Microsatellite-high colorectal cancer | ||
| MSS: Microsatellite stable colorectal cancer | ||
| Endometrium | 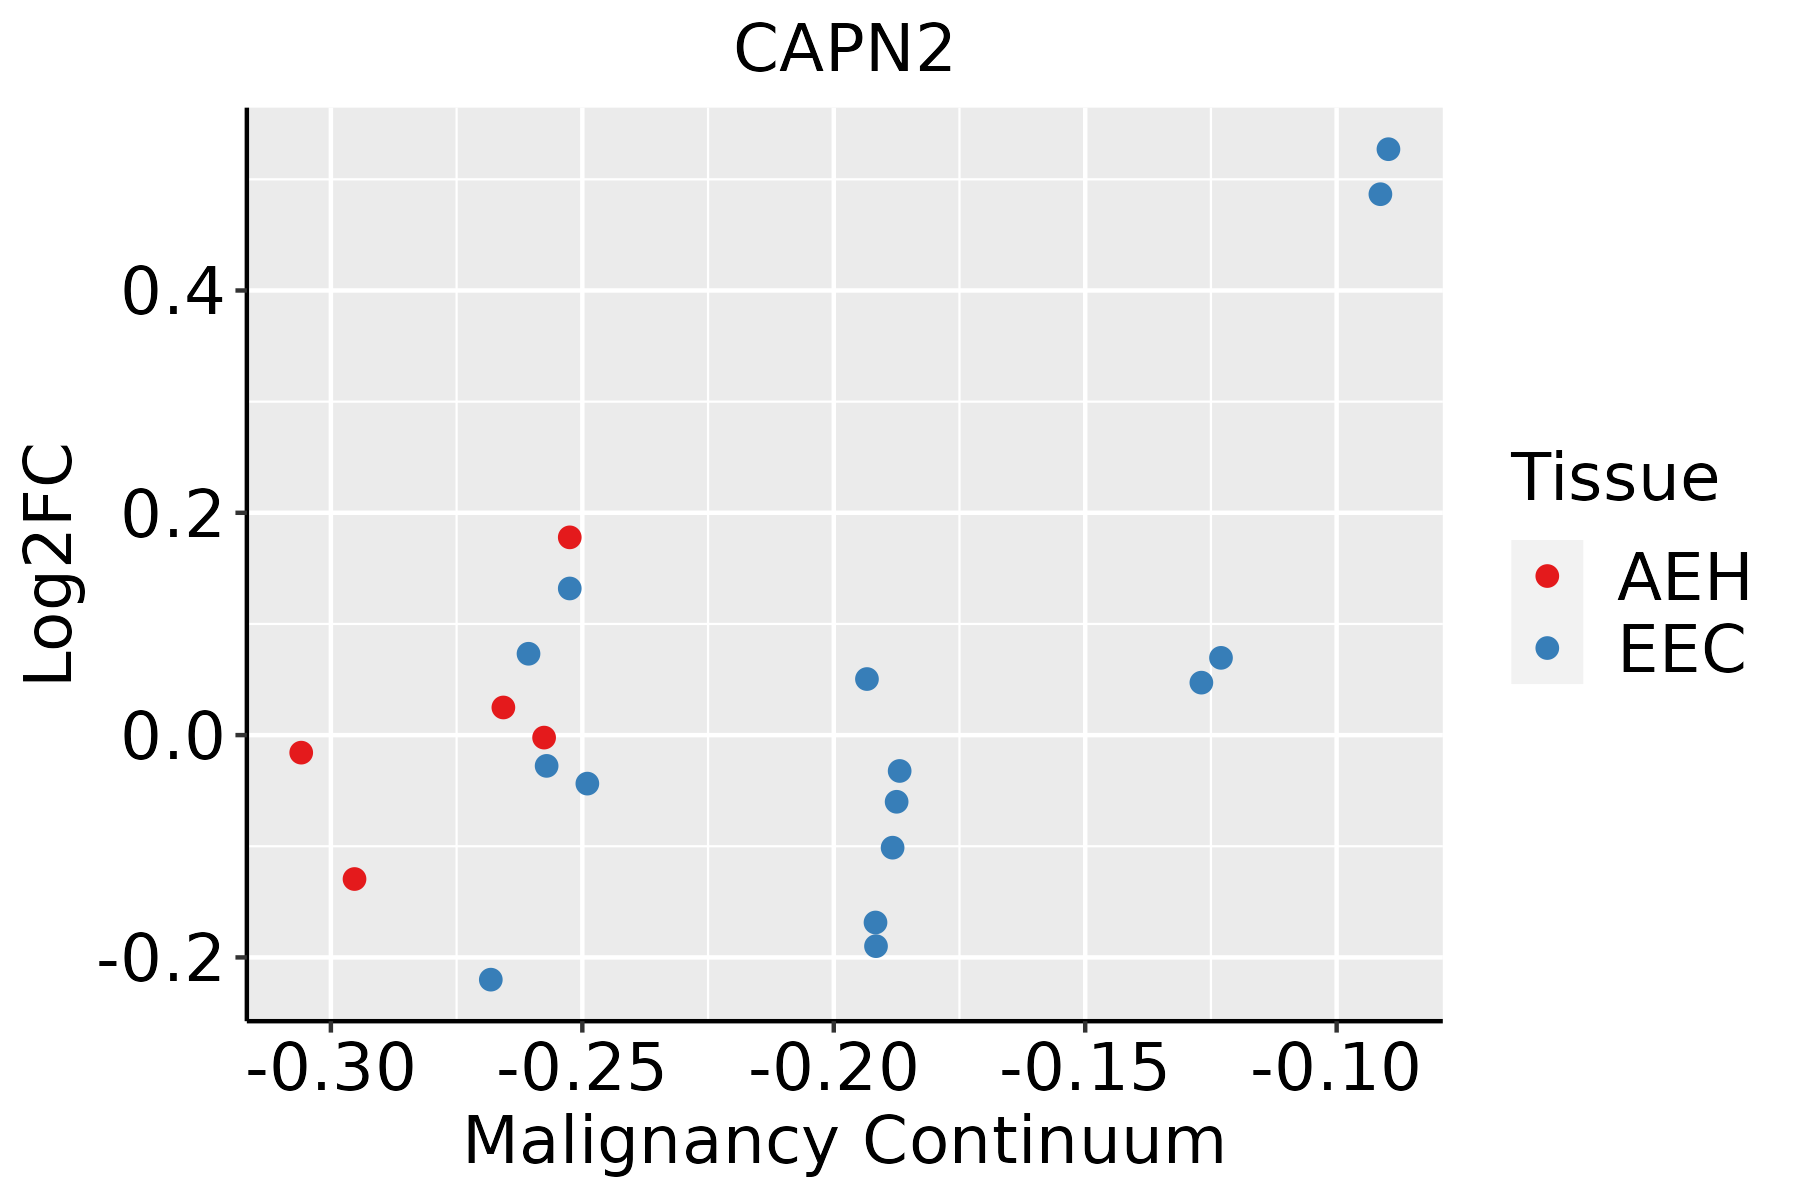 | AEH: Atypical endometrial hyperplasia |
| EEC: Endometrioid Cancer | ||
| Esophagus | 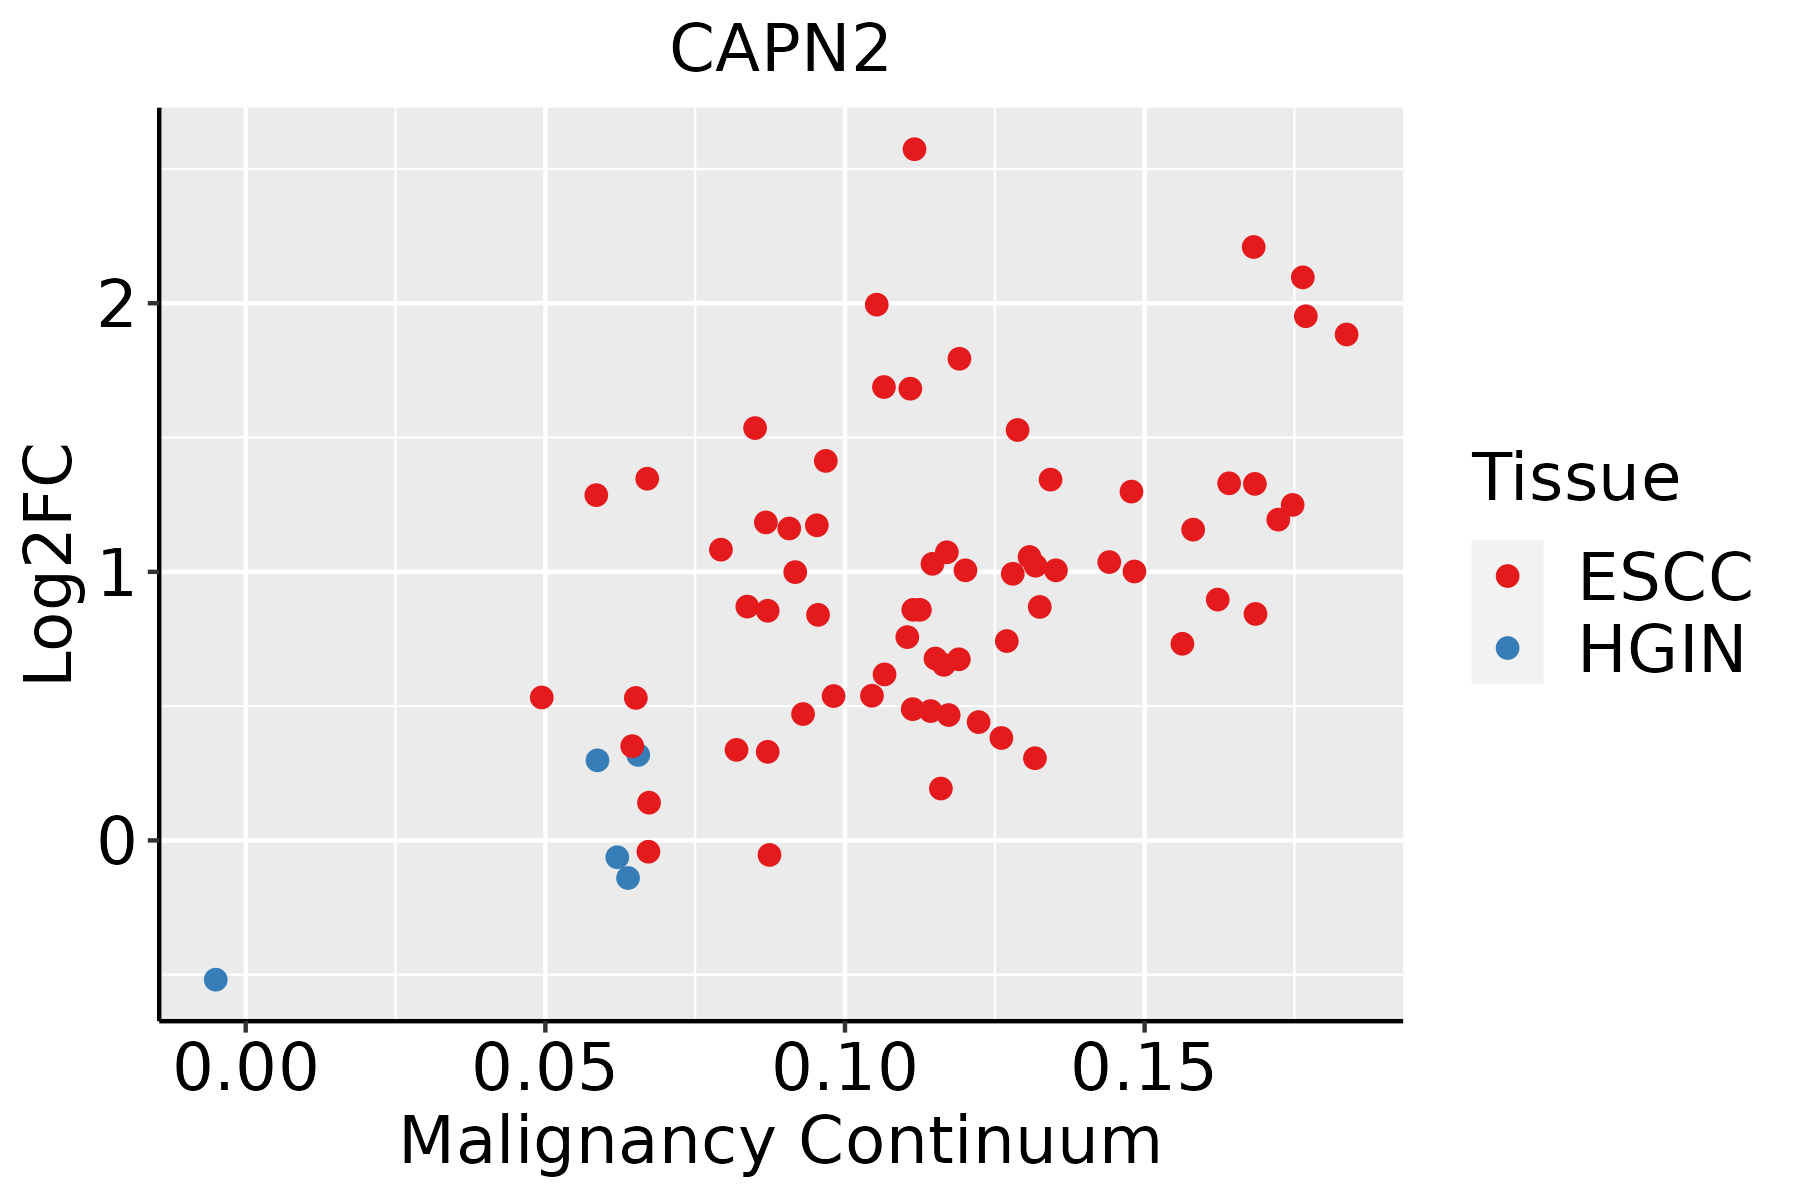 | ESCC: Esophageal squamous cell carcinoma |
| HGIN: High-grade intraepithelial neoplasias | ||
| LGIN: Low-grade intraepithelial neoplasias | ||
| Liver | 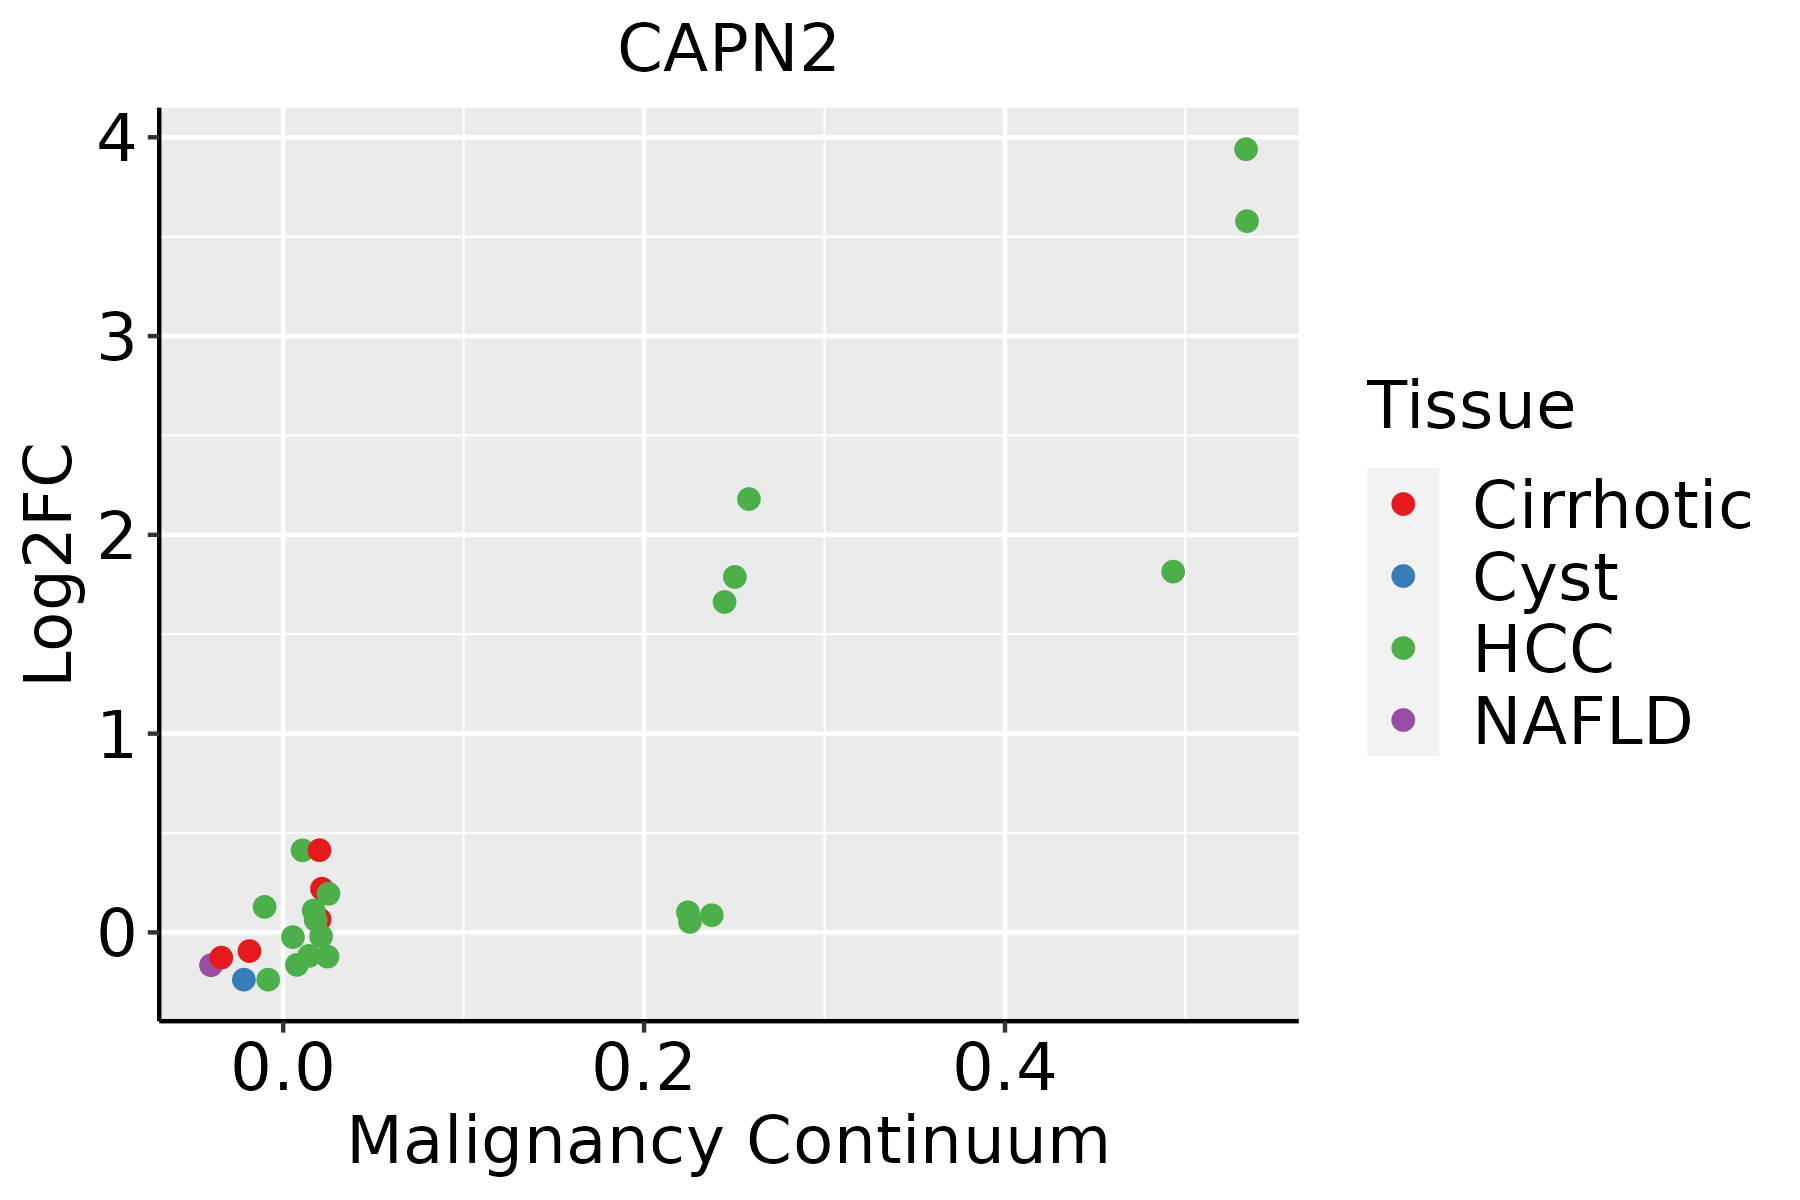 | HCC: Hepatocellular carcinoma |
| NAFLD: Non-alcoholic fatty liver disease | ||
| Lung | 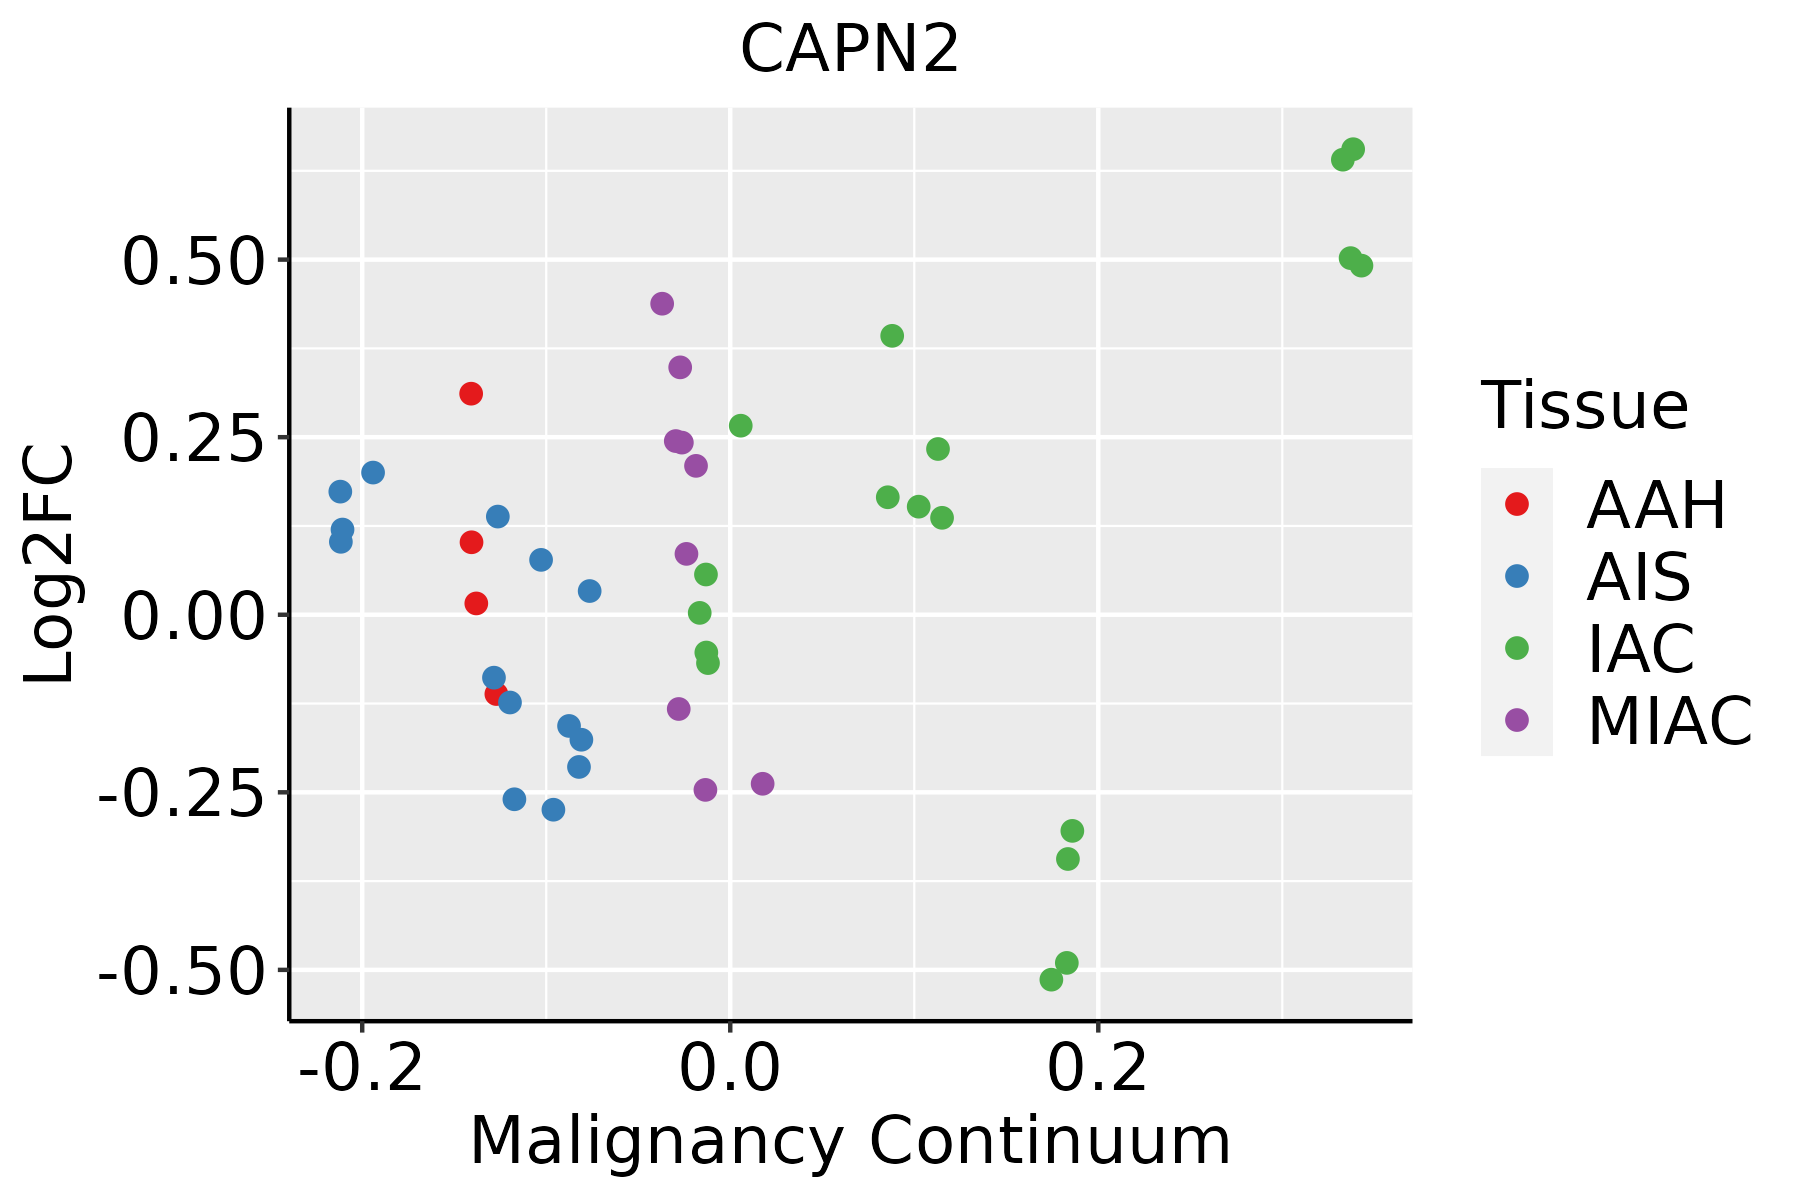 | AAH: Atypical adenomatous hyperplasia |
| AIS: Adenocarcinoma in situ | ||
| IAC: Invasive lung adenocarcinoma | ||
| MIA: Minimally invasive adenocarcinoma | ||
| Oral Cavity |  | EOLP: Erosive Oral lichen planus |
| LP: leukoplakia | ||
| NEOLP: Non-erosive oral lichen planus | ||
| OSCC: Oral squamous cell carcinoma | ||
| Prostate | 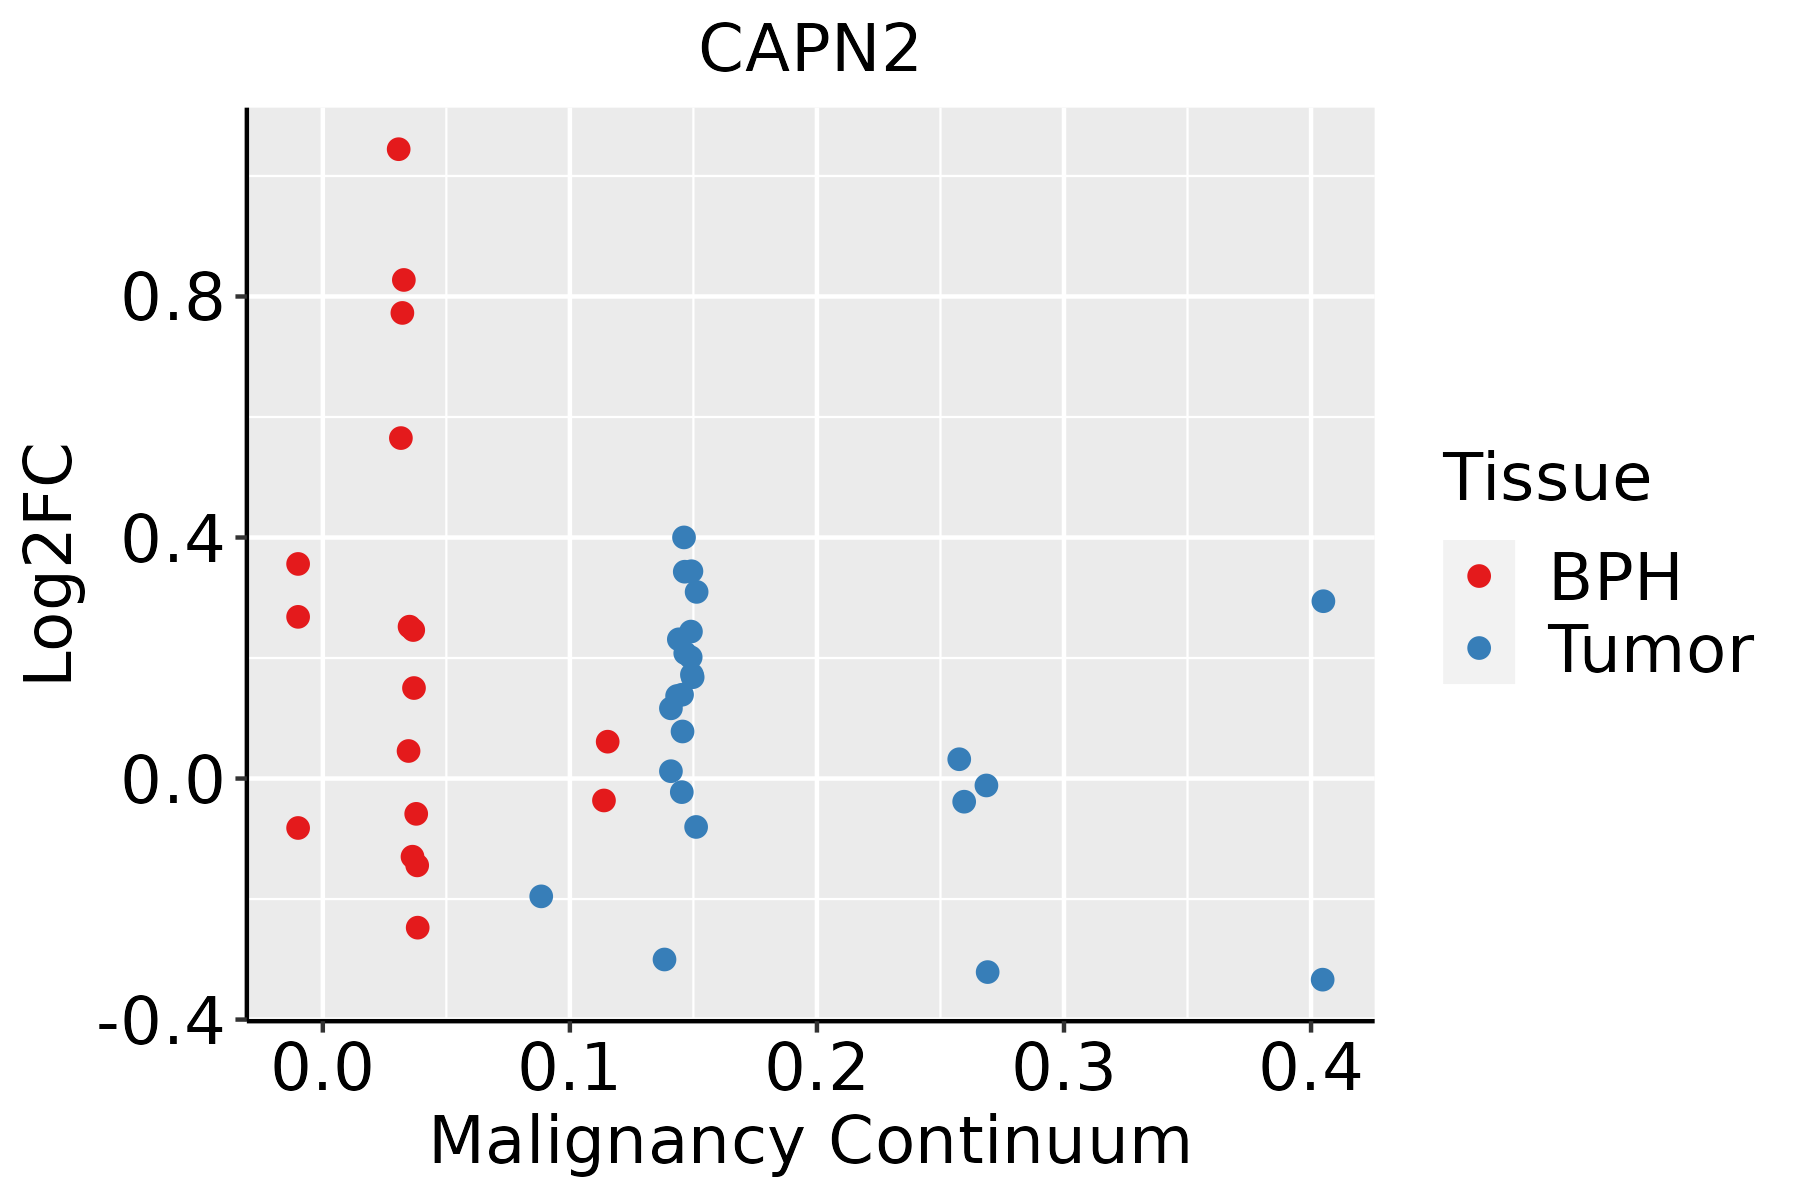 | BPH: Benign Prostatic Hyperplasia |
| Skin |  | AK: Actinic keratosis |
| cSCC: Cutaneous squamous cell carcinoma | ||
| SCCIS:squamous cell carcinoma in situ | ||
| Thyroid |  | ATC: Anaplastic thyroid cancer |
| HT: Hashimoto's thyroiditis | ||
| PTC: Papillary thyroid cancer |
| ∗log2FC in expression of this searched gene in stem-like cells from each diseased tissue sample relative to stem-like cells in normal samples in each tissue plotted against the malignancy continuum. Samples are colored based on if they are from different disease stage. |
Top |
Malignant transformation related pathway analysis |
| Find out the enriched GO biological processes and KEGG pathways involved in transition from healthy to precancer to cancer |
| Tissue | Disease Stage | Enriched GO biological Processes |
| Colorectum | AD |  |
| Colorectum | SER |  |
| Colorectum | MSS |  |
| Colorectum | MSI-H |  |
| Colorectum | FAP |  |
| ∗Top 15 enriched GO BP terms are showed in the bar plot of each disease state in each tissue. Each row represents a significant GO biological process which is colored according to the -log10(p.adjust). |
| Page: 1 2 3 4 5 6 7 8 9 |
| GO ID | Tissue | Disease Stage | Description | Gene Ratio | Bg Ratio | pvalue | p.adjust | Count |
| GO:00069799 | Breast | Precancer | response to oxidative stress | 70/1080 | 446/18723 | 1.59e-14 | 4.26e-12 | 70 |
| GO:00362939 | Breast | Precancer | response to decreased oxygen levels | 53/1080 | 322/18723 | 4.09e-12 | 6.84e-10 | 53 |
| GO:00016669 | Breast | Precancer | response to hypoxia | 51/1080 | 307/18723 | 7.33e-12 | 1.11e-09 | 51 |
| GO:00704829 | Breast | Precancer | response to oxygen levels | 55/1080 | 347/18723 | 7.47e-12 | 1.11e-09 | 55 |
| GO:00003029 | Breast | Precancer | response to reactive oxygen species | 38/1080 | 222/18723 | 1.47e-09 | 1.23e-07 | 38 |
| GO:00709979 | Breast | Precancer | neuron death | 50/1080 | 361/18723 | 7.75e-09 | 5.70e-07 | 50 |
| GO:00425429 | Breast | Precancer | response to hydrogen peroxide | 26/1080 | 146/18723 | 2.52e-07 | 1.26e-05 | 26 |
| GO:19012149 | Breast | Precancer | regulation of neuron death | 41/1080 | 319/18723 | 1.27e-06 | 4.80e-05 | 41 |
| GO:00075653 | Breast | Precancer | female pregnancy | 29/1080 | 193/18723 | 2.07e-06 | 7.31e-05 | 29 |
| GO:00447063 | Breast | Precancer | multi-multicellular organism process | 31/1080 | 220/18723 | 3.73e-06 | 1.19e-04 | 31 |
| GO:00022378 | Breast | Precancer | response to molecule of bacterial origin | 43/1080 | 363/18723 | 6.05e-06 | 1.72e-04 | 43 |
| GO:00324968 | Breast | Precancer | response to lipopolysaccharide | 41/1080 | 343/18723 | 7.94e-06 | 2.17e-04 | 41 |
| GO:19012169 | Breast | Precancer | positive regulation of neuron death | 16/1080 | 97/18723 | 1.29e-04 | 2.24e-03 | 16 |
| GO:00712227 | Breast | Precancer | cellular response to lipopolysaccharide | 25/1080 | 209/18723 | 4.41e-04 | 5.85e-03 | 25 |
| GO:00712167 | Breast | Precancer | cellular response to biotic stimulus | 28/1080 | 246/18723 | 4.67e-04 | 6.14e-03 | 28 |
| GO:00192164 | Breast | Precancer | regulation of lipid metabolic process | 34/1080 | 331/18723 | 8.14e-04 | 9.55e-03 | 34 |
| GO:00712197 | Breast | Precancer | cellular response to molecule of bacterial origin | 25/1080 | 221/18723 | 1.00e-03 | 1.12e-02 | 25 |
| GO:00017017 | Breast | Precancer | in utero embryonic development | 35/1080 | 367/18723 | 2.47e-03 | 2.27e-02 | 35 |
| GO:00011015 | Breast | Precancer | response to acid chemical | 16/1080 | 135/18723 | 4.85e-03 | 3.67e-02 | 16 |
| GO:00516047 | Breast | Precancer | protein maturation | 28/1080 | 294/18723 | 6.45e-03 | 4.50e-02 | 28 |
| Page: 1 2 3 4 5 6 7 8 9 10 11 12 13 14 15 16 17 18 19 20 21 22 23 24 25 26 27 28 29 |
| Pathway ID | Tissue | Disease Stage | Description | Gene Ratio | Bg Ratio | pvalue | p.adjust | qvalue | Count |
| hsa0501016 | Breast | Precancer | Alzheimer disease | 103/684 | 384/8465 | 1.03e-29 | 4.66e-28 | 3.57e-28 | 103 |
| hsa0502216 | Breast | Precancer | Pathways of neurodegeneration - multiple diseases | 112/684 | 476/8465 | 6.96e-27 | 2.44e-25 | 1.87e-25 | 112 |
| hsa0513118 | Breast | Precancer | Shigellosis | 44/684 | 247/8465 | 3.91e-07 | 6.86e-06 | 5.26e-06 | 44 |
| hsa0414118 | Breast | Precancer | Protein processing in endoplasmic reticulum | 33/684 | 174/8465 | 2.78e-06 | 3.83e-05 | 2.94e-05 | 33 |
| hsa042189 | Breast | Precancer | Cellular senescence | 29/684 | 156/8465 | 1.66e-05 | 1.69e-04 | 1.30e-04 | 29 |
| hsa042108 | Breast | Precancer | Apoptosis | 25/684 | 136/8465 | 7.61e-05 | 6.87e-04 | 5.26e-04 | 25 |
| hsa0501017 | Breast | Precancer | Alzheimer disease | 103/684 | 384/8465 | 1.03e-29 | 4.66e-28 | 3.57e-28 | 103 |
| hsa0502217 | Breast | Precancer | Pathways of neurodegeneration - multiple diseases | 112/684 | 476/8465 | 6.96e-27 | 2.44e-25 | 1.87e-25 | 112 |
| hsa0513119 | Breast | Precancer | Shigellosis | 44/684 | 247/8465 | 3.91e-07 | 6.86e-06 | 5.26e-06 | 44 |
| hsa0414119 | Breast | Precancer | Protein processing in endoplasmic reticulum | 33/684 | 174/8465 | 2.78e-06 | 3.83e-05 | 2.94e-05 | 33 |
| hsa0421814 | Breast | Precancer | Cellular senescence | 29/684 | 156/8465 | 1.66e-05 | 1.69e-04 | 1.30e-04 | 29 |
| hsa0421013 | Breast | Precancer | Apoptosis | 25/684 | 136/8465 | 7.61e-05 | 6.87e-04 | 5.26e-04 | 25 |
| hsa0501023 | Breast | IDC | Alzheimer disease | 107/867 | 384/8465 | 1.70e-23 | 7.88e-22 | 5.90e-22 | 107 |
| hsa0502223 | Breast | IDC | Pathways of neurodegeneration - multiple diseases | 116/867 | 476/8465 | 3.63e-20 | 1.18e-18 | 8.82e-19 | 116 |
| hsa0421824 | Breast | IDC | Cellular senescence | 35/867 | 156/8465 | 5.49e-06 | 7.43e-05 | 5.56e-05 | 35 |
| hsa0421022 | Breast | IDC | Apoptosis | 31/867 | 136/8465 | 1.34e-05 | 1.61e-04 | 1.20e-04 | 31 |
| hsa0513124 | Breast | IDC | Shigellosis | 47/867 | 247/8465 | 1.78e-05 | 2.00e-04 | 1.49e-04 | 47 |
| hsa0414124 | Breast | IDC | Protein processing in endoplasmic reticulum | 36/867 | 174/8465 | 2.73e-05 | 2.86e-04 | 2.14e-04 | 36 |
| hsa045109 | Breast | IDC | Focal adhesion | 32/867 | 203/8465 | 8.60e-03 | 4.23e-02 | 3.17e-02 | 32 |
| hsa0501033 | Breast | IDC | Alzheimer disease | 107/867 | 384/8465 | 1.70e-23 | 7.88e-22 | 5.90e-22 | 107 |
| Page: 1 2 3 4 5 6 7 8 9 10 11 12 13 14 |
Top |
Cell-cell communication analysis |
| Identification of potential cell-cell interactions between two cell types and their ligand-receptor pairs for different disease states |
| Ligand | Receptor | LRpair | Pathway | Tissue | Disease Stage |
| Page: 1 |
Top |
Single-cell gene regulatory network inference analysis |
| Find out the significant the regulons (TFs) and the target genes of each regulon across cell types for different disease states |
| TF | Cell Type | Tissue | Disease Stage | Target Gene | RSS | Regulon Activity |
| ∗The dot plots of a searched regulon are shown for all cell subpopulations in each disease state of each tissue based on the regulon specific score inferred using pySCENIC and by calculating the average expression. |
| Page: 1 |
Top |
Somatic mutation of malignant transformation related genes |
| Annotation of somatic variants for genes involved in malignant transformation |
| Hugo Symbol | Variant Class | Variant Classification | dbSNP RS | HGVSc | HGVSp | HGVSp Short | SWISSPROT | BIOTYPE | SIFT | PolyPhen | Tumor Sample Barcode | Tissue | Histology | Sex | Age | Stage | Therapy Types | Drugs | Outcome |
| CAPN2 | SNV | Missense_Mutation | c.1121N>A | p.Cys374Tyr | p.C374Y | P17655 | protein_coding | deleterious(0) | probably_damaging(0.998) | TCGA-A8-A081-01 | Breast | breast invasive carcinoma | Female | >=65 | I/II | Unknown | Unknown | SD | |
| CAPN2 | SNV | Missense_Mutation | rs550161035 | c.2003N>A | p.Arg668Gln | p.R668Q | P17655 | protein_coding | deleterious(0.01) | probably_damaging(1) | TCGA-A8-A081-01 | Breast | breast invasive carcinoma | Female | >=65 | I/II | Unknown | Unknown | SD |
| CAPN2 | SNV | Missense_Mutation | rs368366230 | c.1192N>A | p.Glu398Lys | p.E398K | P17655 | protein_coding | tolerated(0.21) | benign(0.043) | TCGA-AC-A2BK-01 | Breast | breast invasive carcinoma | Female | >=65 | III/IV | Chemotherapy | cytoxan | CR |
| CAPN2 | SNV | Missense_Mutation | novel | c.754G>A | p.Ala252Thr | p.A252T | P17655 | protein_coding | tolerated(0.14) | benign(0.302) | TCGA-AC-A2BM-01 | Breast | breast invasive carcinoma | Female | <65 | I/II | Unknown | Unknown | SD |
| CAPN2 | SNV | Missense_Mutation | c.564N>G | p.Ile188Met | p.I188M | P17655 | protein_coding | deleterious(0.02) | benign(0.059) | TCGA-AR-A256-01 | Breast | breast invasive carcinoma | Female | <65 | I/II | Chemotherapy | doxorubicin | PD | |
| CAPN2 | SNV | Missense_Mutation | novel | c.2059N>G | p.Ile687Val | p.I687V | P17655 | protein_coding | tolerated(0.5) | benign(0.014) | TCGA-S3-A6ZG-01 | Breast | breast invasive carcinoma | Female | >=65 | I/II | Chemotherapy | doxorubicin | CR |
| CAPN2 | insertion | Nonsense_Mutation | novel | c.594_595insACTTGAGAAGGA | p.Gly198_Ala199insThrTerGluGly | p.G198_A199insT*EG | P17655 | protein_coding | TCGA-A8-A09X-01 | Breast | breast invasive carcinoma | Female | <65 | III/IV | Unknown | Unknown | SD | ||
| CAPN2 | insertion | Nonsense_Mutation | novel | c.596_597insTCTACTTCCTTGACAGGACACATTTGTAT | p.Thr200LeufsTer4 | p.T200Lfs*4 | P17655 | protein_coding | TCGA-A8-A09X-01 | Breast | breast invasive carcinoma | Female | <65 | III/IV | Unknown | Unknown | SD | ||
| CAPN2 | insertion | Nonsense_Mutation | novel | c.680_681insACCGCGCCCGGCCTGAGATTTTCTTTAAAACA | p.Ile228ProfsTer5 | p.I228Pfs*5 | P17655 | protein_coding | TCGA-AN-A0FX-01 | Breast | breast invasive carcinoma | Female | <65 | I/II | Unknown | Unknown | SD | ||
| CAPN2 | deletion | Frame_Shift_Del | novel | c.1601delT | p.Phe534SerfsTer24 | p.F534Sfs*24 | P17655 | protein_coding | TCGA-D8-A27V-01 | Breast | breast invasive carcinoma | Female | <65 | I/II | Hormone Therapy | tamoxiphen | SD |
| Page: 1 2 3 4 5 6 7 8 9 |
Top |
Related drugs of malignant transformation related genes |
| Identification of chemicals and drugs interact with genes involved in malignant transfromation |
| (DGIdb 4.0) |
| Entrez ID | Symbol | Category | Interaction Types | Drug Claim Name | Drug Name | PMIDs |
| 824 | CAPN2 | PROTEASE, DRUGGABLE GENOME, ENZYME, EXTERNAL SIDE OF PLASMA MEMBRANE | Carboxamide derivative 10 | |||
| 824 | CAPN2 | PROTEASE, DRUGGABLE GENOME, ENZYME, EXTERNAL SIDE OF PLASMA MEMBRANE | Carboxamide derivative 6 | |||
| 824 | CAPN2 | PROTEASE, DRUGGABLE GENOME, ENZYME, EXTERNAL SIDE OF PLASMA MEMBRANE | inhibitor | 252166770 | ||
| 824 | CAPN2 | PROTEASE, DRUGGABLE GENOME, ENZYME, EXTERNAL SIDE OF PLASMA MEMBRANE | Carboxamide derivative 9 | |||
| 824 | CAPN2 | PROTEASE, DRUGGABLE GENOME, ENZYME, EXTERNAL SIDE OF PLASMA MEMBRANE | ABT-957 | |||
| 824 | CAPN2 | PROTEASE, DRUGGABLE GENOME, ENZYME, EXTERNAL SIDE OF PLASMA MEMBRANE | Epoxysuccinate derivative 4 | |||
| 824 | CAPN2 | PROTEASE, DRUGGABLE GENOME, ENZYME, EXTERNAL SIDE OF PLASMA MEMBRANE | Epoxysuccinate derivative 6 | |||
| 824 | CAPN2 | PROTEASE, DRUGGABLE GENOME, ENZYME, EXTERNAL SIDE OF PLASMA MEMBRANE | Epoxysuccinate derivative 3 | |||
| 824 | CAPN2 | PROTEASE, DRUGGABLE GENOME, ENZYME, EXTERNAL SIDE OF PLASMA MEMBRANE | PMID25399719-Compound-17 | |||
| 824 | CAPN2 | PROTEASE, DRUGGABLE GENOME, ENZYME, EXTERNAL SIDE OF PLASMA MEMBRANE | Carboxamide derivative 7 |
| Page: 1 2 3 |

Copyright 2023-Present -The University of Texas Health Science Center at Houston |