
|
|||||
|
 | |
| |
| |
| |
| |
| |
|
Gene: CAPN13 |
Gene summary for CAPN13 |
| Gene information | Species | Human | Gene symbol | CAPN13 | Gene ID | 92291 |
| Gene name | calpain 13 | |
| Gene Alias | CAPN13 | |
| Cytomap | 2p23.1 | |
| Gene Type | protein-coding | GO ID | GO:0006508 | UniProtAcc | Q6MZZ7 |
Top |
Malignant transformation analysis |
| Identification of the aberrant gene expression in precancerous and cancerous lesions by comparing the gene expression of stem-like cells in diseased tissues with normal stem cells |
| Entrez ID | Symbol | Replicates | Species | Organ | Tissue | Adj P-value | Log2FC | Malignancy |
| 92291 | CAPN13 | LZE5T | Human | Esophagus | ESCC | 1.54e-04 | 4.90e-01 | 0.0514 |
| 92291 | CAPN13 | LZE24T | Human | Esophagus | ESCC | 1.89e-10 | 2.66e-01 | 0.0596 |
| 92291 | CAPN13 | P1T-E | Human | Esophagus | ESCC | 1.09e-04 | 2.22e-01 | 0.0875 |
| 92291 | CAPN13 | P8T-E | Human | Esophagus | ESCC | 3.02e-26 | 6.95e-01 | 0.0889 |
| 92291 | CAPN13 | P15T-E | Human | Esophagus | ESCC | 3.38e-04 | 2.52e-01 | 0.1149 |
| 92291 | CAPN13 | P23T-E | Human | Esophagus | ESCC | 6.53e-09 | 2.49e-01 | 0.108 |
| 92291 | CAPN13 | P36T-E | Human | Esophagus | ESCC | 2.82e-02 | 1.59e-01 | 0.1187 |
| 92291 | CAPN13 | P57T-E | Human | Esophagus | ESCC | 9.35e-10 | 3.11e-01 | 0.0926 |
| 92291 | CAPN13 | P61T-E | Human | Esophagus | ESCC | 2.11e-11 | 3.17e-01 | 0.099 |
| 92291 | CAPN13 | P62T-E | Human | Esophagus | ESCC | 8.96e-66 | 1.81e+00 | 0.1302 |
| 92291 | CAPN13 | P65T-E | Human | Esophagus | ESCC | 2.64e-10 | 2.41e-01 | 0.0978 |
| 92291 | CAPN13 | P76T-E | Human | Esophagus | ESCC | 3.75e-03 | 1.67e-01 | 0.1207 |
| 92291 | CAPN13 | P79T-E | Human | Esophagus | ESCC | 2.06e-08 | 2.84e-01 | 0.1154 |
| 92291 | CAPN13 | P80T-E | Human | Esophagus | ESCC | 1.97e-04 | 2.82e-01 | 0.155 |
| 92291 | CAPN13 | P82T-E | Human | Esophagus | ESCC | 1.40e-05 | 3.53e-01 | 0.1072 |
| 92291 | CAPN13 | P84T-E | Human | Esophagus | ESCC | 2.04e-06 | 4.93e-01 | 0.0933 |
| 92291 | CAPN13 | P104T-E | Human | Esophagus | ESCC | 2.06e-06 | 3.35e-01 | 0.0931 |
| 92291 | CAPN13 | P126T-E | Human | Esophagus | ESCC | 8.75e-03 | 5.07e-01 | 0.1125 |
| 92291 | CAPN13 | P127T-E | Human | Esophagus | ESCC | 7.67e-11 | 2.40e-01 | 0.0826 |
| 92291 | CAPN13 | RNA-P17T-P17T-2 | Human | Lung | IAC | 2.46e-03 | 5.95e-01 | 0.3371 |
| Page: 1 2 |
| Tissue | Expression Dynamics | Abbreviation |
| Esophagus |  | ESCC: Esophageal squamous cell carcinoma |
| HGIN: High-grade intraepithelial neoplasias | ||
| LGIN: Low-grade intraepithelial neoplasias | ||
| Lung | 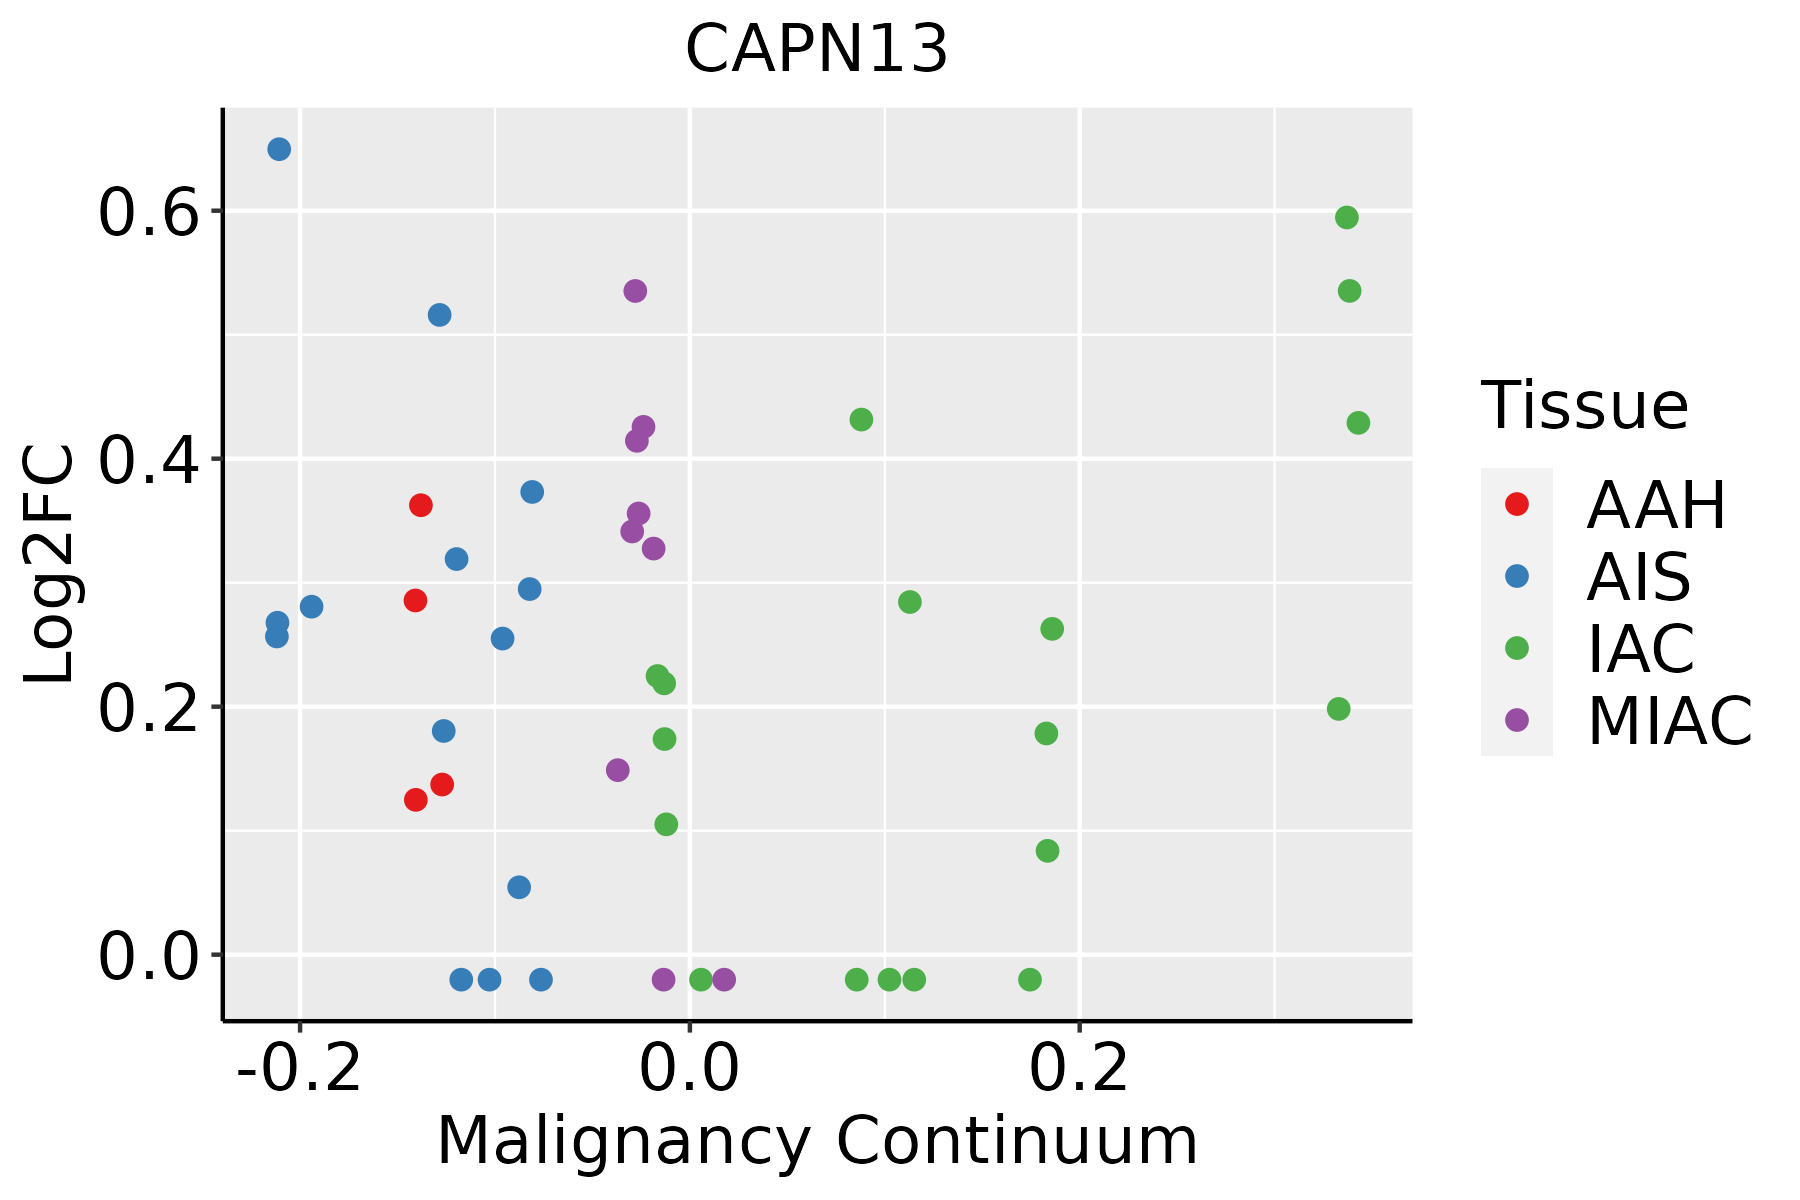 | AAH: Atypical adenomatous hyperplasia |
| AIS: Adenocarcinoma in situ | ||
| IAC: Invasive lung adenocarcinoma | ||
| MIA: Minimally invasive adenocarcinoma |
| ∗log2FC in expression of this searched gene in stem-like cells from each diseased tissue sample relative to stem-like cells in normal samples in each tissue plotted against the malignancy continuum. Samples are colored based on if they are from different disease stage. |
Top |
Malignant transformation related pathway analysis |
| Find out the enriched GO biological processes and KEGG pathways involved in transition from healthy to precancer to cancer |
| Tissue | Disease Stage | Enriched GO biological Processes |
| Colorectum | AD |  |
| Colorectum | SER |  |
| Colorectum | MSS |  |
| Colorectum | MSI-H |  |
| Colorectum | FAP |  |
| ∗Top 15 enriched GO BP terms are showed in the bar plot of each disease state in each tissue. Each row represents a significant GO biological process which is colored according to the -log10(p.adjust). |
| Page: 1 2 3 4 5 6 7 8 9 |
| GO ID | Tissue | Disease Stage | Description | Gene Ratio | Bg Ratio | pvalue | p.adjust | Count |
| Page: 1 |
| Pathway ID | Tissue | Disease Stage | Description | Gene Ratio | Bg Ratio | pvalue | p.adjust | qvalue | Count |
| Page: 1 |
Top |
Cell-cell communication analysis |
| Identification of potential cell-cell interactions between two cell types and their ligand-receptor pairs for different disease states |
| Ligand | Receptor | LRpair | Pathway | Tissue | Disease Stage |
| Page: 1 |
Top |
Single-cell gene regulatory network inference analysis |
| Find out the significant the regulons (TFs) and the target genes of each regulon across cell types for different disease states |
| TF | Cell Type | Tissue | Disease Stage | Target Gene | RSS | Regulon Activity |
| ∗The dot plots of a searched regulon are shown for all cell subpopulations in each disease state of each tissue based on the regulon specific score inferred using pySCENIC and by calculating the average expression. |
| Page: 1 |
Top |
Somatic mutation of malignant transformation related genes |
| Annotation of somatic variants for genes involved in malignant transformation |
| Hugo Symbol | Variant Class | Variant Classification | dbSNP RS | HGVSc | HGVSp | HGVSp Short | SWISSPROT | BIOTYPE | SIFT | PolyPhen | Tumor Sample Barcode | Tissue | Histology | Sex | Age | Stage | Therapy Types | Drugs | Outcome |
| CAPN13 | SNV | Missense_Mutation | c.631N>A | p.Asp211Asn | p.D211N | Q6MZZ7 | protein_coding | tolerated(0.32) | benign(0.174) | TCGA-A2-A0D2-01 | Breast | breast invasive carcinoma | Female | <65 | I/II | Chemotherapy | adriamycin | SD | |
| CAPN13 | SNV | Missense_Mutation | novel | c.1244N>T | p.Ser415Leu | p.S415L | Q6MZZ7 | protein_coding | tolerated(0.65) | benign(0.062) | TCGA-MS-A51U-01 | Breast | breast invasive carcinoma | Female | <65 | I/II | Chemotherapy | adriamycin | SD |
| CAPN13 | insertion | In_Frame_Ins | novel | c.1682_1683insAAATGTAAAATCACATTTCCCCGG | p.Glu561_Glu562insAsnValLysSerHisPheProGly | p.E561_E562insNVKSHFPG | Q6MZZ7 | protein_coding | TCGA-A2-A04Y-01 | Breast | breast invasive carcinoma | Female | <65 | I/II | Chemotherapy | cytoxan | SD | ||
| CAPN13 | insertion | Nonsense_Mutation | novel | c.1526_1527insA | p.Tyr509Ter | p.Y509* | Q6MZZ7 | protein_coding | TCGA-A2-A0YH-01 | Breast | breast invasive carcinoma | Female | <65 | III/IV | Chemotherapy | adriamycin | SD | ||
| CAPN13 | insertion | Nonsense_Mutation | novel | c.453_454insGTCCGATGAGAGTGCGGAGGAG | p.Cys152ValfsTer3 | p.C152Vfs*3 | Q6MZZ7 | protein_coding | TCGA-AN-A0G0-01 | Breast | breast invasive carcinoma | Female | <65 | I/II | Unknown | Unknown | SD | ||
| CAPN13 | insertion | Nonsense_Mutation | novel | c.451_452insTTTAATAATATCACGGTCA | p.Lys151IlefsTer2 | p.K151Ifs*2 | Q6MZZ7 | protein_coding | TCGA-AN-A0G0-01 | Breast | breast invasive carcinoma | Female | <65 | I/II | Unknown | Unknown | SD | ||
| CAPN13 | SNV | Missense_Mutation | novel | c.1383G>T | p.Gln461His | p.Q461H | Q6MZZ7 | protein_coding | tolerated(0.09) | possibly_damaging(0.652) | TCGA-2W-A8YY-01 | Cervix | cervical & endocervical cancer | Female | <65 | I/II | Chemotherapy | cisplatin | CR |
| CAPN13 | SNV | Missense_Mutation | rs201284844 | c.5N>T | p.Ala2Val | p.A2V | Q6MZZ7 | protein_coding | deleterious(0) | possibly_damaging(0.893) | TCGA-EA-A410-01 | Cervix | cervical & endocervical cancer | Female | <65 | I/II | Unknown | Unknown | SD |
| CAPN13 | SNV | Missense_Mutation | c.955N>C | p.Asp319His | p.D319H | Q6MZZ7 | protein_coding | deleterious(0.01) | probably_damaging(0.997) | TCGA-IR-A3LK-01 | Cervix | cervical & endocervical cancer | Female | >=65 | I/II | Chemotherapy | cisplatin | PD | |
| CAPN13 | SNV | Missense_Mutation | c.788N>A | p.Arg263Lys | p.R263K | Q6MZZ7 | protein_coding | tolerated(0.59) | benign(0.035) | TCGA-UC-A7PF-01 | Cervix | cervical & endocervical cancer | Female | <65 | I/II | Unknown | Unknown | SD |
| Page: 1 2 3 4 5 6 7 8 9 |
Top |
Related drugs of malignant transformation related genes |
| Identification of chemicals and drugs interact with genes involved in malignant transfromation |
| (DGIdb 4.0) |
| Entrez ID | Symbol | Category | Interaction Types | Drug Claim Name | Drug Name | PMIDs |
| Page: 1 |

Copyright 2023-Present -The University of Texas Health Science Center at Houston |