
|
|||||
|
 | |
| |
| |
| |
| |
| |
|
Gene: CAPG |
Gene summary for CAPG |
| Gene information | Species | Human | Gene symbol | CAPG | Gene ID | 822 |
| Gene name | capping actin protein, gelsolin like | |
| Gene Alias | AFCP | |
| Cytomap | 2p11.2 | |
| Gene Type | protein-coding | GO ID | GO:0006996 | UniProtAcc | B2R9S4 |
Top |
Malignant transformation analysis |
| Identification of the aberrant gene expression in precancerous and cancerous lesions by comparing the gene expression of stem-like cells in diseased tissues with normal stem cells |
| Entrez ID | Symbol | Replicates | Species | Organ | Tissue | Adj P-value | Log2FC | Malignancy |
| 822 | CAPG | GSM4909282 | Human | Breast | IDC | 5.46e-30 | 6.45e-01 | -0.0288 |
| 822 | CAPG | GSM4909285 | Human | Breast | IDC | 3.73e-11 | 4.36e-01 | 0.21 |
| 822 | CAPG | GSM4909286 | Human | Breast | IDC | 6.18e-12 | -3.39e-01 | 0.1081 |
| 822 | CAPG | GSM4909294 | Human | Breast | IDC | 3.77e-05 | -1.80e-01 | 0.2022 |
| 822 | CAPG | GSM4909296 | Human | Breast | IDC | 8.95e-10 | 3.10e-01 | 0.1524 |
| 822 | CAPG | GSM4909297 | Human | Breast | IDC | 1.58e-08 | 1.44e-02 | 0.1517 |
| 822 | CAPG | GSM4909302 | Human | Breast | IDC | 4.91e-02 | -2.20e-01 | 0.1545 |
| 822 | CAPG | GSM4909305 | Human | Breast | IDC | 3.86e-04 | 3.37e-01 | 0.0436 |
| 822 | CAPG | GSM4909311 | Human | Breast | IDC | 1.83e-24 | -2.04e-01 | 0.1534 |
| 822 | CAPG | GSM4909312 | Human | Breast | IDC | 7.13e-09 | -3.35e-02 | 0.1552 |
| 822 | CAPG | GSM4909319 | Human | Breast | IDC | 1.46e-26 | -1.54e-01 | 0.1563 |
| 822 | CAPG | GSM4909320 | Human | Breast | IDC | 1.11e-03 | 6.14e-02 | 0.1575 |
| 822 | CAPG | GSM4909321 | Human | Breast | IDC | 6.99e-13 | 1.16e-01 | 0.1559 |
| 822 | CAPG | brca1 | Human | Breast | Precancer | 1.44e-16 | 5.48e-01 | -0.0338 |
| 822 | CAPG | brca2 | Human | Breast | Precancer | 7.22e-09 | 4.55e-01 | -0.024 |
| 822 | CAPG | brca3 | Human | Breast | Precancer | 2.17e-20 | 5.42e-01 | -0.0263 |
| 822 | CAPG | brca10 | Human | Breast | Precancer | 4.29e-05 | 3.95e-01 | -0.0029 |
| 822 | CAPG | NCCBC14 | Human | Breast | DCIS | 1.16e-08 | 3.47e-01 | 0.2021 |
| 822 | CAPG | NCCBC3 | Human | Breast | DCIS | 8.93e-25 | 6.45e-01 | 0.1198 |
| 822 | CAPG | NCCBC5 | Human | Breast | DCIS | 3.25e-15 | 3.51e-01 | 0.2046 |
| Page: 1 2 3 4 5 6 7 8 9 10 11 |
| Tissue | Expression Dynamics | Abbreviation |
| Breast |  | IDC: Invasive ductal carcinoma |
| DCIS: Ductal carcinoma in situ | ||
| Precancer(BRCA1-mut): Precancerous lesion from BRCA1 mutation carriers | ||
| Cervix | 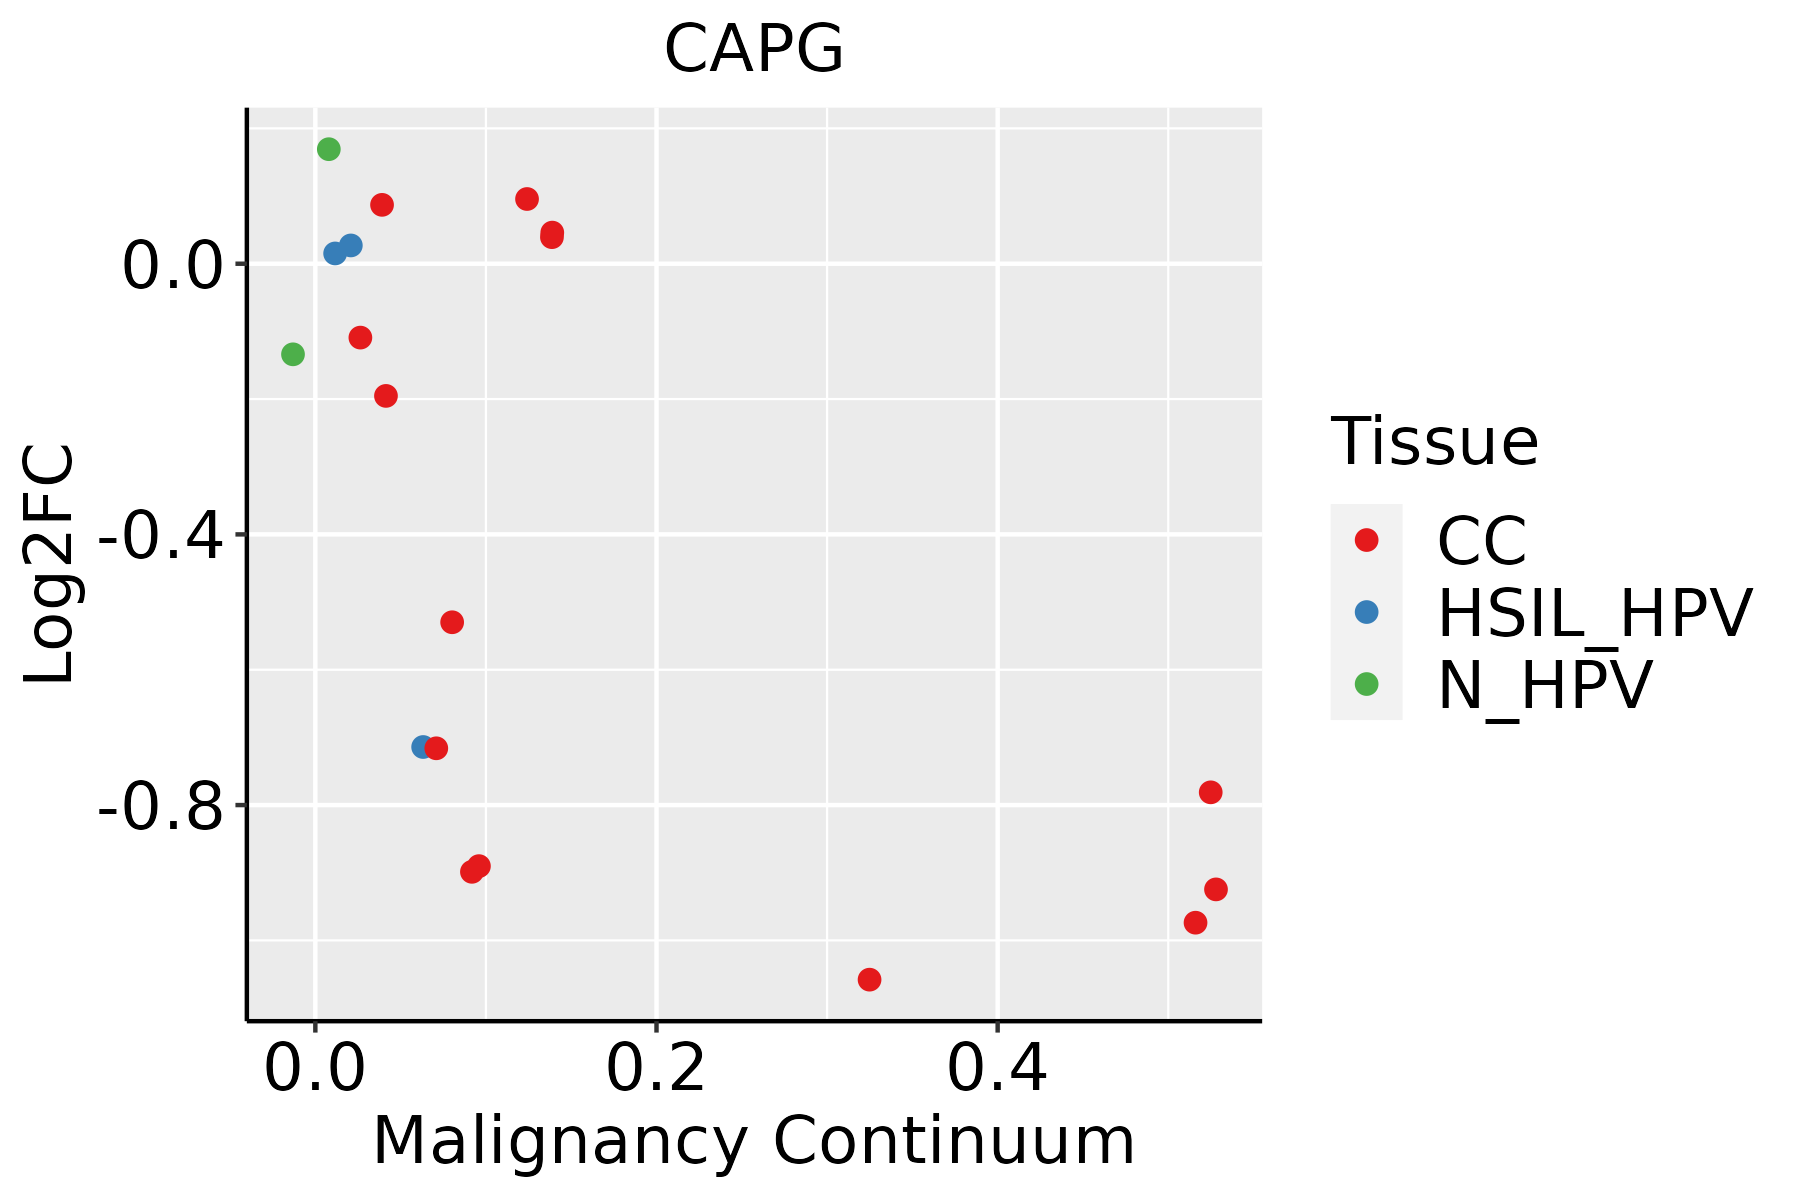 | CC: Cervix cancer |
| HSIL_HPV: HPV-infected high-grade squamous intraepithelial lesions | ||
| N_HPV: HPV-infected normal cervix | ||
| Colorectum (GSE201348) |  | FAP: Familial adenomatous polyposis |
| CRC: Colorectal cancer | ||
| Colorectum (HTA11) | 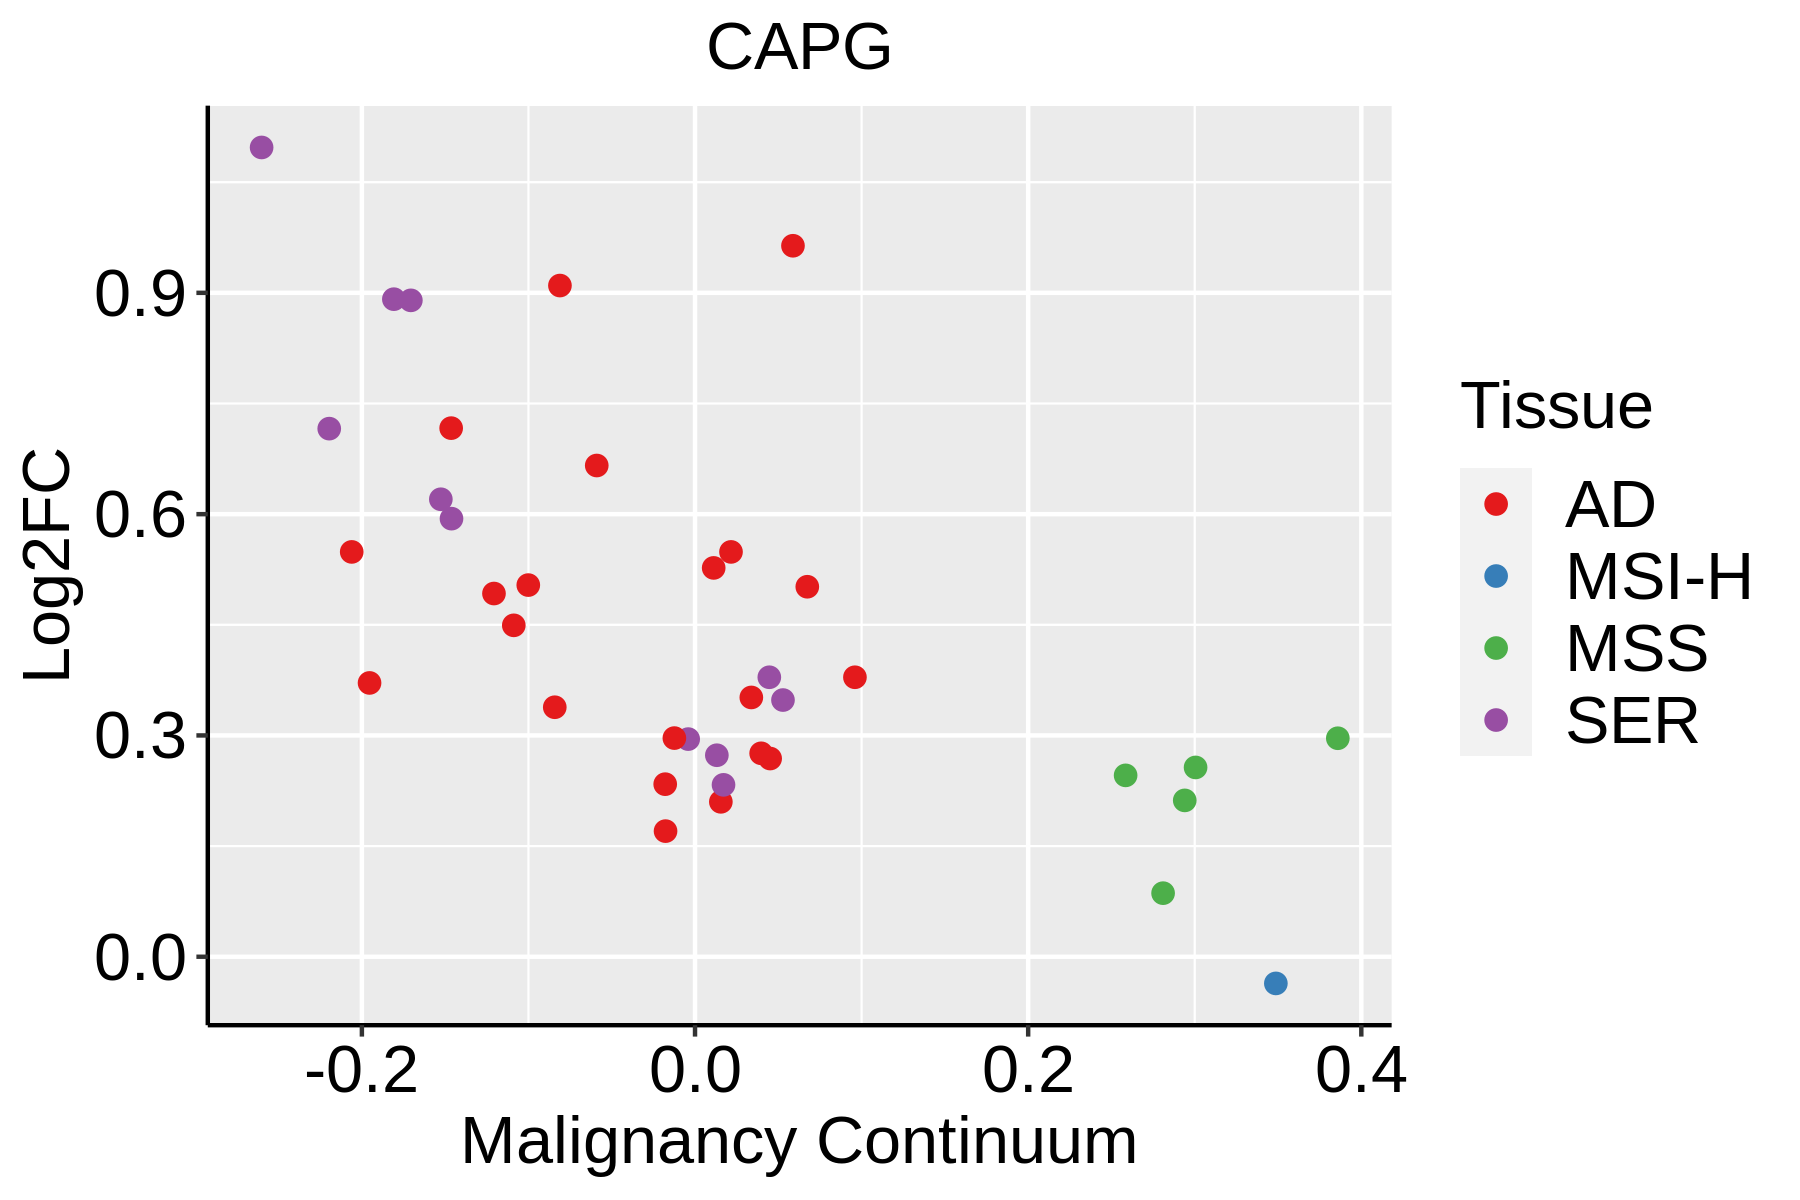 | AD: Adenomas |
| SER: Sessile serrated lesions | ||
| MSI-H: Microsatellite-high colorectal cancer | ||
| MSS: Microsatellite stable colorectal cancer | ||
| Esophagus | 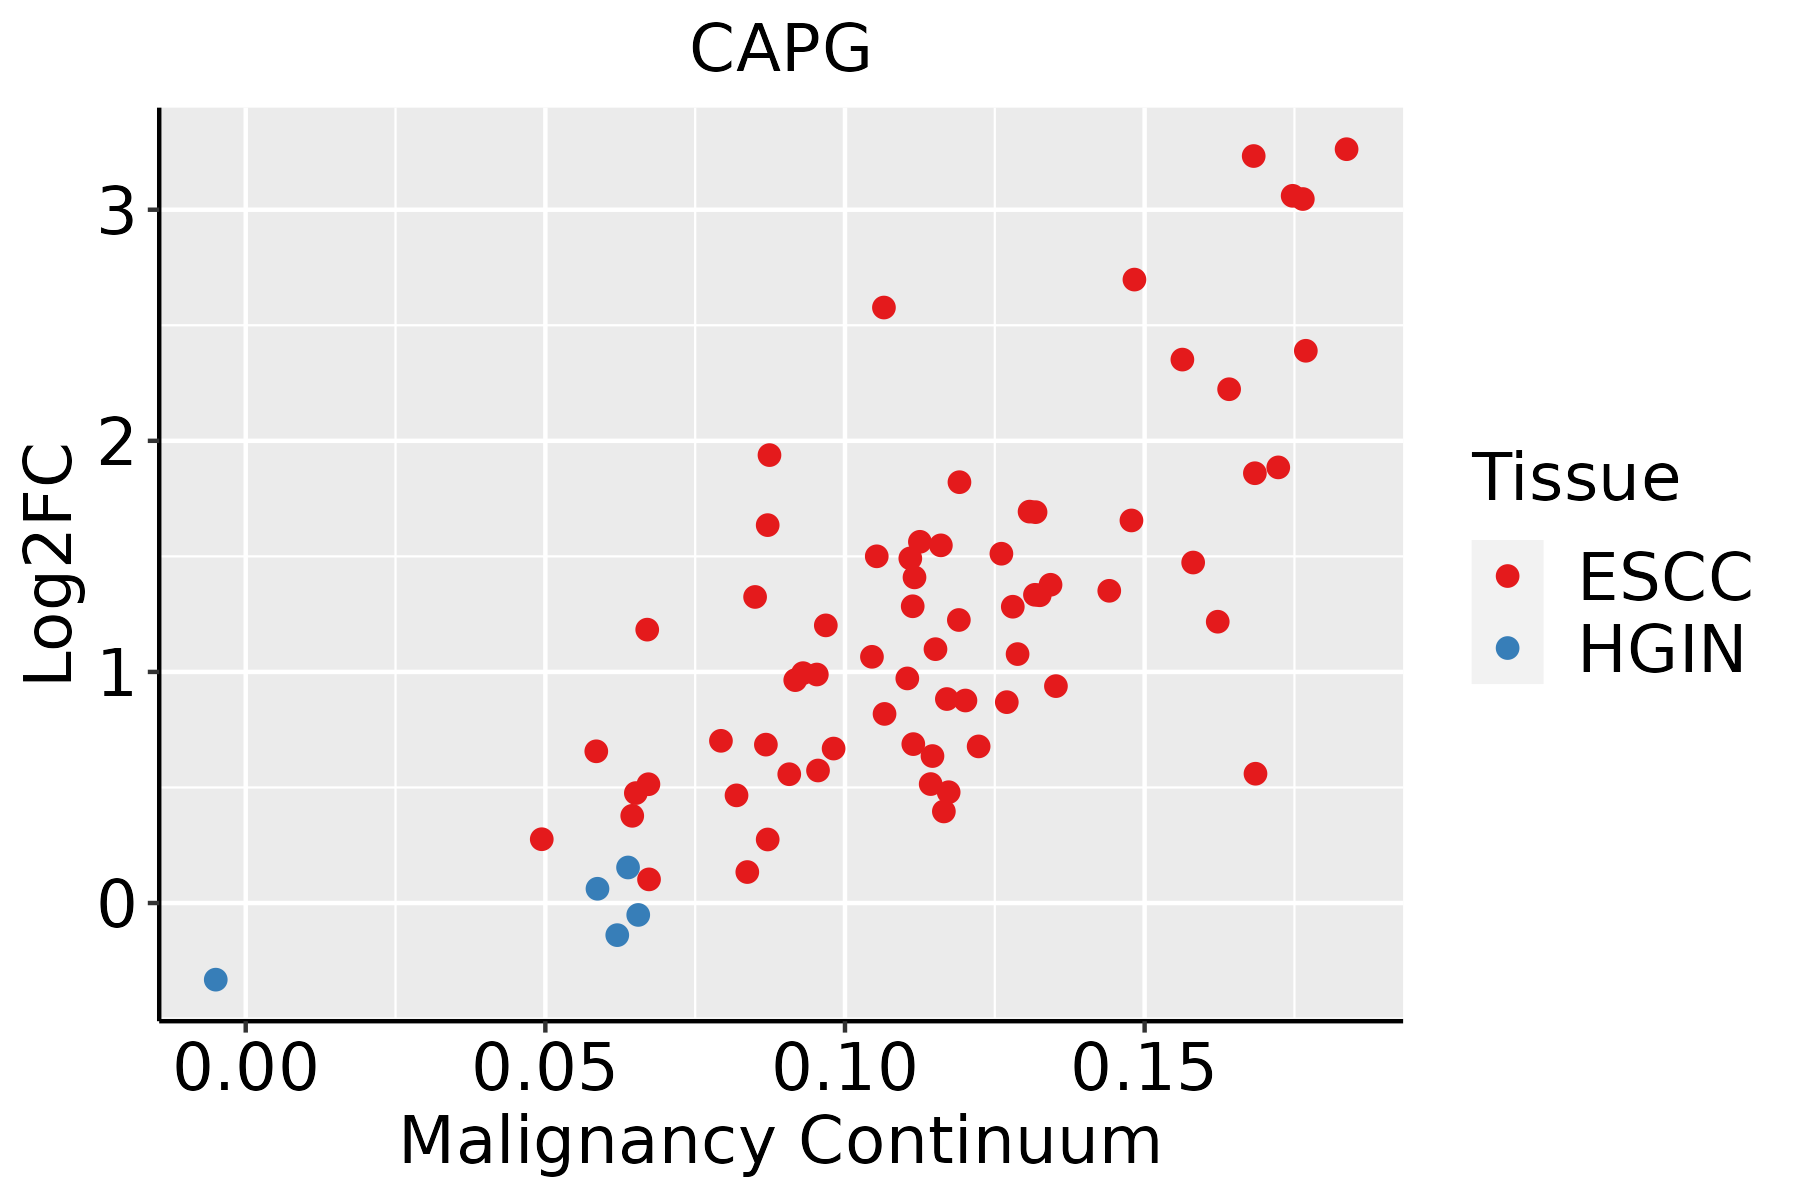 | ESCC: Esophageal squamous cell carcinoma |
| HGIN: High-grade intraepithelial neoplasias | ||
| LGIN: Low-grade intraepithelial neoplasias | ||
| GC | 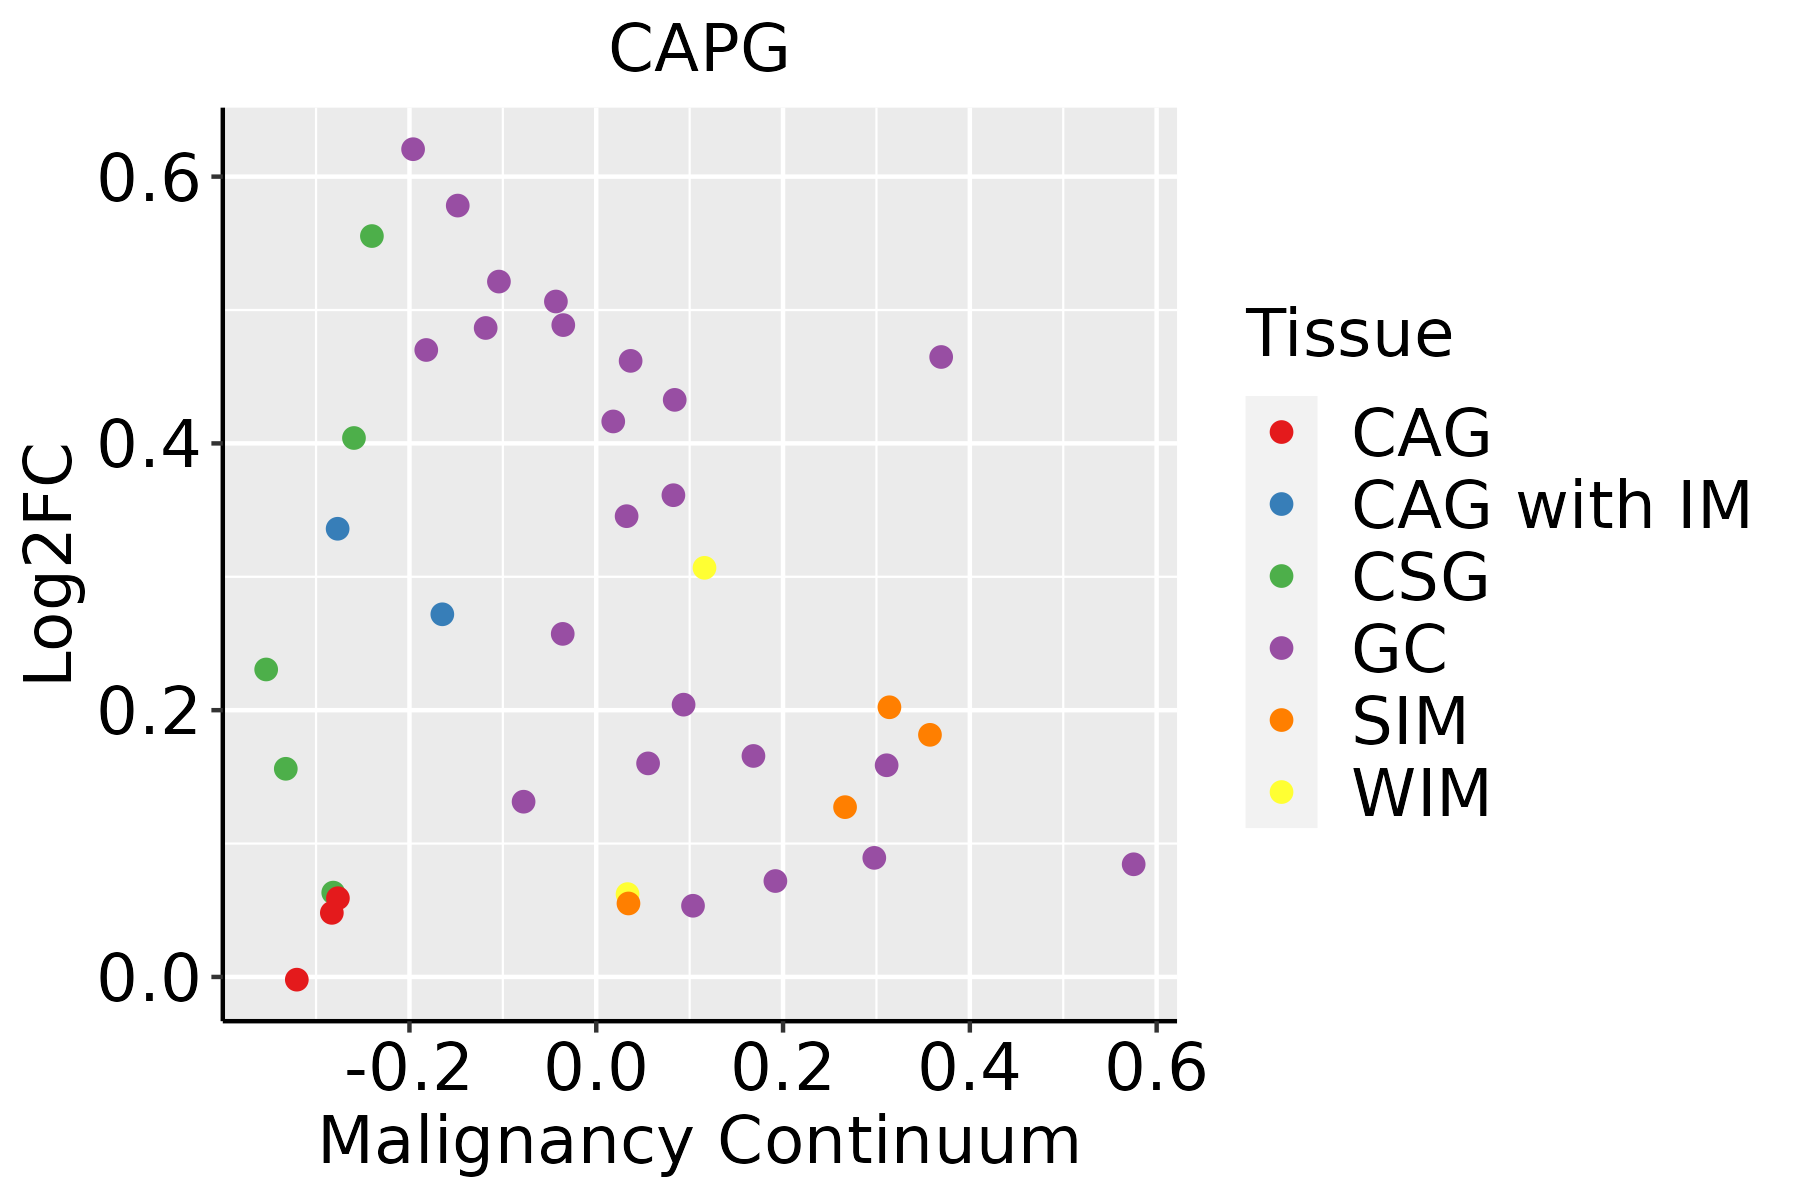 | CAG: Chronic atrophic gastritis |
| CAG with IM: Chronic atrophic gastritis with intestinal metaplasia | ||
| CSG: Chronic superficial gastritis | ||
| GC: Gastric cancer | ||
| SIM: Severe intestinal metaplasia | ||
| WIM: Wild intestinal metaplasia | ||
| Liver |  | HCC: Hepatocellular carcinoma |
| NAFLD: Non-alcoholic fatty liver disease | ||
| Oral Cavity |  | EOLP: Erosive Oral lichen planus |
| LP: leukoplakia | ||
| NEOLP: Non-erosive oral lichen planus | ||
| OSCC: Oral squamous cell carcinoma | ||
| Skin | 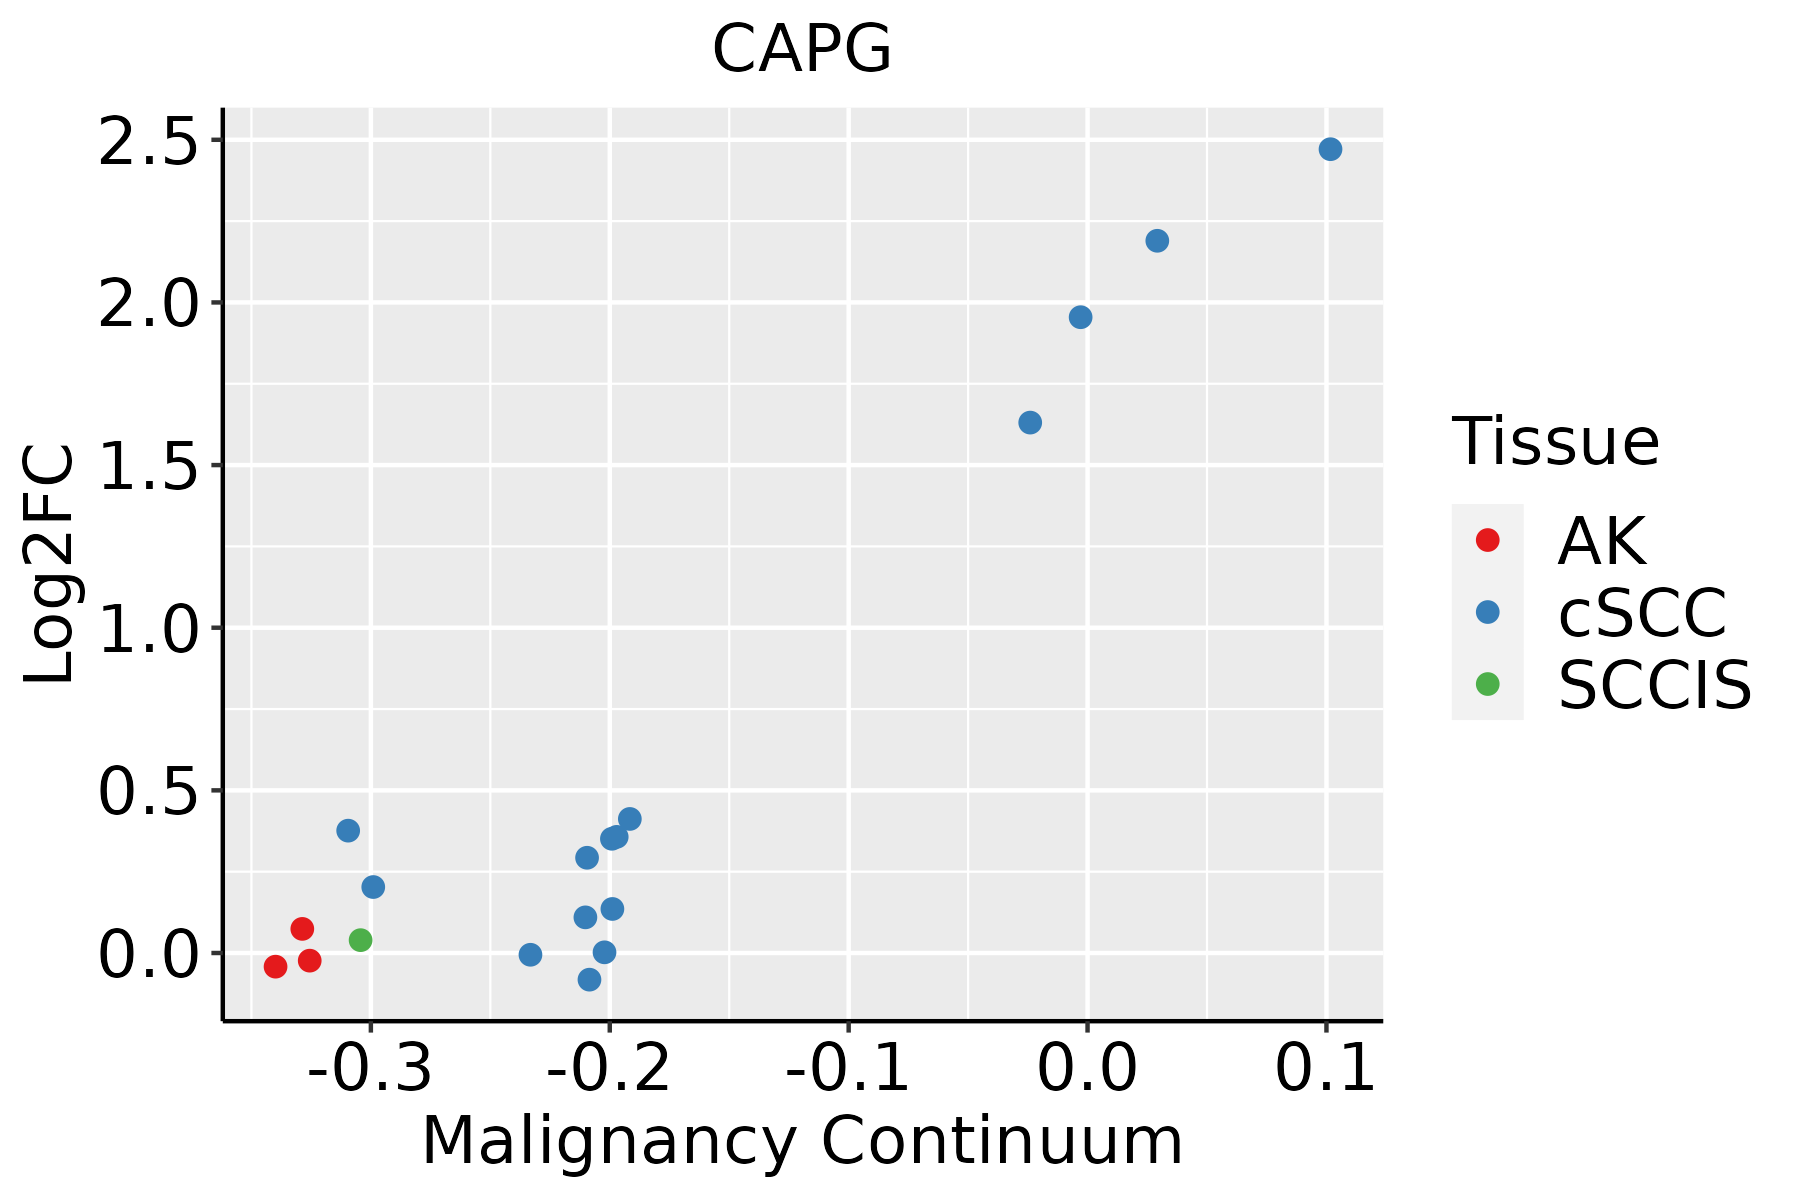 | AK: Actinic keratosis |
| cSCC: Cutaneous squamous cell carcinoma | ||
| SCCIS:squamous cell carcinoma in situ | ||
| Thyroid | 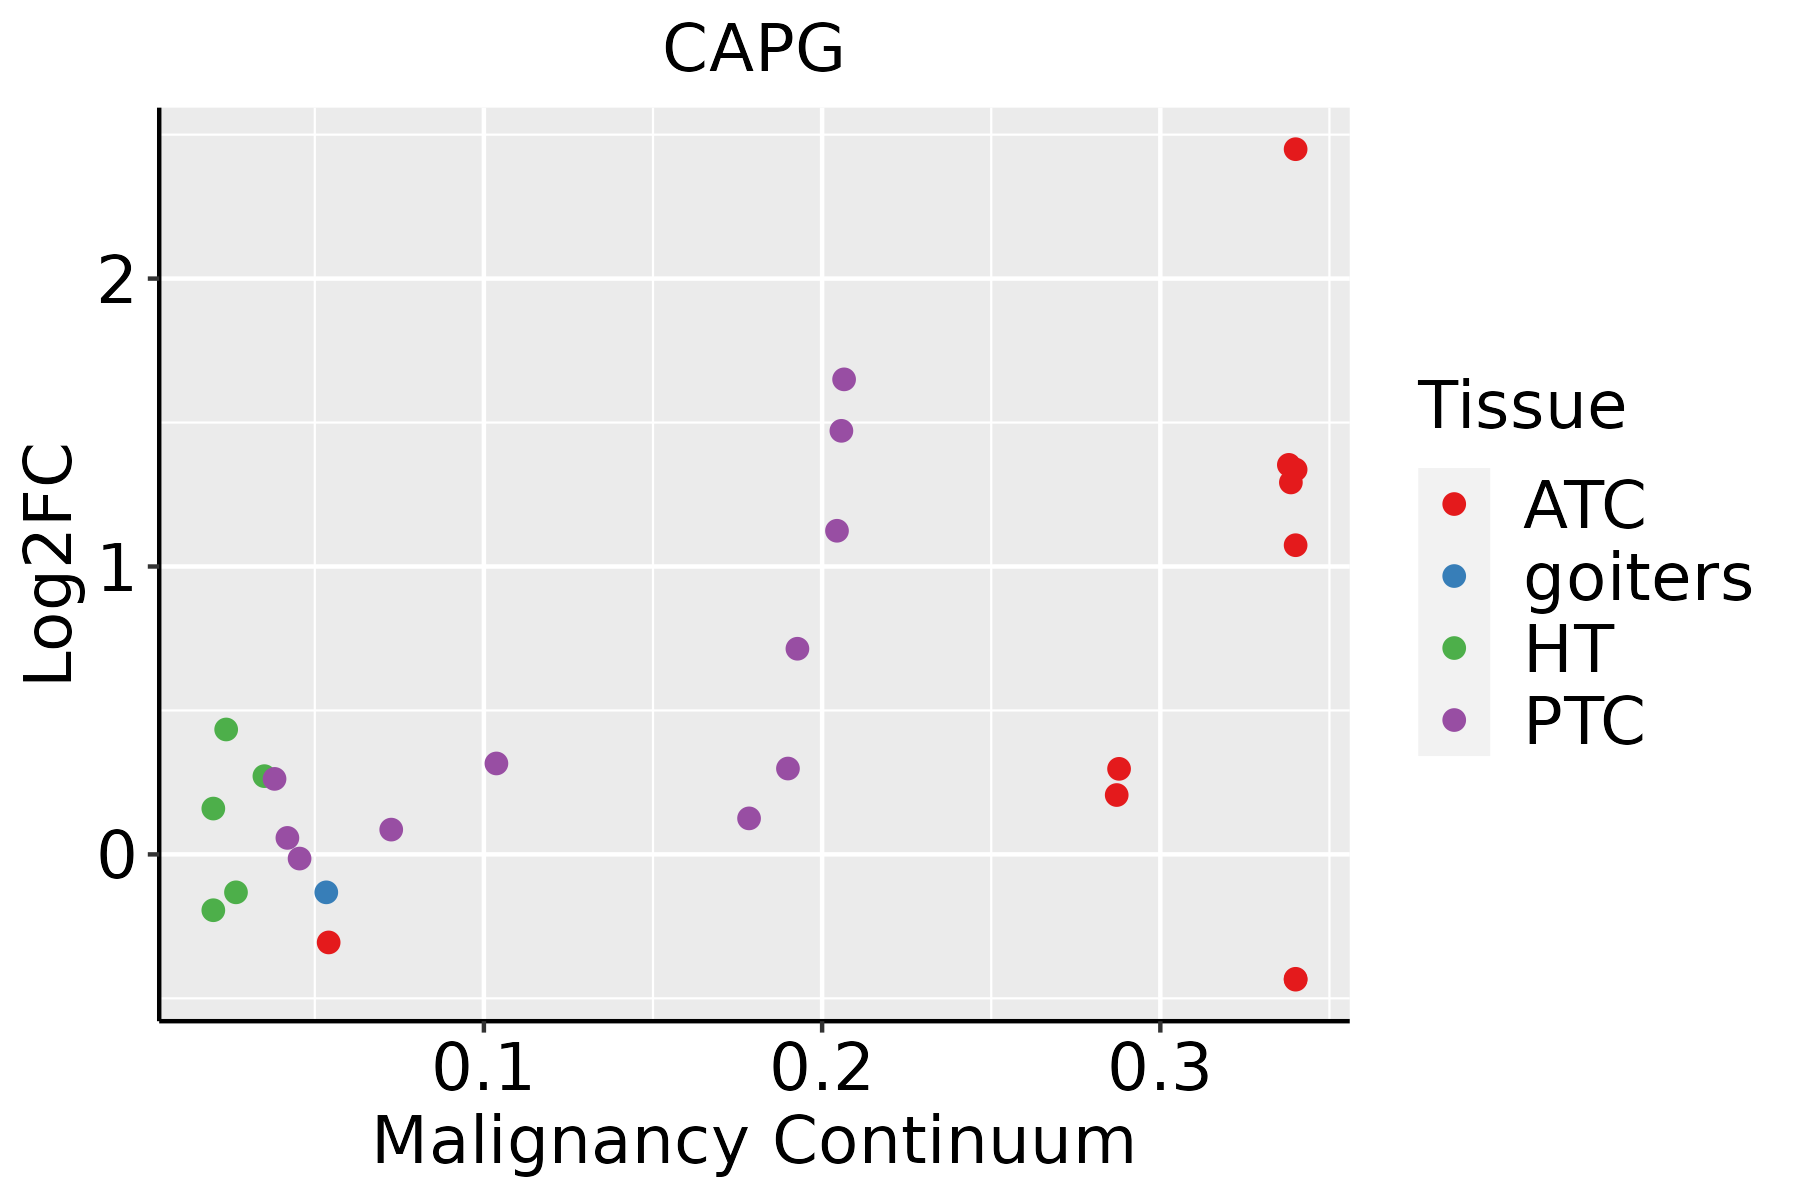 | ATC: Anaplastic thyroid cancer |
| HT: Hashimoto's thyroiditis | ||
| PTC: Papillary thyroid cancer |
| ∗log2FC in expression of this searched gene in stem-like cells from each diseased tissue sample relative to stem-like cells in normal samples in each tissue plotted against the malignancy continuum. Samples are colored based on if they are from different disease stage. |
Top |
Malignant transformation related pathway analysis |
| Find out the enriched GO biological processes and KEGG pathways involved in transition from healthy to precancer to cancer |
| Tissue | Disease Stage | Enriched GO biological Processes |
| Colorectum | AD |  |
| Colorectum | SER |  |
| Colorectum | MSS |  |
| Colorectum | MSI-H |  |
| Colorectum | FAP |  |
| ∗Top 15 enriched GO BP terms are showed in the bar plot of each disease state in each tissue. Each row represents a significant GO biological process which is colored according to the -log10(p.adjust). |
| Page: 1 2 3 4 5 6 7 8 9 |
| GO ID | Tissue | Disease Stage | Description | Gene Ratio | Bg Ratio | pvalue | p.adjust | Count |
| GO:00432549 | Breast | Precancer | regulation of protein-containing complex assembly | 50/1080 | 428/18723 | 1.63e-06 | 5.97e-05 | 50 |
| GO:19029039 | Breast | Precancer | regulation of supramolecular fiber organization | 42/1080 | 383/18723 | 4.92e-05 | 1.04e-03 | 42 |
| GO:00329709 | Breast | Precancer | regulation of actin filament-based process | 42/1080 | 397/18723 | 1.11e-04 | 2.01e-03 | 42 |
| GO:00070159 | Breast | Precancer | actin filament organization | 44/1080 | 442/18723 | 3.02e-04 | 4.35e-03 | 44 |
| GO:00224119 | Breast | Precancer | cellular component disassembly | 44/1080 | 443/18723 | 3.17e-04 | 4.51e-03 | 44 |
| GO:00329569 | Breast | Precancer | regulation of actin cytoskeleton organization | 36/1080 | 358/18723 | 8.56e-04 | 9.88e-03 | 36 |
| GO:00313338 | Breast | Precancer | negative regulation of protein-containing complex assembly | 18/1080 | 141/18723 | 1.27e-03 | 1.35e-02 | 18 |
| GO:01100539 | Breast | Precancer | regulation of actin filament organization | 29/1080 | 278/18723 | 1.50e-03 | 1.55e-02 | 29 |
| GO:004325414 | Breast | IDC | regulation of protein-containing complex assembly | 61/1434 | 428/18723 | 1.77e-06 | 7.31e-05 | 61 |
| GO:003297014 | Breast | IDC | regulation of actin filament-based process | 56/1434 | 397/18723 | 6.37e-06 | 1.99e-04 | 56 |
| GO:190290314 | Breast | IDC | regulation of supramolecular fiber organization | 54/1434 | 383/18723 | 9.40e-06 | 2.66e-04 | 54 |
| GO:003295614 | Breast | IDC | regulation of actin cytoskeleton organization | 48/1434 | 358/18723 | 1.03e-04 | 1.96e-03 | 48 |
| GO:000701514 | Breast | IDC | actin filament organization | 55/1434 | 442/18723 | 2.45e-04 | 3.84e-03 | 55 |
| GO:011005314 | Breast | IDC | regulation of actin filament organization | 37/1434 | 278/18723 | 7.01e-04 | 8.58e-03 | 37 |
| GO:00322719 | Breast | IDC | regulation of protein polymerization | 32/1434 | 233/18723 | 9.19e-04 | 1.05e-02 | 32 |
| GO:003133313 | Breast | IDC | negative regulation of protein-containing complex assembly | 22/1434 | 141/18723 | 1.07e-03 | 1.17e-02 | 22 |
| GO:00512589 | Breast | IDC | protein polymerization | 38/1434 | 297/18723 | 1.26e-03 | 1.34e-02 | 38 |
| GO:00325358 | Breast | IDC | regulation of cellular component size | 45/1434 | 383/18723 | 2.72e-03 | 2.41e-02 | 45 |
| GO:004325424 | Breast | DCIS | regulation of protein-containing complex assembly | 61/1390 | 428/18723 | 6.32e-07 | 2.71e-05 | 61 |
| GO:003297024 | Breast | DCIS | regulation of actin filament-based process | 56/1390 | 397/18723 | 2.50e-06 | 8.74e-05 | 56 |
| Page: 1 2 3 4 5 6 7 8 9 10 11 12 13 14 15 16 17 18 19 20 21 22 23 24 25 26 27 28 29 30 31 |
| Pathway ID | Tissue | Disease Stage | Description | Gene Ratio | Bg Ratio | pvalue | p.adjust | qvalue | Count |
| Page: 1 |
Top |
Cell-cell communication analysis |
| Identification of potential cell-cell interactions between two cell types and their ligand-receptor pairs for different disease states |
| Ligand | Receptor | LRpair | Pathway | Tissue | Disease Stage |
| Page: 1 |
Top |
Single-cell gene regulatory network inference analysis |
| Find out the significant the regulons (TFs) and the target genes of each regulon across cell types for different disease states |
| TF | Cell Type | Tissue | Disease Stage | Target Gene | RSS | Regulon Activity |
| ∗The dot plots of a searched regulon are shown for all cell subpopulations in each disease state of each tissue based on the regulon specific score inferred using pySCENIC and by calculating the average expression. |
| Page: 1 |
Top |
Somatic mutation of malignant transformation related genes |
| Annotation of somatic variants for genes involved in malignant transformation |
| Hugo Symbol | Variant Class | Variant Classification | dbSNP RS | HGVSc | HGVSp | HGVSp Short | SWISSPROT | BIOTYPE | SIFT | PolyPhen | Tumor Sample Barcode | Tissue | Histology | Sex | Age | Stage | Therapy Types | Drugs | Outcome |
| CAPG | SNV | Missense_Mutation | c.181N>G | p.Leu61Val | p.L61V | P40121 | protein_coding | tolerated(0.11) | benign(0.04) | TCGA-D8-A1JD-01 | Breast | breast invasive carcinoma | Female | <65 | I/II | Chemotherapy | adriamycin | SD | |
| CAPG | insertion | Frame_Shift_Ins | novel | c.463_464insAGCACAGCTGCATGCAAGCAGGGTGGAGGGGAGA | p.Leu155GlnfsTer58 | p.L155Qfs*58 | P40121 | protein_coding | TCGA-A2-A0CU-01 | Breast | breast invasive carcinoma | Female | >=65 | I/II | Hormone Therapy | tamoxiphen | SD | ||
| CAPG | SNV | Missense_Mutation | rs566538644 | c.967N>A | p.Ala323Thr | p.A323T | P40121 | protein_coding | deleterious(0.01) | benign(0) | TCGA-EA-A410-01 | Cervix | cervical & endocervical cancer | Female | <65 | I/II | Unknown | Unknown | SD |
| CAPG | SNV | Missense_Mutation | c.902N>T | p.Ala301Val | p.A301V | P40121 | protein_coding | deleterious(0) | possibly_damaging(0.836) | TCGA-A6-2684-01 | Colorectum | colon adenocarcinoma | Female | >=65 | I/II | Unknown | Unknown | PD | |
| CAPG | SNV | Missense_Mutation | rs566538644 | c.967N>A | p.Ala323Thr | p.A323T | P40121 | protein_coding | deleterious(0.01) | benign(0) | TCGA-AA-3713-01 | Colorectum | colon adenocarcinoma | Male | >=65 | III/IV | Chemotherapy | 5-fluorouracil | PR |
| CAPG | SNV | Missense_Mutation | c.172G>T | p.Val58Phe | p.V58F | P40121 | protein_coding | tolerated(0.72) | benign(0.022) | TCGA-DM-A1D7-01 | Colorectum | colon adenocarcinoma | Male | >=65 | I/II | Unknown | Unknown | PD | |
| CAPG | deletion | Frame_Shift_Del | c.19delN | p.Gln7ArgfsTer23 | p.Q7Rfs*23 | P40121 | protein_coding | TCGA-DC-5869-01 | Colorectum | rectum adenocarcinoma | Female | <65 | III/IV | Unknown | Unknown | SD | |||
| CAPG | SNV | Missense_Mutation | novel | c.103N>A | p.Ala35Thr | p.A35T | P40121 | protein_coding | deleterious(0) | benign(0.011) | TCGA-A5-A0G1-01 | Endometrium | uterine corpus endometrioid carcinoma | Female | >=65 | I/II | Unknown | Unknown | SD |
| CAPG | SNV | Missense_Mutation | novel | c.460N>T | p.Ala154Ser | p.A154S | P40121 | protein_coding | tolerated(0.15) | benign(0.083) | TCGA-A5-A0G2-01 | Endometrium | uterine corpus endometrioid carcinoma | Female | <65 | III/IV | Unknown | Unknown | SD |
| CAPG | SNV | Missense_Mutation | rs768616851 | c.955C>T | p.Arg319Cys | p.R319C | P40121 | protein_coding | tolerated(0.05) | possibly_damaging(0.809) | TCGA-AX-A0J1-01 | Endometrium | uterine corpus endometrioid carcinoma | Female | >=65 | I/II | Unknown | Unknown | SD |
| Page: 1 2 3 4 |
Top |
Related drugs of malignant transformation related genes |
| Identification of chemicals and drugs interact with genes involved in malignant transfromation |
| (DGIdb 4.0) |
| Entrez ID | Symbol | Category | Interaction Types | Drug Claim Name | Drug Name | PMIDs |
| 822 | CAPG | NA | vincristine | VINCRISTINE |
| Page: 1 |

Copyright 2023-Present -The University of Texas Health Science Center at Houston |