
|
|||||
|
 | |
| |
| |
| |
| |
| |
|
Gene: CAP2 |
Gene summary for CAP2 |
| Gene information | Species | Human | Gene symbol | CAP2 | Gene ID | 10486 |
| Gene name | cyclase associated actin cytoskeleton regulatory protein 2 | |
| Gene Alias | CAP2 | |
| Cytomap | 6p22.3 | |
| Gene Type | protein-coding | GO ID | GO:0000902 | UniProtAcc | P40123 |
Top |
Malignant transformation analysis |
| Identification of the aberrant gene expression in precancerous and cancerous lesions by comparing the gene expression of stem-like cells in diseased tissues with normal stem cells |
| Entrez ID | Symbol | Replicates | Species | Organ | Tissue | Adj P-value | Log2FC | Malignancy |
| 10486 | CAP2 | LZE4T | Human | Esophagus | ESCC | 1.19e-02 | 1.52e-01 | 0.0811 |
| 10486 | CAP2 | LZE7T | Human | Esophagus | ESCC | 2.91e-07 | 4.05e-01 | 0.0667 |
| 10486 | CAP2 | P2T-E | Human | Esophagus | ESCC | 7.31e-04 | 1.50e-01 | 0.1177 |
| 10486 | CAP2 | P5T-E | Human | Esophagus | ESCC | 5.29e-03 | 1.39e-01 | 0.1327 |
| 10486 | CAP2 | P8T-E | Human | Esophagus | ESCC | 1.10e-12 | 3.11e-01 | 0.0889 |
| 10486 | CAP2 | P9T-E | Human | Esophagus | ESCC | 1.31e-02 | 1.05e-01 | 0.1131 |
| 10486 | CAP2 | P10T-E | Human | Esophagus | ESCC | 1.30e-12 | 2.59e-01 | 0.116 |
| 10486 | CAP2 | P11T-E | Human | Esophagus | ESCC | 1.16e-06 | 3.79e-01 | 0.1426 |
| 10486 | CAP2 | P12T-E | Human | Esophagus | ESCC | 2.70e-06 | 1.56e-01 | 0.1122 |
| 10486 | CAP2 | P15T-E | Human | Esophagus | ESCC | 9.29e-07 | 1.93e-01 | 0.1149 |
| 10486 | CAP2 | P16T-E | Human | Esophagus | ESCC | 2.79e-03 | 1.33e-01 | 0.1153 |
| 10486 | CAP2 | P19T-E | Human | Esophagus | ESCC | 1.60e-02 | 2.72e-01 | 0.1662 |
| 10486 | CAP2 | P21T-E | Human | Esophagus | ESCC | 2.92e-09 | 2.11e-01 | 0.1617 |
| 10486 | CAP2 | P30T-E | Human | Esophagus | ESCC | 2.30e-05 | 1.79e-01 | 0.137 |
| 10486 | CAP2 | P31T-E | Human | Esophagus | ESCC | 5.85e-17 | 3.04e-01 | 0.1251 |
| 10486 | CAP2 | P37T-E | Human | Esophagus | ESCC | 3.67e-05 | 1.19e-01 | 0.1371 |
| 10486 | CAP2 | P38T-E | Human | Esophagus | ESCC | 3.29e-05 | 3.49e-01 | 0.127 |
| 10486 | CAP2 | P47T-E | Human | Esophagus | ESCC | 9.34e-03 | 1.58e-01 | 0.1067 |
| 10486 | CAP2 | P48T-E | Human | Esophagus | ESCC | 7.50e-03 | 6.31e-02 | 0.0959 |
| 10486 | CAP2 | P52T-E | Human | Esophagus | ESCC | 2.59e-12 | 2.96e-01 | 0.1555 |
| Page: 1 2 3 |
| Tissue | Expression Dynamics | Abbreviation |
| Esophagus |  | ESCC: Esophageal squamous cell carcinoma |
| HGIN: High-grade intraepithelial neoplasias | ||
| LGIN: Low-grade intraepithelial neoplasias | ||
| Liver | 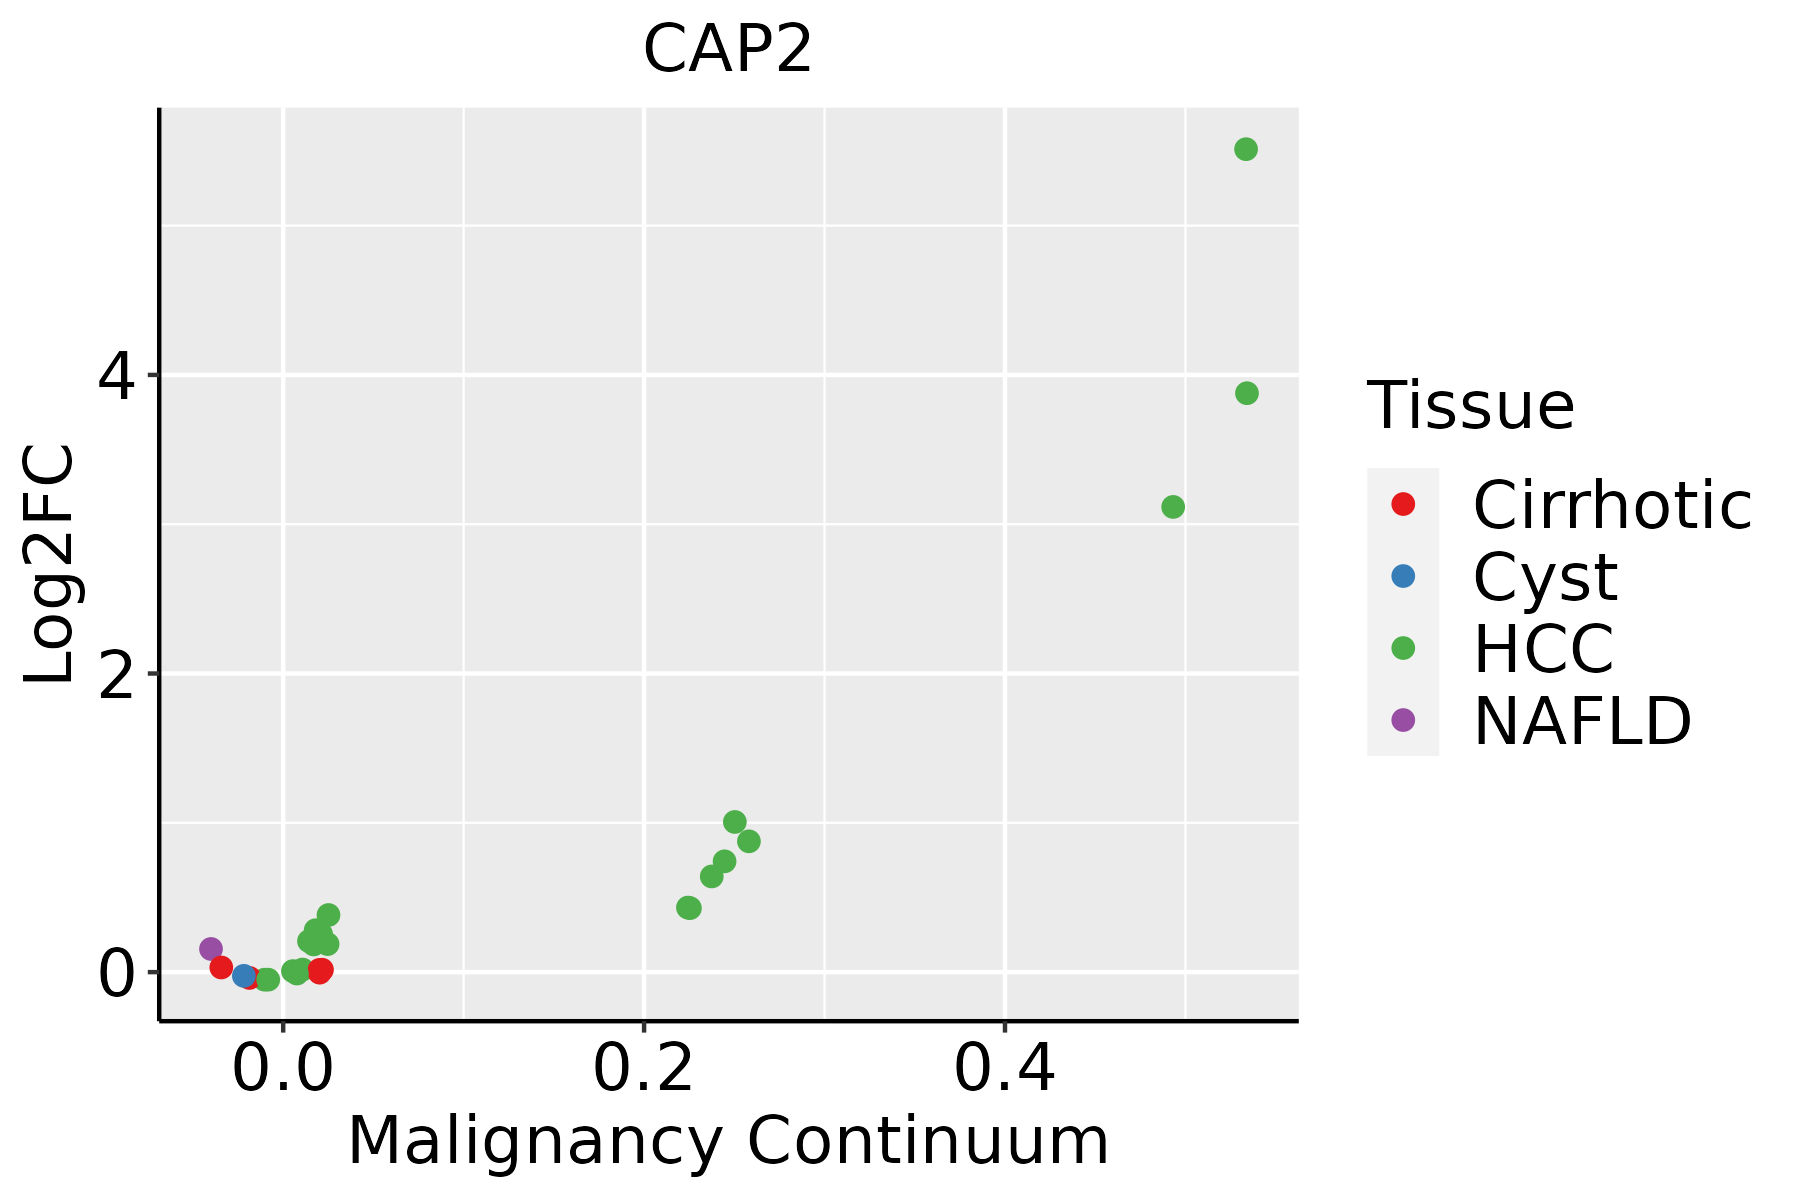 | HCC: Hepatocellular carcinoma |
| NAFLD: Non-alcoholic fatty liver disease |
| ∗log2FC in expression of this searched gene in stem-like cells from each diseased tissue sample relative to stem-like cells in normal samples in each tissue plotted against the malignancy continuum. Samples are colored based on if they are from different disease stage. |
Top |
Malignant transformation related pathway analysis |
| Find out the enriched GO biological processes and KEGG pathways involved in transition from healthy to precancer to cancer |
| Tissue | Disease Stage | Enriched GO biological Processes |
| Colorectum | AD |  |
| Colorectum | SER |  |
| Colorectum | MSS |  |
| Colorectum | MSI-H |  |
| Colorectum | FAP |  |
| ∗Top 15 enriched GO BP terms are showed in the bar plot of each disease state in each tissue. Each row represents a significant GO biological process which is colored according to the -log10(p.adjust). |
| Page: 1 2 3 4 5 6 7 8 9 |
| GO ID | Tissue | Disease Stage | Description | Gene Ratio | Bg Ratio | pvalue | p.adjust | Count |
| GO:00988767 | Cervix | CC | vesicle-mediated transport to the plasma membrane | 34/2311 | 136/18723 | 3.75e-05 | 5.91e-04 | 34 |
| GO:00161977 | Cervix | CC | endosomal transport | 48/2311 | 230/18723 | 1.65e-04 | 1.97e-03 | 48 |
| GO:19900909 | Cervix | CC | cellular response to nerve growth factor stimulus | 14/2311 | 53/18723 | 4.09e-03 | 2.54e-02 | 14 |
| GO:19900897 | Cervix | CC | response to nerve growth factor | 14/2311 | 56/18723 | 6.93e-03 | 3.74e-02 | 14 |
| GO:199009012 | Cervix | N_HPV | cellular response to nerve growth factor stimulus | 6/534 | 53/18723 | 3.86e-03 | 3.05e-02 | 6 |
| GO:199008913 | Cervix | N_HPV | response to nerve growth factor | 6/534 | 56/18723 | 5.08e-03 | 3.73e-02 | 6 |
| GO:0016197 | Colorectum | AD | endosomal transport | 90/3918 | 230/18723 | 1.88e-10 | 1.73e-08 | 90 |
| GO:0098876 | Colorectum | AD | vesicle-mediated transport to the plasma membrane | 57/3918 | 136/18723 | 2.30e-08 | 1.27e-06 | 57 |
| GO:1990090 | Colorectum | AD | cellular response to nerve growth factor stimulus | 26/3918 | 53/18723 | 4.87e-06 | 1.28e-04 | 26 |
| GO:1990089 | Colorectum | AD | response to nerve growth factor | 26/3918 | 56/18723 | 1.71e-05 | 3.59e-04 | 26 |
| GO:0032456 | Colorectum | AD | endocytic recycling | 28/3918 | 73/18723 | 4.87e-04 | 5.30e-03 | 28 |
| GO:00988762 | Colorectum | MSS | vesicle-mediated transport to the plasma membrane | 54/3467 | 136/18723 | 6.20e-09 | 3.95e-07 | 54 |
| GO:00161972 | Colorectum | MSS | endosomal transport | 79/3467 | 230/18723 | 7.04e-09 | 4.39e-07 | 79 |
| GO:19900902 | Colorectum | MSS | cellular response to nerve growth factor stimulus | 23/3467 | 53/18723 | 2.56e-05 | 5.31e-04 | 23 |
| GO:19900892 | Colorectum | MSS | response to nerve growth factor | 23/3467 | 56/18723 | 7.34e-05 | 1.23e-03 | 23 |
| GO:00324561 | Colorectum | MSS | endocytic recycling | 26/3467 | 73/18723 | 4.05e-04 | 4.99e-03 | 26 |
| GO:00988763 | Colorectum | FAP | vesicle-mediated transport to the plasma membrane | 42/2622 | 136/18723 | 3.16e-07 | 1.78e-05 | 42 |
| GO:00161973 | Colorectum | FAP | endosomal transport | 56/2622 | 230/18723 | 1.79e-05 | 4.53e-04 | 56 |
| GO:19900904 | Colorectum | FAP | cellular response to nerve growth factor stimulus | 17/2622 | 53/18723 | 6.20e-04 | 6.82e-03 | 17 |
| GO:19900893 | Colorectum | FAP | response to nerve growth factor | 17/2622 | 56/18723 | 1.24e-03 | 1.16e-02 | 17 |
| Page: 1 2 3 4 5 6 7 8 9 |
| Pathway ID | Tissue | Disease Stage | Description | Gene Ratio | Bg Ratio | pvalue | p.adjust | qvalue | Count |
| Page: 1 |
Top |
Cell-cell communication analysis |
| Identification of potential cell-cell interactions between two cell types and their ligand-receptor pairs for different disease states |
| Ligand | Receptor | LRpair | Pathway | Tissue | Disease Stage |
| Page: 1 |
Top |
Single-cell gene regulatory network inference analysis |
| Find out the significant the regulons (TFs) and the target genes of each regulon across cell types for different disease states |
| TF | Cell Type | Tissue | Disease Stage | Target Gene | RSS | Regulon Activity |
| ∗The dot plots of a searched regulon are shown for all cell subpopulations in each disease state of each tissue based on the regulon specific score inferred using pySCENIC and by calculating the average expression. |
| Page: 1 |
Top |
Somatic mutation of malignant transformation related genes |
| Annotation of somatic variants for genes involved in malignant transformation |
| Hugo Symbol | Variant Class | Variant Classification | dbSNP RS | HGVSc | HGVSp | HGVSp Short | SWISSPROT | BIOTYPE | SIFT | PolyPhen | Tumor Sample Barcode | Tissue | Histology | Sex | Age | Stage | Therapy Types | Drugs | Outcome |
| CAP2 | SNV | Missense_Mutation | c.1285N>C | p.Asp429His | p.D429H | P40123 | protein_coding | deleterious(0.04) | benign(0.134) | TCGA-A1-A0SH-01 | Breast | breast invasive carcinoma | Female | <65 | I/II | Chemotherapy | tc | SD | |
| CAP2 | SNV | Missense_Mutation | novel | c.630C>A | p.Ser210Arg | p.S210R | P40123 | protein_coding | deleterious(0) | possibly_damaging(0.877) | TCGA-A2-A0CT-01 | Breast | breast invasive carcinoma | Female | >=65 | I/II | Chemotherapy | cytoxan | SD |
| CAP2 | SNV | Missense_Mutation | c.4G>T | p.Ala2Ser | p.A2S | P40123 | protein_coding | tolerated(0.18) | benign(0.061) | TCGA-C8-A12X-01 | Breast | breast invasive carcinoma | Female | <65 | I/II | Unknown | Unknown | SD | |
| CAP2 | SNV | Missense_Mutation | c.280C>G | p.Gln94Glu | p.Q94E | P40123 | protein_coding | tolerated(0.27) | benign(0.119) | TCGA-D8-A1JA-01 | Breast | breast invasive carcinoma | Female | <65 | III/IV | Chemotherapy | adriamycin | PD | |
| CAP2 | SNV | Missense_Mutation | c.1385N>T | p.Ala462Val | p.A462V | P40123 | protein_coding | tolerated(1) | benign(0) | TCGA-AA-3710-01 | Colorectum | colon adenocarcinoma | Female | >=65 | I/II | Unknown | Unknown | SD | |
| CAP2 | SNV | Missense_Mutation | c.203N>T | p.Ala68Val | p.A68V | P40123 | protein_coding | deleterious(0) | benign(0.312) | TCGA-AA-3864-01 | Colorectum | colon adenocarcinoma | Male | >=65 | I/II | Unknown | Unknown | SD | |
| CAP2 | SNV | Missense_Mutation | novel | c.1165N>A | p.Val389Met | p.V389M | P40123 | protein_coding | deleterious(0.02) | probably_damaging(0.999) | TCGA-AA-3947-01 | Colorectum | colon adenocarcinoma | Female | <65 | I/II | Unknown | Unknown | SD |
| CAP2 | SNV | Missense_Mutation | novel | c.17N>A | p.Gly6Glu | p.G6E | P40123 | protein_coding | tolerated(0.59) | probably_damaging(0.987) | TCGA-CA-6717-01 | Colorectum | colon adenocarcinoma | Male | <65 | I/II | Chemotherapy | oxaliplatin | CR |
| CAP2 | SNV | Missense_Mutation | rs141863829 | c.50N>A | p.Arg17His | p.R17H | P40123 | protein_coding | deleterious(0.02) | probably_damaging(0.998) | TCGA-D5-6540-01 | Colorectum | colon adenocarcinoma | Male | >=65 | I/II | Unknown | Unknown | SD |
| CAP2 | SNV | Missense_Mutation | novel | c.938N>A | p.Pro313His | p.P313H | P40123 | protein_coding | deleterious(0.05) | possibly_damaging(0.633) | TCGA-A5-A0G1-01 | Endometrium | uterine corpus endometrioid carcinoma | Female | >=65 | I/II | Unknown | Unknown | SD |
| Page: 1 2 3 4 5 6 |
Top |
Related drugs of malignant transformation related genes |
| Identification of chemicals and drugs interact with genes involved in malignant transfromation |
| (DGIdb 4.0) |
| Entrez ID | Symbol | Category | Interaction Types | Drug Claim Name | Drug Name | PMIDs |
| Page: 1 |

Copyright 2023-Present -The University of Texas Health Science Center at Houston |