| Tissue | Expression Dynamics | Abbreviation |
| Breast | 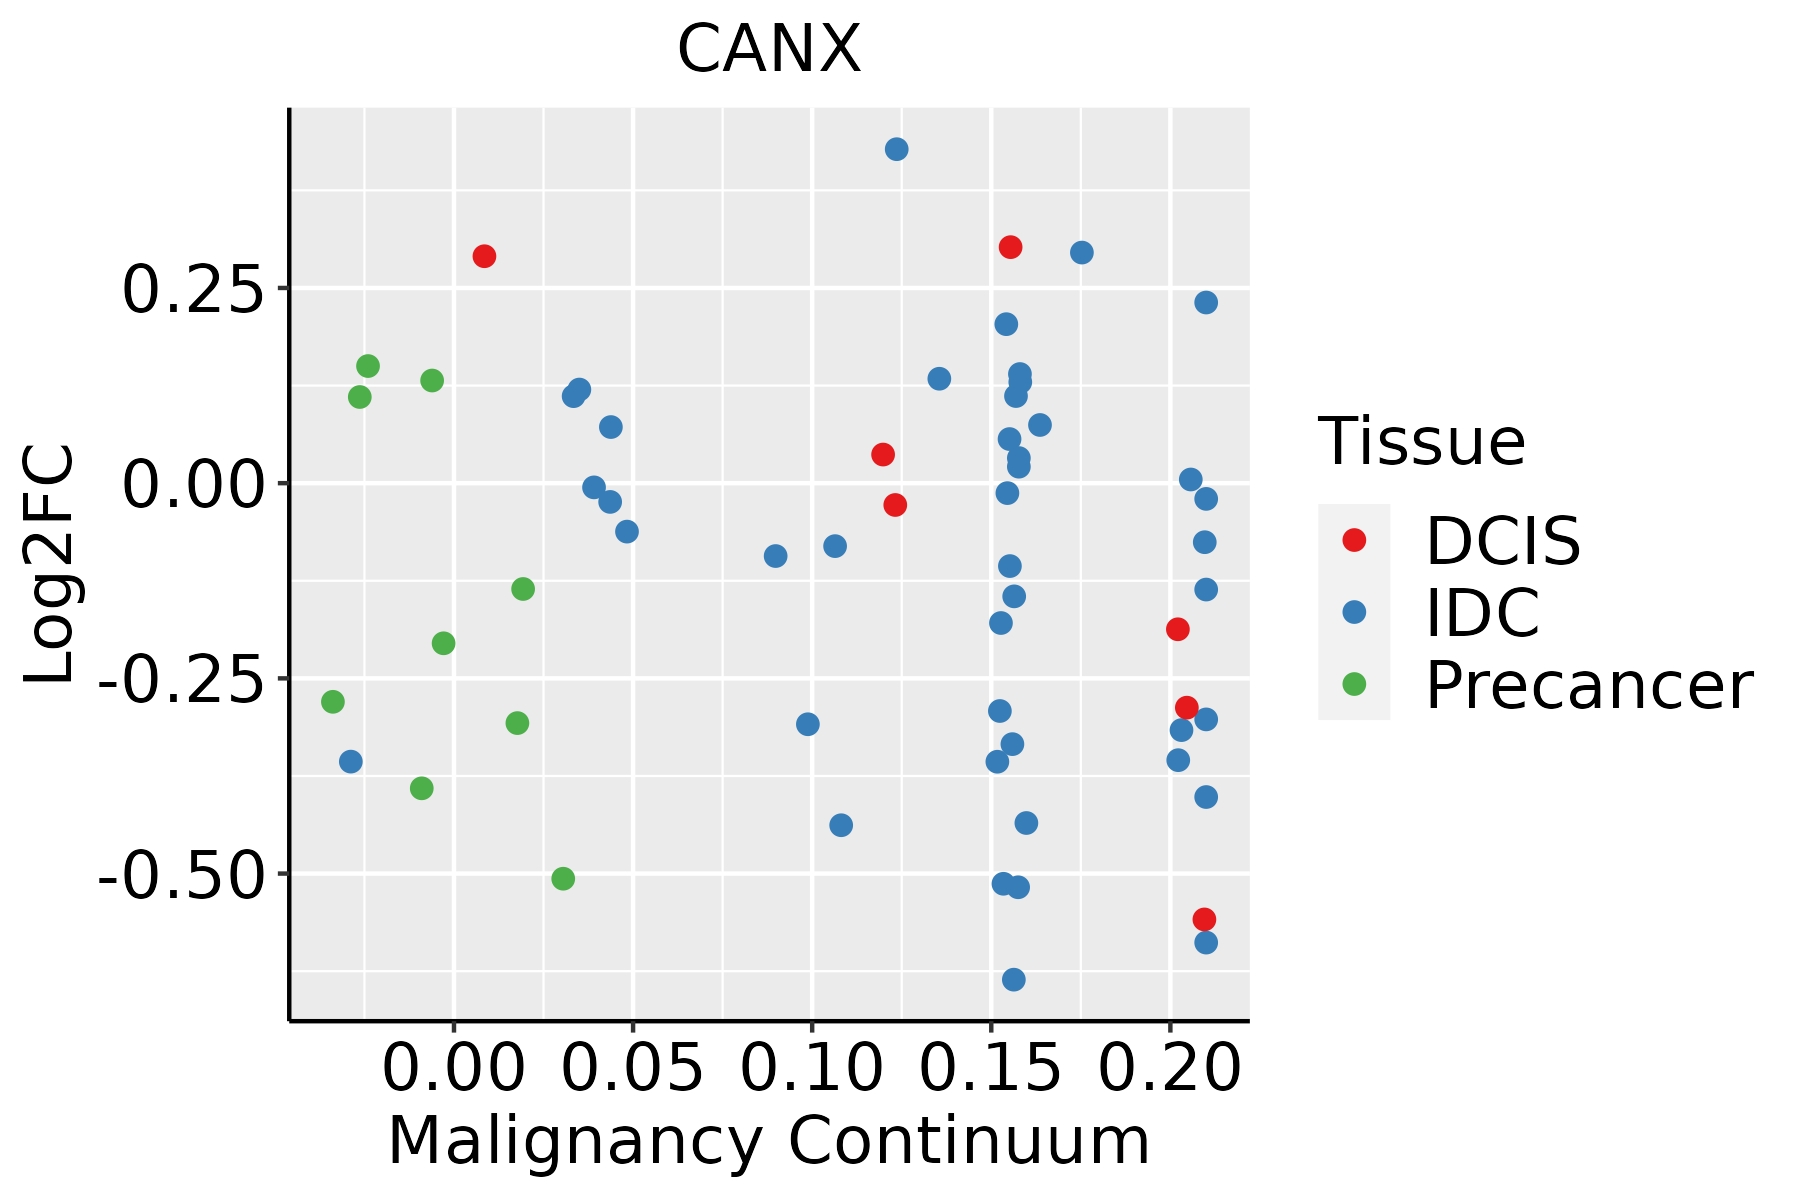 | IDC: Invasive ductal carcinoma |
| DCIS: Ductal carcinoma in situ |
| Precancer(BRCA1-mut): Precancerous lesion from BRCA1 mutation carriers |
| Cervix | 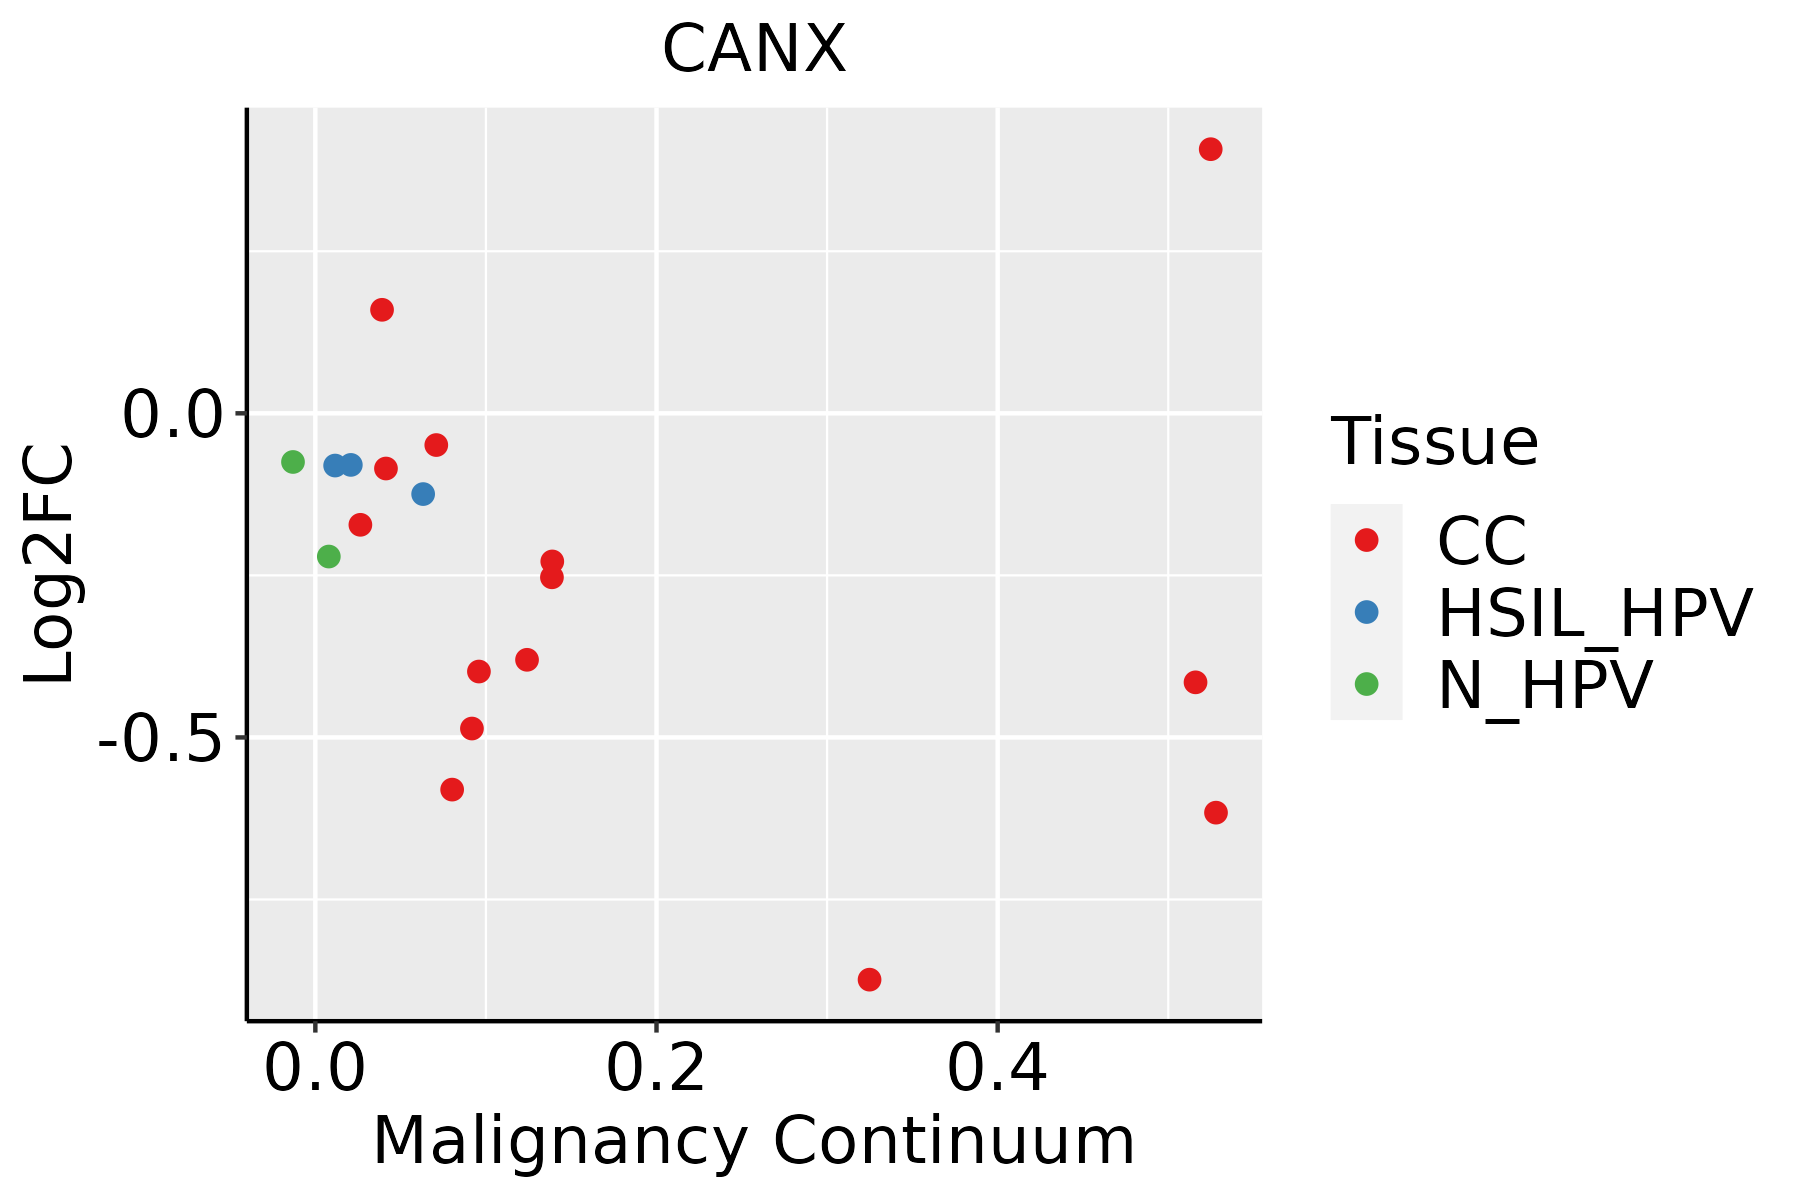 | CC: Cervix cancer |
| HSIL_HPV: HPV-infected high-grade squamous intraepithelial lesions |
| N_HPV: HPV-infected normal cervix |
| Colorectum (GSE201348) | 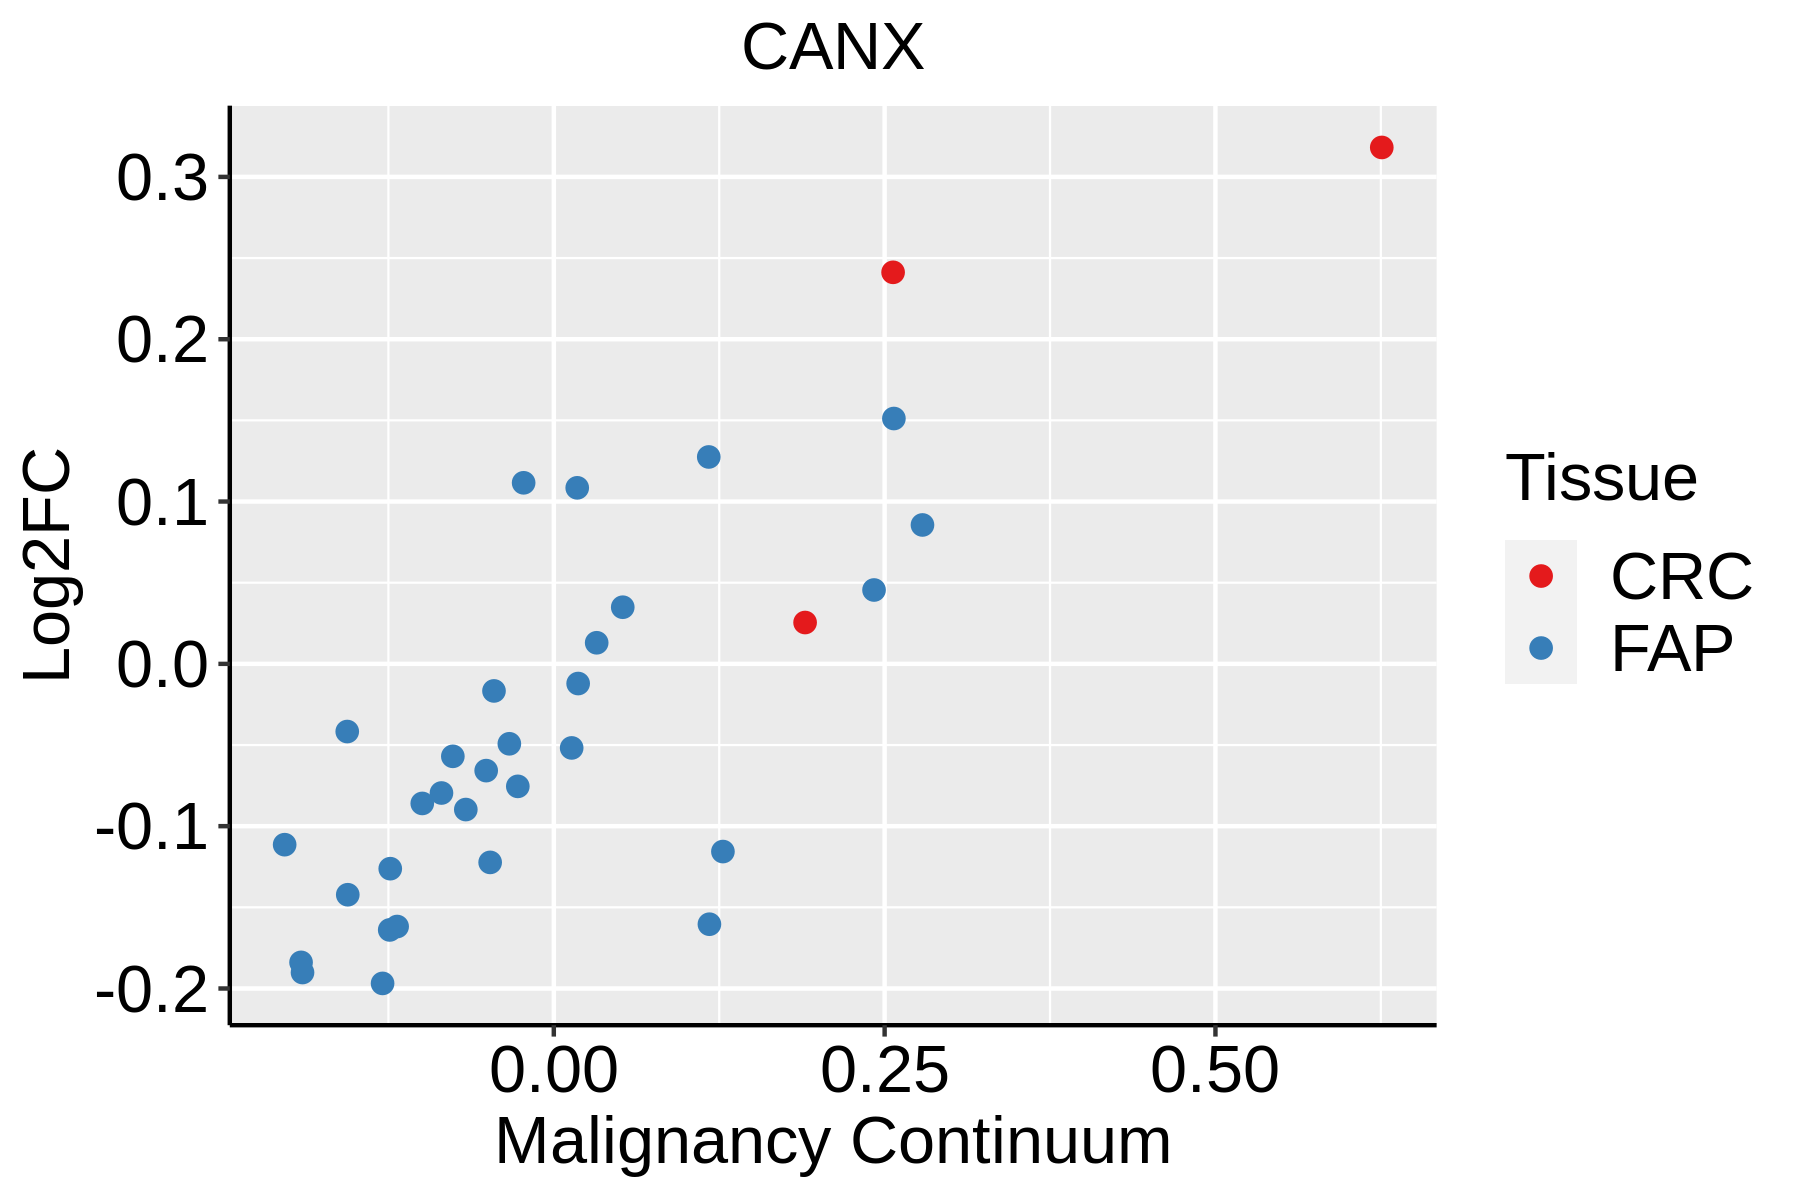 | FAP: Familial adenomatous polyposis |
| CRC: Colorectal cancer |
| Colorectum (HTA11) |  | AD: Adenomas |
| SER: Sessile serrated lesions |
| MSI-H: Microsatellite-high colorectal cancer |
| MSS: Microsatellite stable colorectal cancer |
| Endometrium | 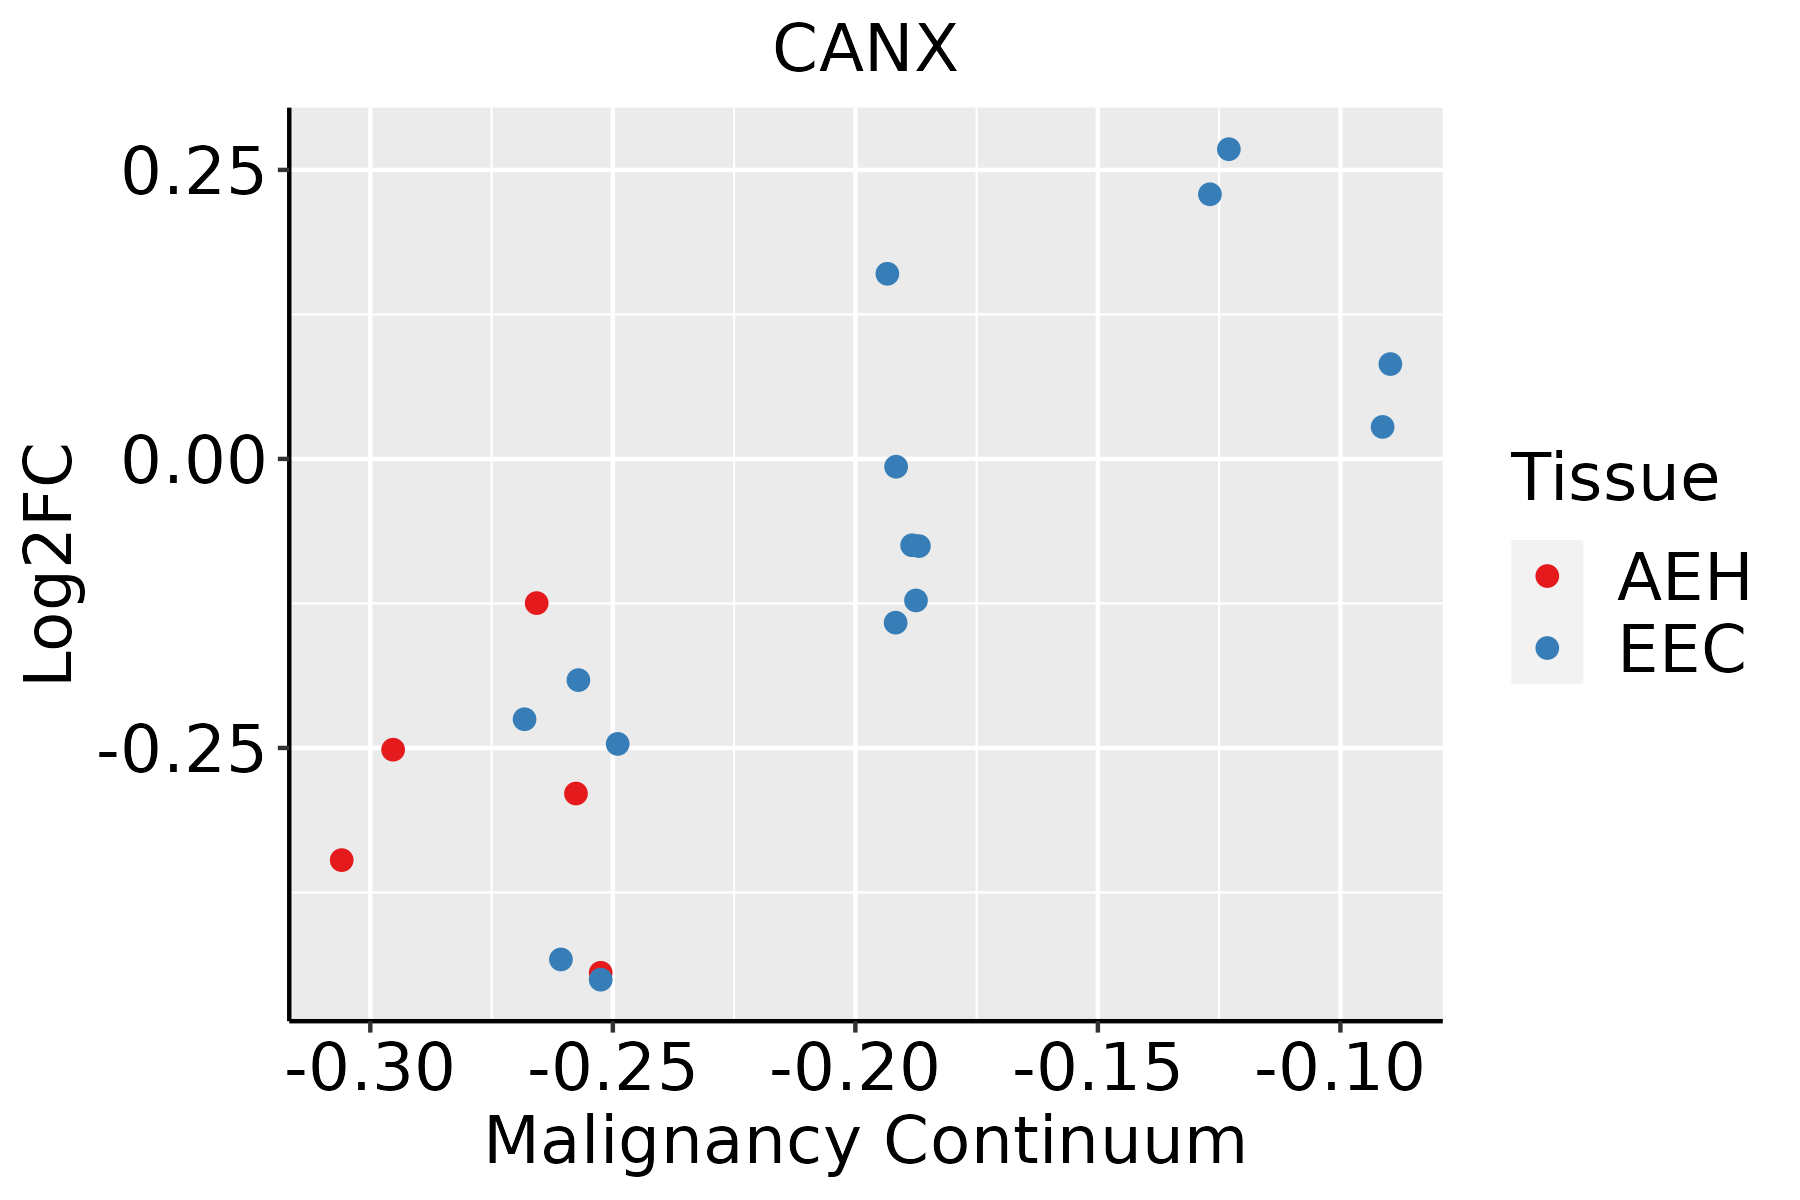 | AEH: Atypical endometrial hyperplasia |
| EEC: Endometrioid Cancer |
| Esophagus |  | ESCC: Esophageal squamous cell carcinoma |
| HGIN: High-grade intraepithelial neoplasias |
| LGIN: Low-grade intraepithelial neoplasias |
| GC | 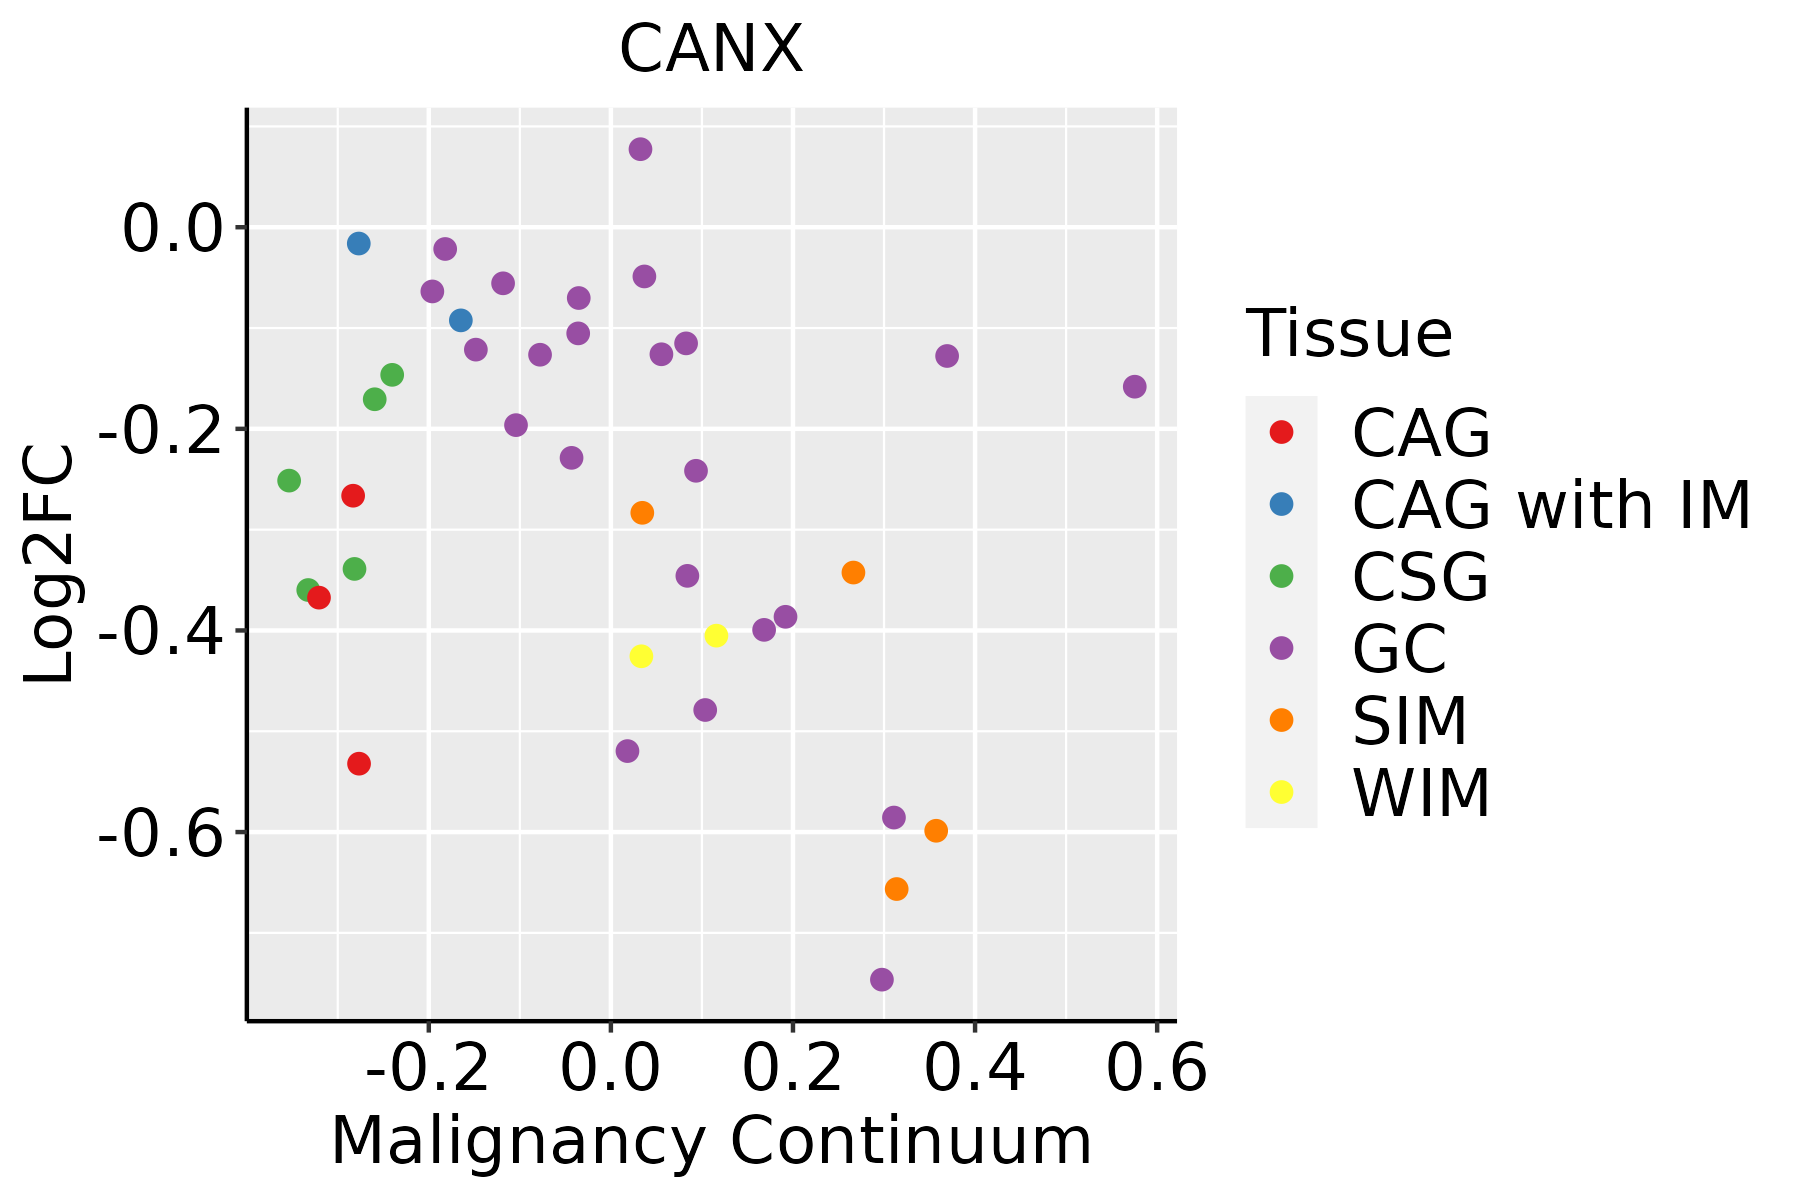 | CAG: Chronic atrophic gastritis |
| CAG with IM: Chronic atrophic gastritis with intestinal metaplasia |
| CSG: Chronic superficial gastritis |
| GC: Gastric cancer |
| SIM: Severe intestinal metaplasia |
| WIM: Wild intestinal metaplasia |
| Liver | 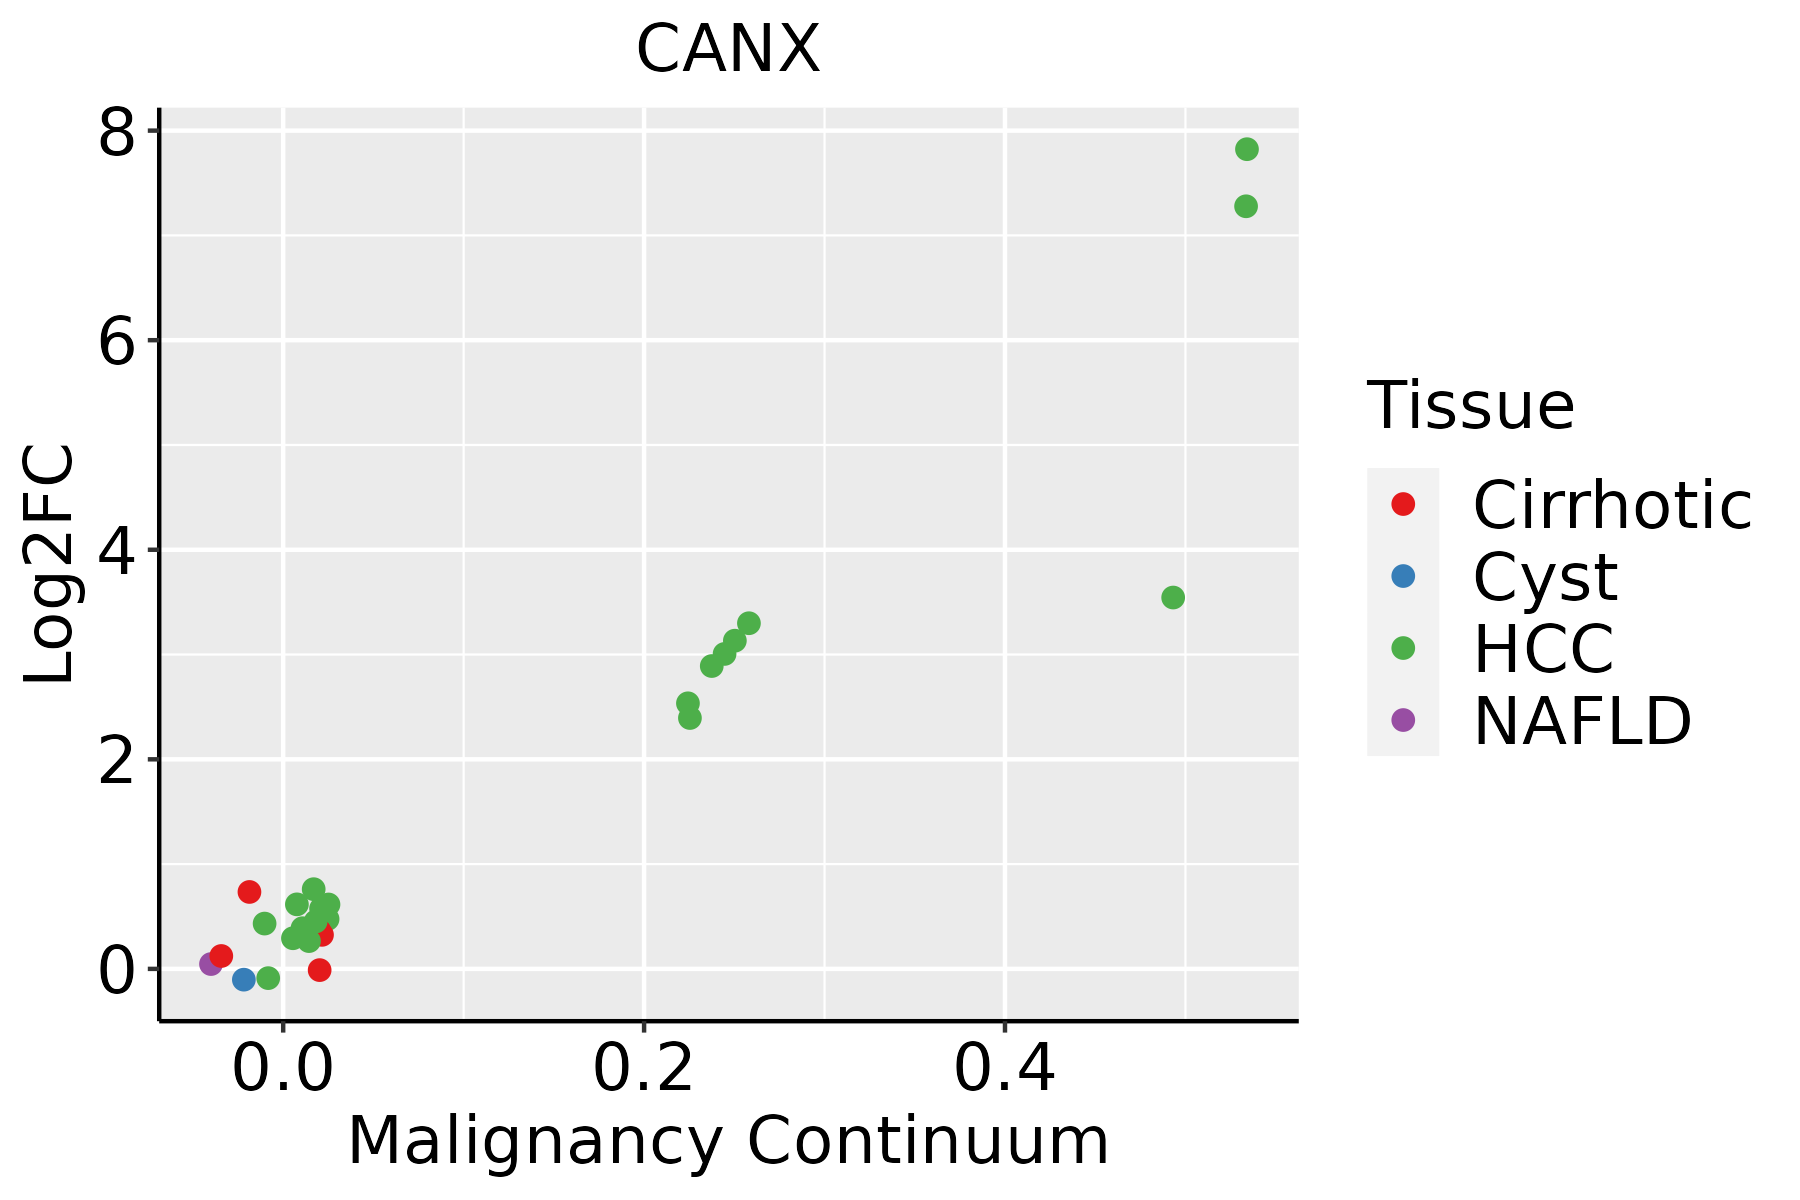 | HCC: Hepatocellular carcinoma |
| NAFLD: Non-alcoholic fatty liver disease |
| Oral Cavity |  | EOLP: Erosive Oral lichen planus |
| LP: leukoplakia |
| NEOLP: Non-erosive oral lichen planus |
| OSCC: Oral squamous cell carcinoma |
| Prostate | 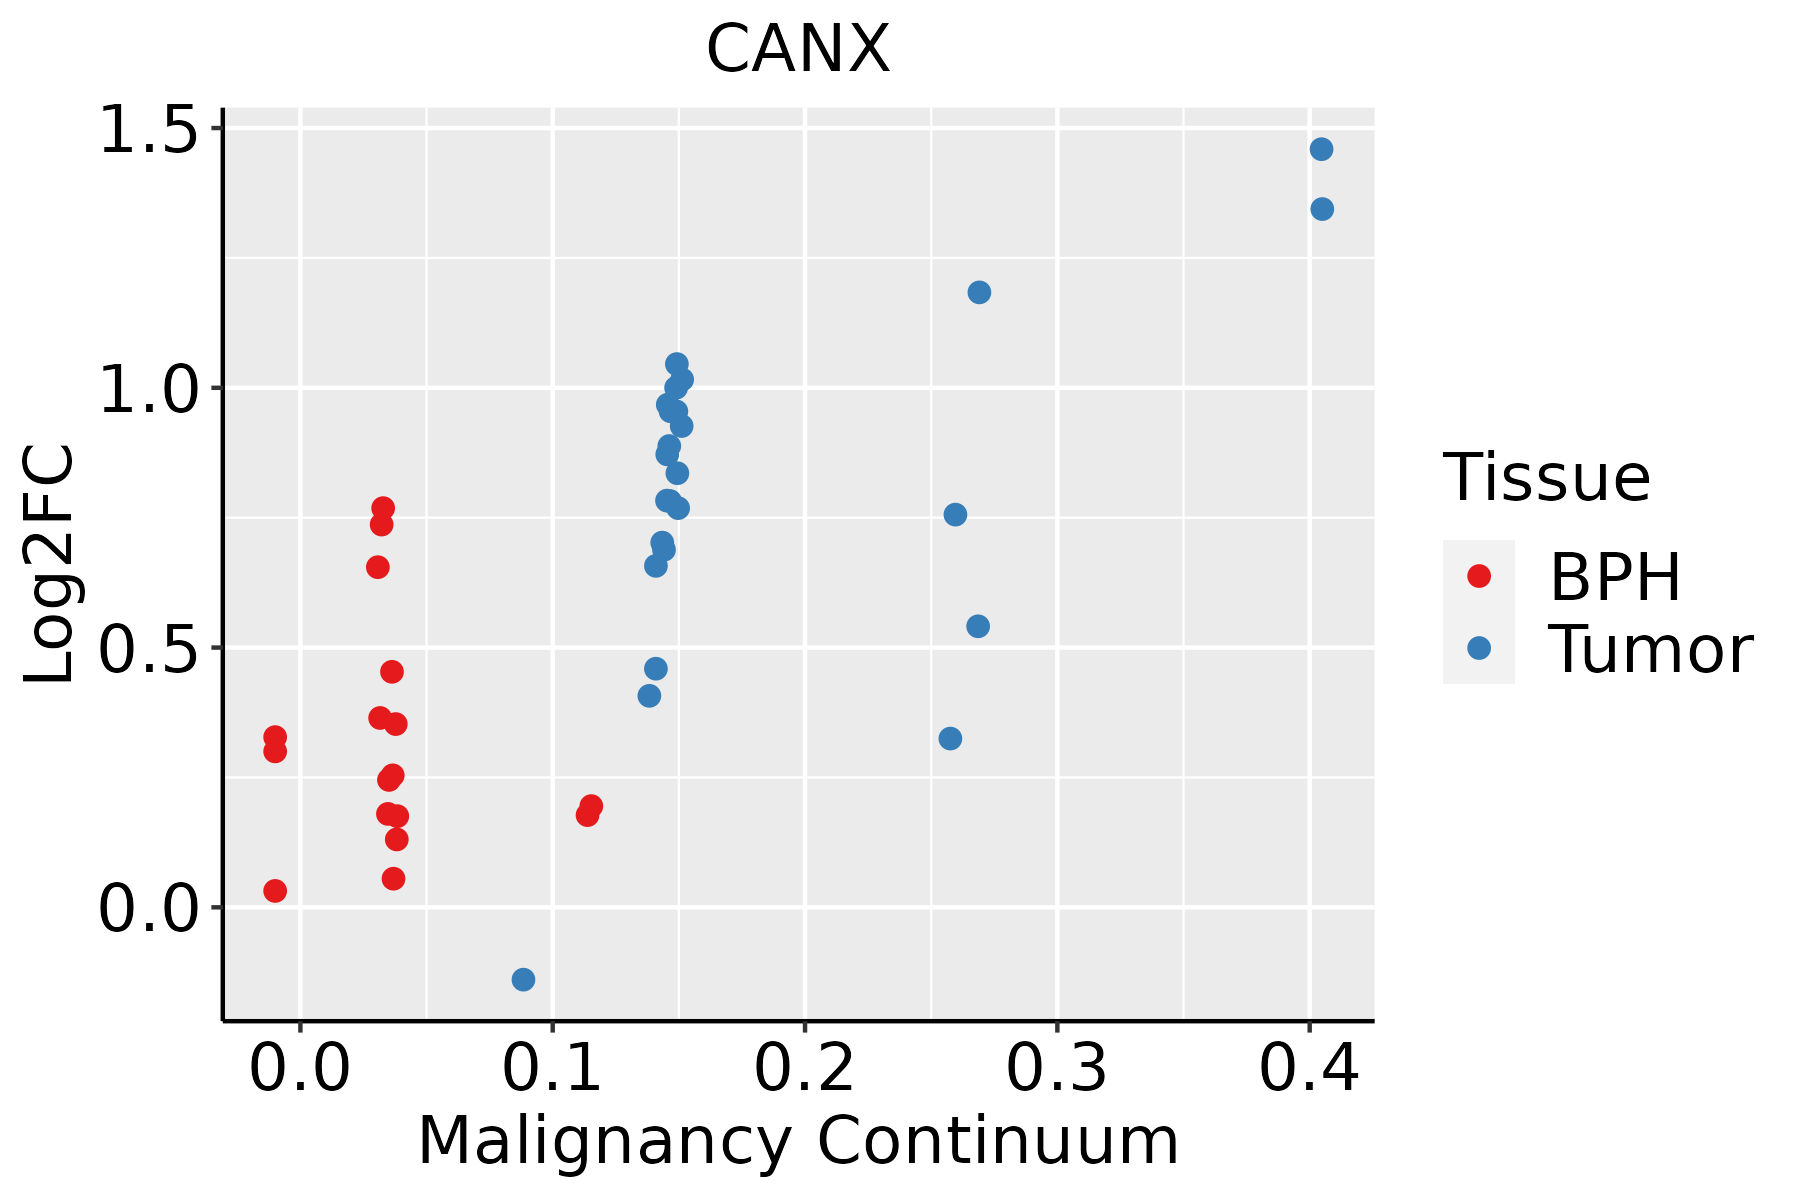 | BPH: Benign Prostatic Hyperplasia |
| Skin | 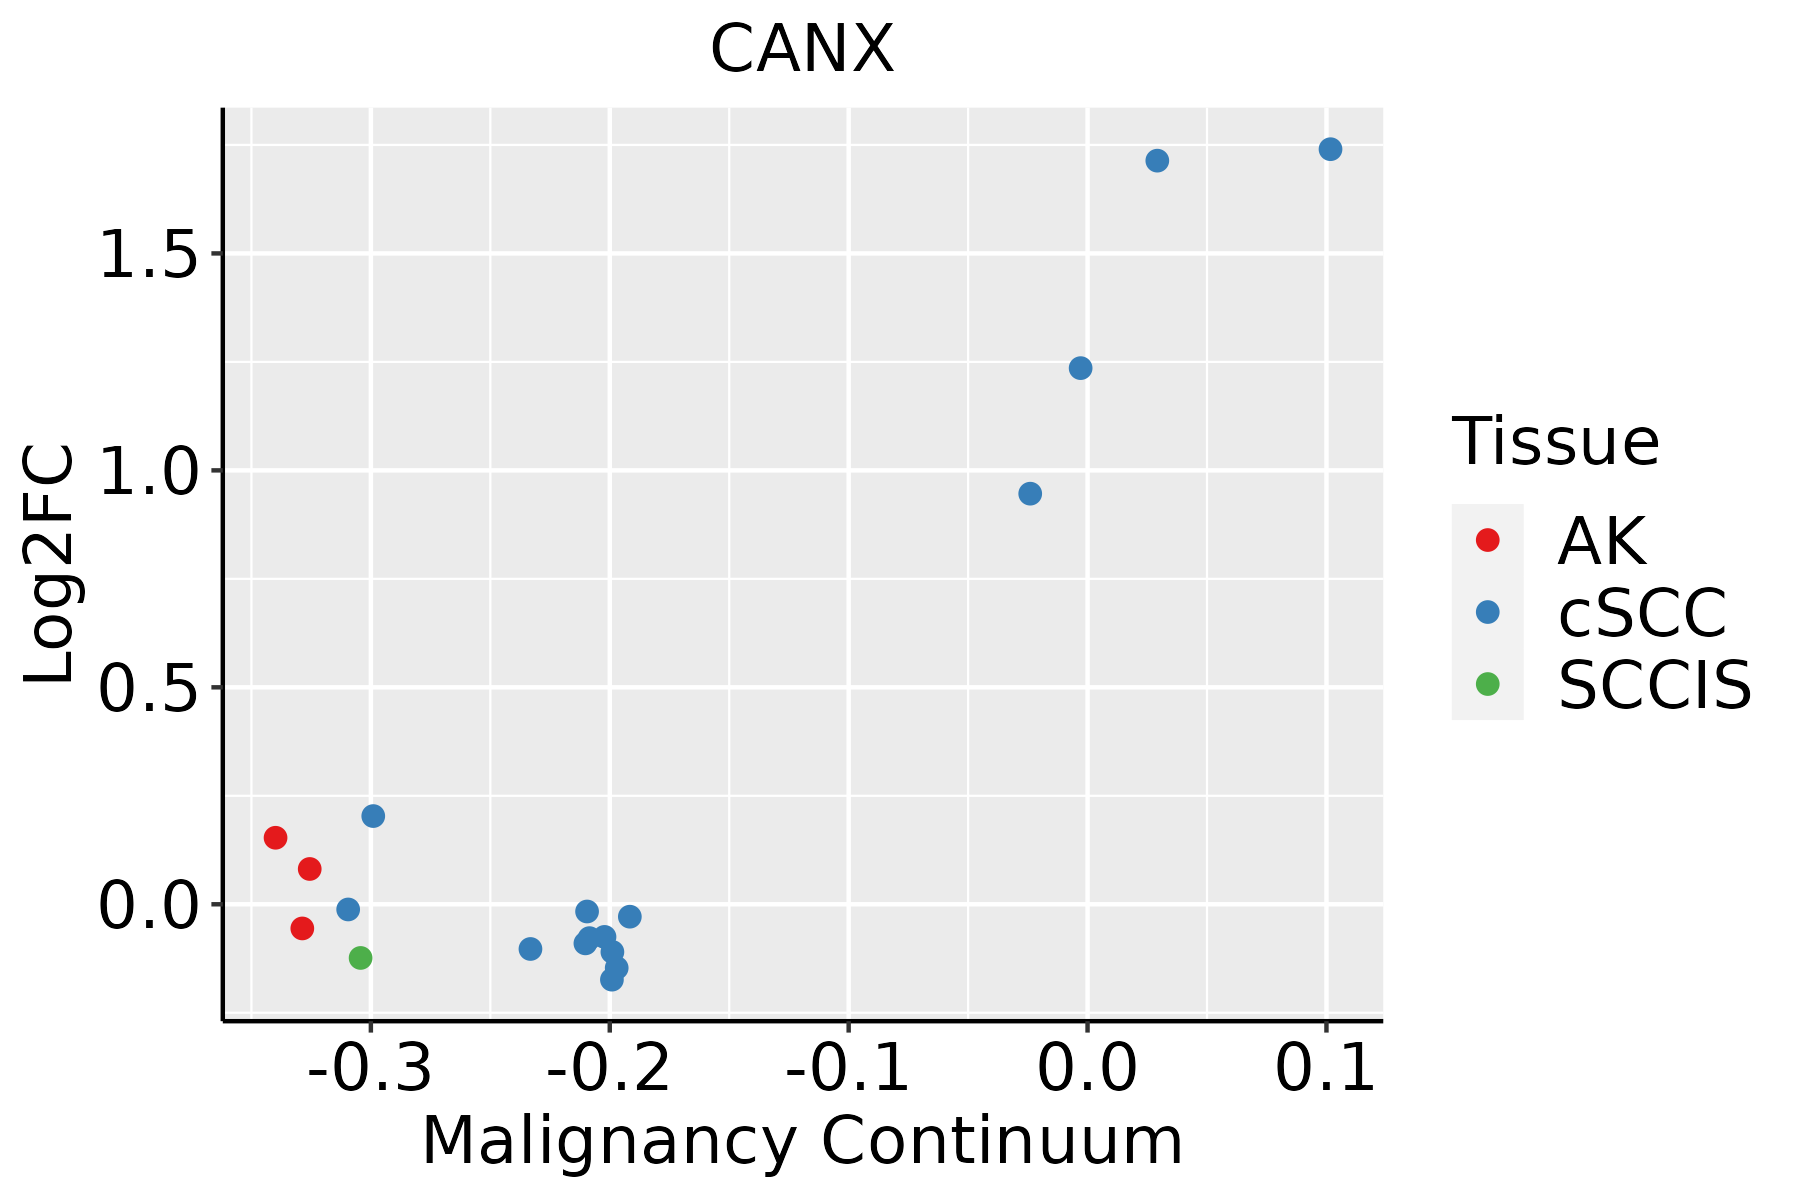 | AK: Actinic keratosis |
| cSCC: Cutaneous squamous cell carcinoma |
| SCCIS:squamous cell carcinoma in situ |
| Thyroid |  | ATC: Anaplastic thyroid cancer |
| HT: Hashimoto's thyroiditis |
| PTC: Papillary thyroid cancer |
| GO ID | Tissue | Disease Stage | Description | Gene Ratio | Bg Ratio | pvalue | p.adjust | Count |
| GO:00064578 | Breast | Precancer | protein folding | 43/1080 | 212/18723 | 3.48e-13 | 7.45e-11 | 43 |
| GO:00160329 | Breast | Precancer | viral process | 58/1080 | 415/18723 | 3.42e-10 | 3.16e-08 | 58 |
| GO:00349769 | Breast | Precancer | response to endoplasmic reticulum stress | 38/1080 | 256/18723 | 7.89e-08 | 4.60e-06 | 38 |
| GO:00104989 | Breast | Precancer | proteasomal protein catabolic process | 58/1080 | 490/18723 | 1.54e-07 | 8.05e-06 | 58 |
| GO:00075688 | Breast | Precancer | aging | 41/1080 | 339/18723 | 5.95e-06 | 1.71e-04 | 41 |
| GO:00349758 | Breast | Precancer | protein folding in endoplasmic reticulum | 6/1080 | 11/18723 | 1.31e-05 | 3.30e-04 | 6 |
| GO:00431619 | Breast | Precancer | proteasome-mediated ubiquitin-dependent protein catabolic process | 42/1080 | 412/18723 | 2.49e-04 | 3.72e-03 | 42 |
| GO:00068986 | Breast | Precancer | receptor-mediated endocytosis | 27/1080 | 244/18723 | 9.01e-04 | 1.03e-02 | 27 |
| GO:00716926 | Breast | Precancer | protein localization to extracellular region | 34/1080 | 368/18723 | 4.65e-03 | 3.58e-02 | 34 |
| GO:00093067 | Breast | Precancer | protein secretion | 33/1080 | 359/18723 | 5.65e-03 | 4.08e-02 | 33 |
| GO:00355927 | Breast | Precancer | establishment of protein localization to extracellular region | 33/1080 | 360/18723 | 5.89e-03 | 4.21e-02 | 33 |
| GO:001603214 | Breast | IDC | viral process | 75/1434 | 415/18723 | 1.98e-12 | 4.02e-10 | 75 |
| GO:000645713 | Breast | IDC | protein folding | 47/1434 | 212/18723 | 2.31e-11 | 3.86e-09 | 47 |
| GO:001049814 | Breast | IDC | proteasomal protein catabolic process | 75/1434 | 490/18723 | 5.59e-09 | 4.41e-07 | 75 |
| GO:003497614 | Breast | IDC | response to endoplasmic reticulum stress | 43/1434 | 256/18723 | 8.42e-07 | 3.82e-05 | 43 |
| GO:000756813 | Breast | IDC | aging | 52/1434 | 339/18723 | 1.14e-06 | 5.10e-05 | 52 |
| GO:004316114 | Breast | IDC | proteasome-mediated ubiquitin-dependent protein catabolic process | 57/1434 | 412/18723 | 9.55e-06 | 2.68e-04 | 57 |
| GO:003497513 | Breast | IDC | protein folding in endoplasmic reticulum | 6/1434 | 11/18723 | 6.59e-05 | 1.35e-03 | 6 |
| GO:000689813 | Breast | IDC | receptor-mediated endocytosis | 35/1434 | 244/18723 | 2.38e-04 | 3.75e-03 | 35 |
| GO:007169212 | Breast | IDC | protein localization to extracellular region | 42/1434 | 368/18723 | 6.13e-03 | 4.38e-02 | 42 |
| Pathway ID | Tissue | Disease Stage | Description | Gene Ratio | Bg Ratio | pvalue | p.adjust | qvalue | Count |
| hsa0414118 | Breast | Precancer | Protein processing in endoplasmic reticulum | 33/684 | 174/8465 | 2.78e-06 | 3.83e-05 | 2.94e-05 | 33 |
| hsa0461218 | Breast | Precancer | Antigen processing and presentation | 19/684 | 78/8465 | 9.61e-06 | 1.12e-04 | 8.62e-05 | 19 |
| hsa0516618 | Breast | Precancer | Human T-cell leukemia virus 1 infection | 33/684 | 222/8465 | 4.29e-04 | 3.31e-03 | 2.53e-03 | 33 |
| hsa0414119 | Breast | Precancer | Protein processing in endoplasmic reticulum | 33/684 | 174/8465 | 2.78e-06 | 3.83e-05 | 2.94e-05 | 33 |
| hsa0461219 | Breast | Precancer | Antigen processing and presentation | 19/684 | 78/8465 | 9.61e-06 | 1.12e-04 | 8.62e-05 | 19 |
| hsa0516619 | Breast | Precancer | Human T-cell leukemia virus 1 infection | 33/684 | 222/8465 | 4.29e-04 | 3.31e-03 | 2.53e-03 | 33 |
| hsa0461223 | Breast | IDC | Antigen processing and presentation | 24/867 | 78/8465 | 4.61e-07 | 8.33e-06 | 6.23e-06 | 24 |
| hsa0414522 | Breast | IDC | Phagosome | 34/867 | 152/8465 | 8.00e-06 | 9.99e-05 | 7.48e-05 | 34 |
| hsa0414124 | Breast | IDC | Protein processing in endoplasmic reticulum | 36/867 | 174/8465 | 2.73e-05 | 2.86e-04 | 2.14e-04 | 36 |
| hsa0516624 | Breast | IDC | Human T-cell leukemia virus 1 infection | 40/867 | 222/8465 | 2.52e-04 | 2.21e-03 | 1.66e-03 | 40 |
| hsa0461233 | Breast | IDC | Antigen processing and presentation | 24/867 | 78/8465 | 4.61e-07 | 8.33e-06 | 6.23e-06 | 24 |
| hsa0414532 | Breast | IDC | Phagosome | 34/867 | 152/8465 | 8.00e-06 | 9.99e-05 | 7.48e-05 | 34 |
| hsa0414134 | Breast | IDC | Protein processing in endoplasmic reticulum | 36/867 | 174/8465 | 2.73e-05 | 2.86e-04 | 2.14e-04 | 36 |
| hsa0516634 | Breast | IDC | Human T-cell leukemia virus 1 infection | 40/867 | 222/8465 | 2.52e-04 | 2.21e-03 | 1.66e-03 | 40 |
| hsa0461242 | Breast | DCIS | Antigen processing and presentation | 25/846 | 78/8465 | 6.75e-08 | 1.28e-06 | 9.45e-07 | 25 |
| hsa0414541 | Breast | DCIS | Phagosome | 35/846 | 152/8465 | 1.67e-06 | 2.45e-05 | 1.81e-05 | 35 |
| hsa0414143 | Breast | DCIS | Protein processing in endoplasmic reticulum | 36/846 | 174/8465 | 1.60e-05 | 1.91e-04 | 1.41e-04 | 36 |
| hsa0516642 | Breast | DCIS | Human T-cell leukemia virus 1 infection | 41/846 | 222/8465 | 7.03e-05 | 6.88e-04 | 5.07e-04 | 41 |
| hsa0461252 | Breast | DCIS | Antigen processing and presentation | 25/846 | 78/8465 | 6.75e-08 | 1.28e-06 | 9.45e-07 | 25 |
| hsa0414551 | Breast | DCIS | Phagosome | 35/846 | 152/8465 | 1.67e-06 | 2.45e-05 | 1.81e-05 | 35 |
| TF | Cell Type | Tissue | Disease Stage | Target Gene | RSS | Regulon Activity |
| CANX | MVA | Stomach | CAG | INHBB,HSP90B1,ST3GAL4, etc. | 9.29e-02 |  |
| CANX | LYMEND | Stomach | CSG | INHBB,HSP90B1,ST3GAL4, etc. | 0.00e+00 |  |
| CANX | MYOFIB | Stomach | WIM | INHBB,HSP90B1,ST3GAL4, etc. | 1.23e-01 |  |
| CANX | MSC | Stomach | WIM | INHBB,HSP90B1,ST3GAL4, etc. | 8.59e-02 | |
| Hugo Symbol | Variant Class | Variant Classification | dbSNP RS | HGVSc | HGVSp | HGVSp Short | SWISSPROT | BIOTYPE | SIFT | PolyPhen | Tumor Sample Barcode | Tissue | Histology | Sex | Age | Stage | Therapy Types | Drugs | Outcome |
| CANX | SNV | Missense_Mutation | novel | c.1057N>A | p.Pro353Thr | p.P353T | P27824 | protein_coding | deleterious(0) | probably_damaging(0.998) | TCGA-AC-A5XS-01 | Breast | breast invasive carcinoma | Female | >=65 | I/II | Hormone Therapy | femara | SD |
| CANX | SNV | Missense_Mutation | | c.1196N>T | p.Pro399Leu | p.P399L | P27824 | protein_coding | deleterious(0.01) | probably_damaging(0.949) | TCGA-AR-A250-01 | Breast | breast invasive carcinoma | Female | <65 | I/II | Chemotherapy | doxorubicin | SD |
| CANX | SNV | Missense_Mutation | | c.274N>C | p.Asp92His | p.D92H | P27824 | protein_coding | deleterious(0) | probably_damaging(0.993) | TCGA-BH-A18V-01 | Breast | breast invasive carcinoma | Female | <65 | I/II | Unknown | Unknown | SD |
| CANX | insertion | In_Frame_Ins | novel | c.1602_1603insCTTGGG | p.Glu534_Lys535insLeuGly | p.E534_K535insLG | P27824 | protein_coding | | | TCGA-B6-A0IK-01 | Breast | breast invasive carcinoma | Female | <65 | III/IV | Unknown | Unknown | PD |
| CANX | insertion | In_Frame_Ins | novel | c.1603_1604insTCC | p.Lys535delinsIleGln | p.K535delinsIQ | P27824 | protein_coding | | | TCGA-B6-A0IK-01 | Breast | breast invasive carcinoma | Female | <65 | III/IV | Unknown | Unknown | PD |
| CANX | deletion | Frame_Shift_Del | rs760711956 | c.1305delT | p.Phe435LeufsTer12 | p.F435Lfs*12 | P27824 | protein_coding | | | TCGA-D8-A1Y1-01 | Breast | breast invasive carcinoma | Female | >=65 | III/IV | Hormone Therapy | tamoxiphen | PD |
| CANX | deletion | Frame_Shift_Del | novel | c.135delN | p.Lys46AsnfsTer61 | p.K46Nfs*61 | P27824 | protein_coding | | | TCGA-EW-A2FV-01 | Breast | breast invasive carcinoma | Female | <65 | III/IV | Chemotherapy | docetaxel | SD |
| CANX | SNV | Missense_Mutation | novel | c.1060N>G | p.Gln354Glu | p.Q354E | P27824 | protein_coding | tolerated(0.28) | benign(0.078) | TCGA-C5-A2LZ-01 | Cervix | cervical & endocervical cancer | Female | >=65 | III/IV | Unknown | Unknown | PD |
| CANX | SNV | Missense_Mutation | rs756081134 | c.913N>A | p.Asp305Asn | p.D305N | P27824 | protein_coding | tolerated(0.07) | probably_damaging(0.914) | TCGA-C5-A7CK-01 | Cervix | cervical & endocervical cancer | Female | <65 | I/II | Chemotherapy | cisplatin | SD |
| CANX | SNV | Missense_Mutation | novel | c.1244N>A | p.Arg415Lys | p.R415K | P27824 | protein_coding | tolerated(1) | benign(0) | TCGA-JW-A5VL-01 | Cervix | cervical & endocervical cancer | Female | <65 | I/II | Unknown | Unknown | SD |


