
|
|||||
|
 | |
| |
| |
| |
| |
| |
|
Gene: CAMKMT |
Gene summary for CAMKMT |
| Gene information | Species | Human | Gene symbol | CAMKMT | Gene ID | 79823 |
| Gene name | calmodulin-lysine N-methyltransferase | |
| Gene Alias | C2orf34 | |
| Cytomap | 2p21 | |
| Gene Type | protein-coding | GO ID | GO:0006464 | UniProtAcc | Q7Z624 |
Top |
Malignant transformation analysis |
| Identification of the aberrant gene expression in precancerous and cancerous lesions by comparing the gene expression of stem-like cells in diseased tissues with normal stem cells |
| Entrez ID | Symbol | Replicates | Species | Organ | Tissue | Adj P-value | Log2FC | Malignancy |
| 79823 | CAMKMT | CCI_1 | Human | Cervix | CC | 4.56e-12 | 1.04e+00 | 0.528 |
| 79823 | CAMKMT | CCI_2 | Human | Cervix | CC | 3.19e-19 | 1.49e+00 | 0.5249 |
| 79823 | CAMKMT | CCI_3 | Human | Cervix | CC | 4.74e-19 | 8.77e-01 | 0.516 |
| 79823 | CAMKMT | HTA11_3410_2000001011 | Human | Colorectum | AD | 1.36e-11 | -5.68e-01 | 0.0155 |
| 79823 | CAMKMT | HTA11_347_2000001011 | Human | Colorectum | AD | 7.46e-03 | 4.38e-01 | -0.1954 |
| 79823 | CAMKMT | HTA11_3361_2000001011 | Human | Colorectum | AD | 1.78e-02 | -5.06e-01 | -0.1207 |
| 79823 | CAMKMT | HTA11_5212_2000001011 | Human | Colorectum | AD | 3.66e-04 | -6.35e-01 | -0.2061 |
| 79823 | CAMKMT | HTA11_7862_2000001011 | Human | Colorectum | AD | 1.80e-02 | -4.64e-01 | -0.0179 |
| 79823 | CAMKMT | HTA11_866_3004761011 | Human | Colorectum | AD | 8.00e-03 | -4.11e-01 | 0.096 |
| 79823 | CAMKMT | HTA11_9408_2000001011 | Human | Colorectum | AD | 3.86e-04 | -7.44e-01 | 0.0451 |
| 79823 | CAMKMT | HTA11_8622_2000001021 | Human | Colorectum | SER | 1.03e-04 | -6.30e-01 | 0.0528 |
| 79823 | CAMKMT | HTA11_99999970781_79442 | Human | Colorectum | MSS | 4.85e-02 | -2.71e-01 | 0.294 |
| 79823 | CAMKMT | HTA11_99999965104_69814 | Human | Colorectum | MSS | 4.06e-12 | 8.72e-01 | 0.281 |
| 79823 | CAMKMT | HTA11_99999974143_84620 | Human | Colorectum | MSS | 1.49e-15 | -4.87e-01 | 0.3005 |
| 79823 | CAMKMT | A015-C-203 | Human | Colorectum | FAP | 3.62e-41 | -6.42e-01 | -0.1294 |
| 79823 | CAMKMT | A015-C-204 | Human | Colorectum | FAP | 5.91e-06 | -5.02e-01 | -0.0228 |
| 79823 | CAMKMT | A014-C-040 | Human | Colorectum | FAP | 1.23e-05 | -5.65e-01 | -0.1184 |
| 79823 | CAMKMT | A002-C-201 | Human | Colorectum | FAP | 2.48e-15 | -5.75e-01 | 0.0324 |
| 79823 | CAMKMT | A001-C-119 | Human | Colorectum | FAP | 9.73e-11 | -6.67e-01 | -0.1557 |
| 79823 | CAMKMT | A001-C-108 | Human | Colorectum | FAP | 6.71e-19 | -3.70e-01 | -0.0272 |
| Page: 1 2 3 4 5 6 7 |
| Tissue | Expression Dynamics | Abbreviation |
| Cervix | 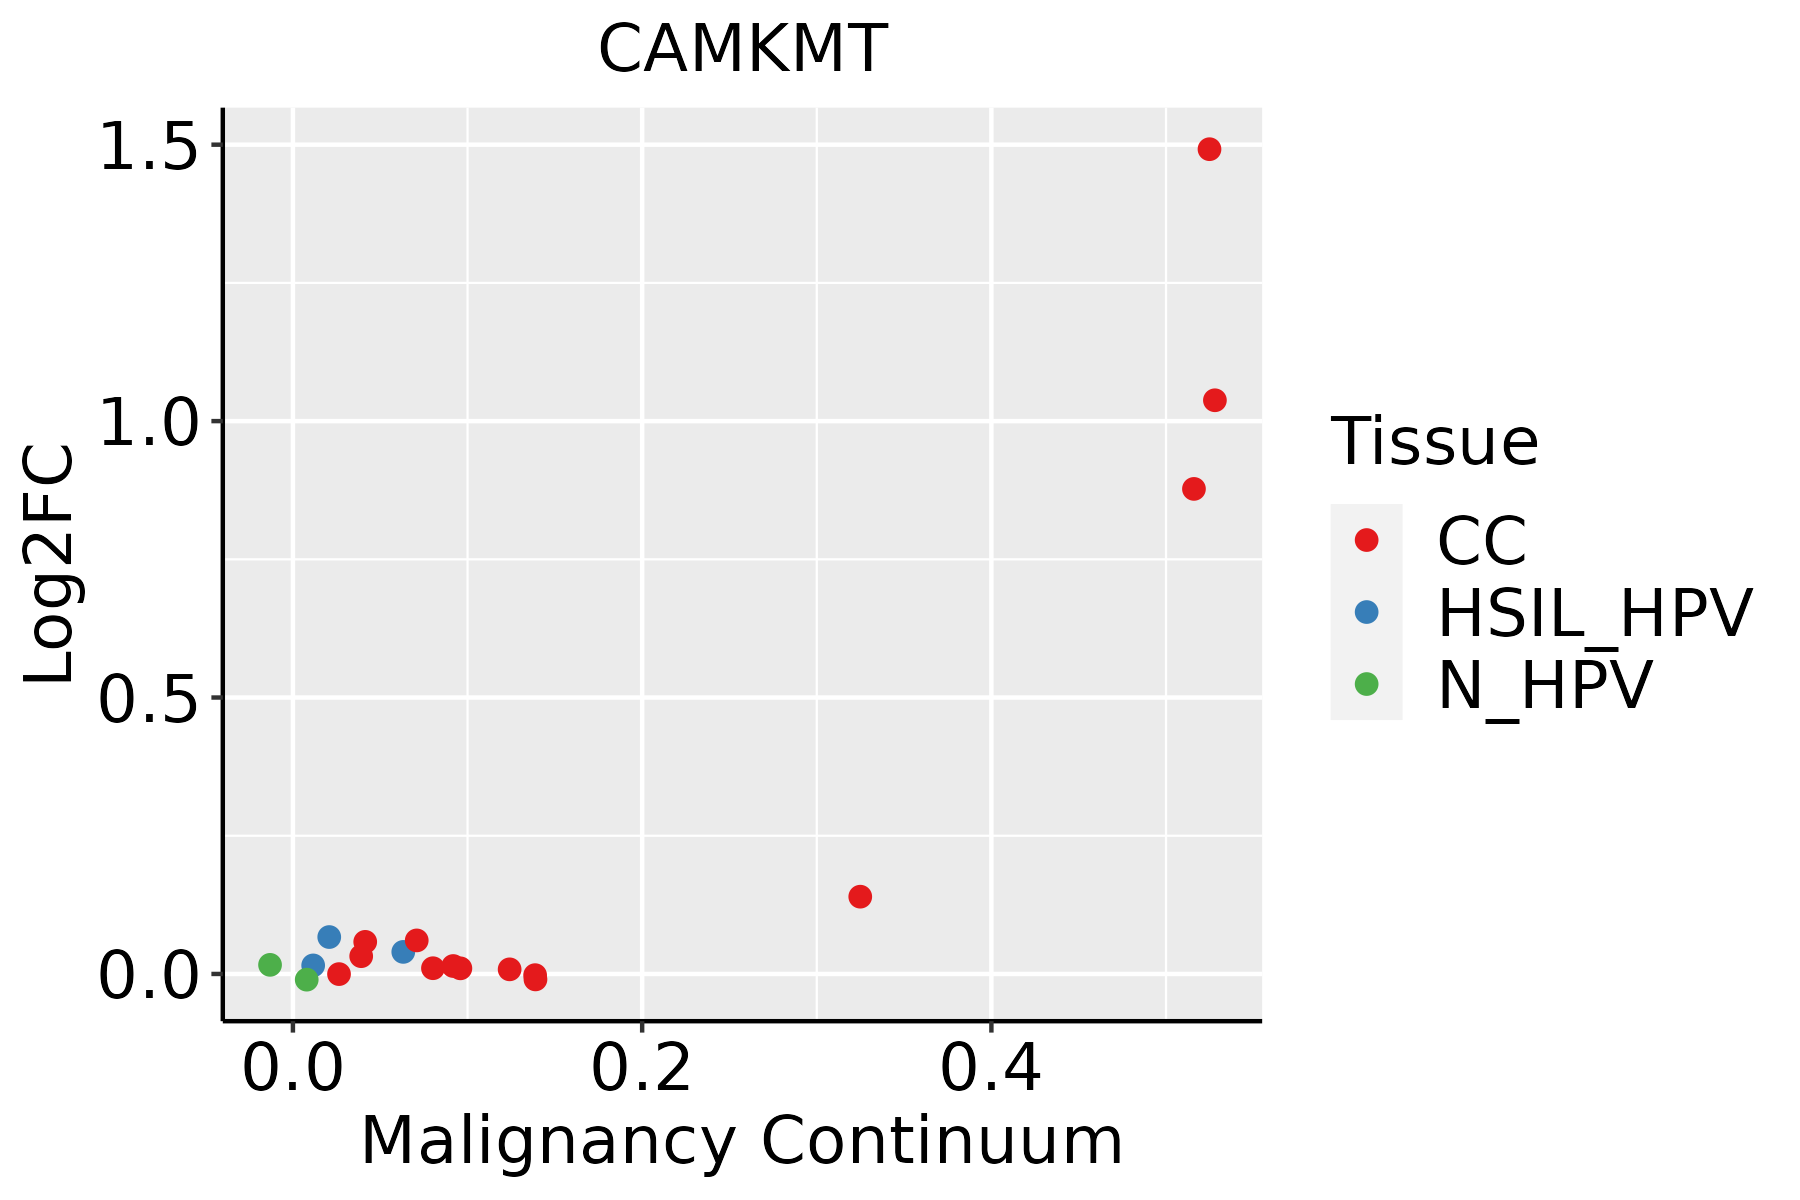 | CC: Cervix cancer |
| HSIL_HPV: HPV-infected high-grade squamous intraepithelial lesions | ||
| N_HPV: HPV-infected normal cervix | ||
| Colorectum (GSE201348) |  | FAP: Familial adenomatous polyposis |
| CRC: Colorectal cancer | ||
| Colorectum (HTA11) |  | AD: Adenomas |
| SER: Sessile serrated lesions | ||
| MSI-H: Microsatellite-high colorectal cancer | ||
| MSS: Microsatellite stable colorectal cancer | ||
| Endometrium | 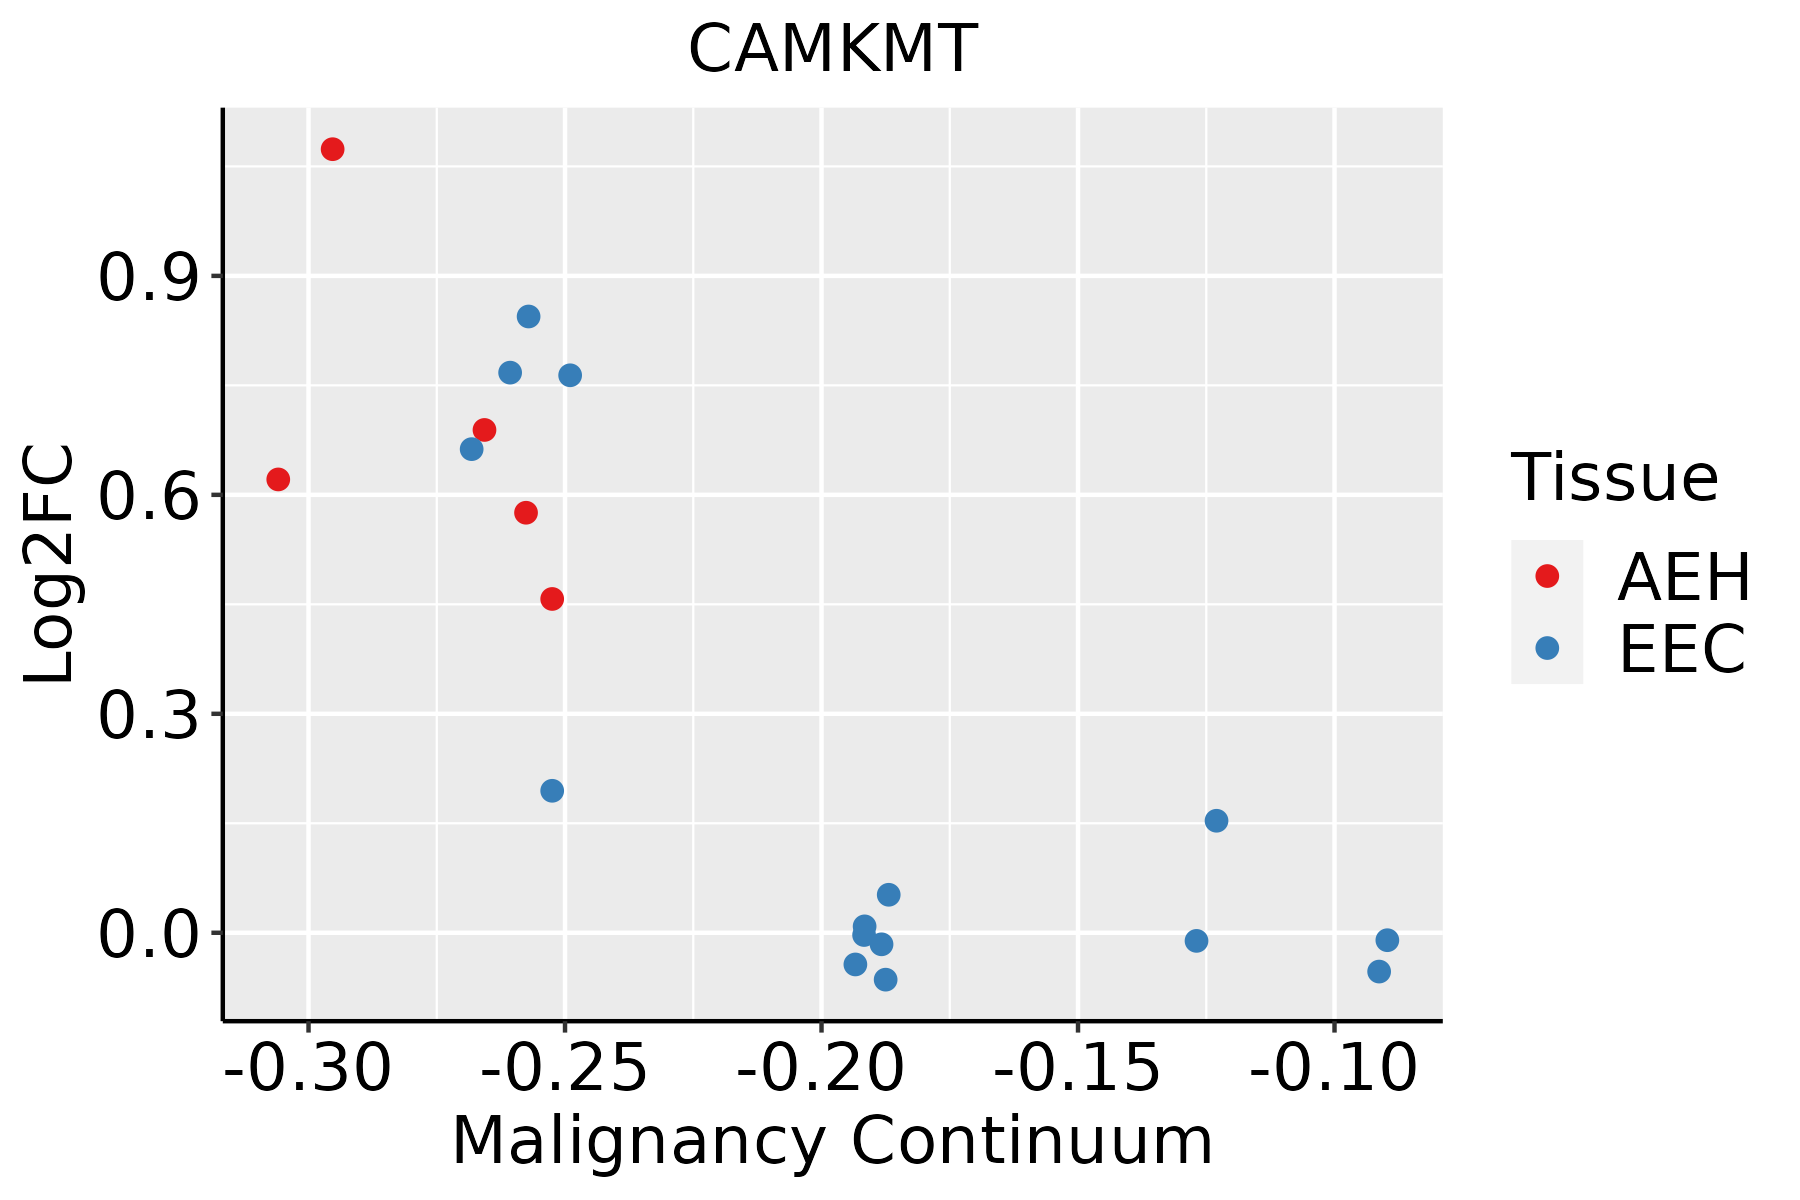 | AEH: Atypical endometrial hyperplasia |
| EEC: Endometrioid Cancer | ||
| Esophagus | 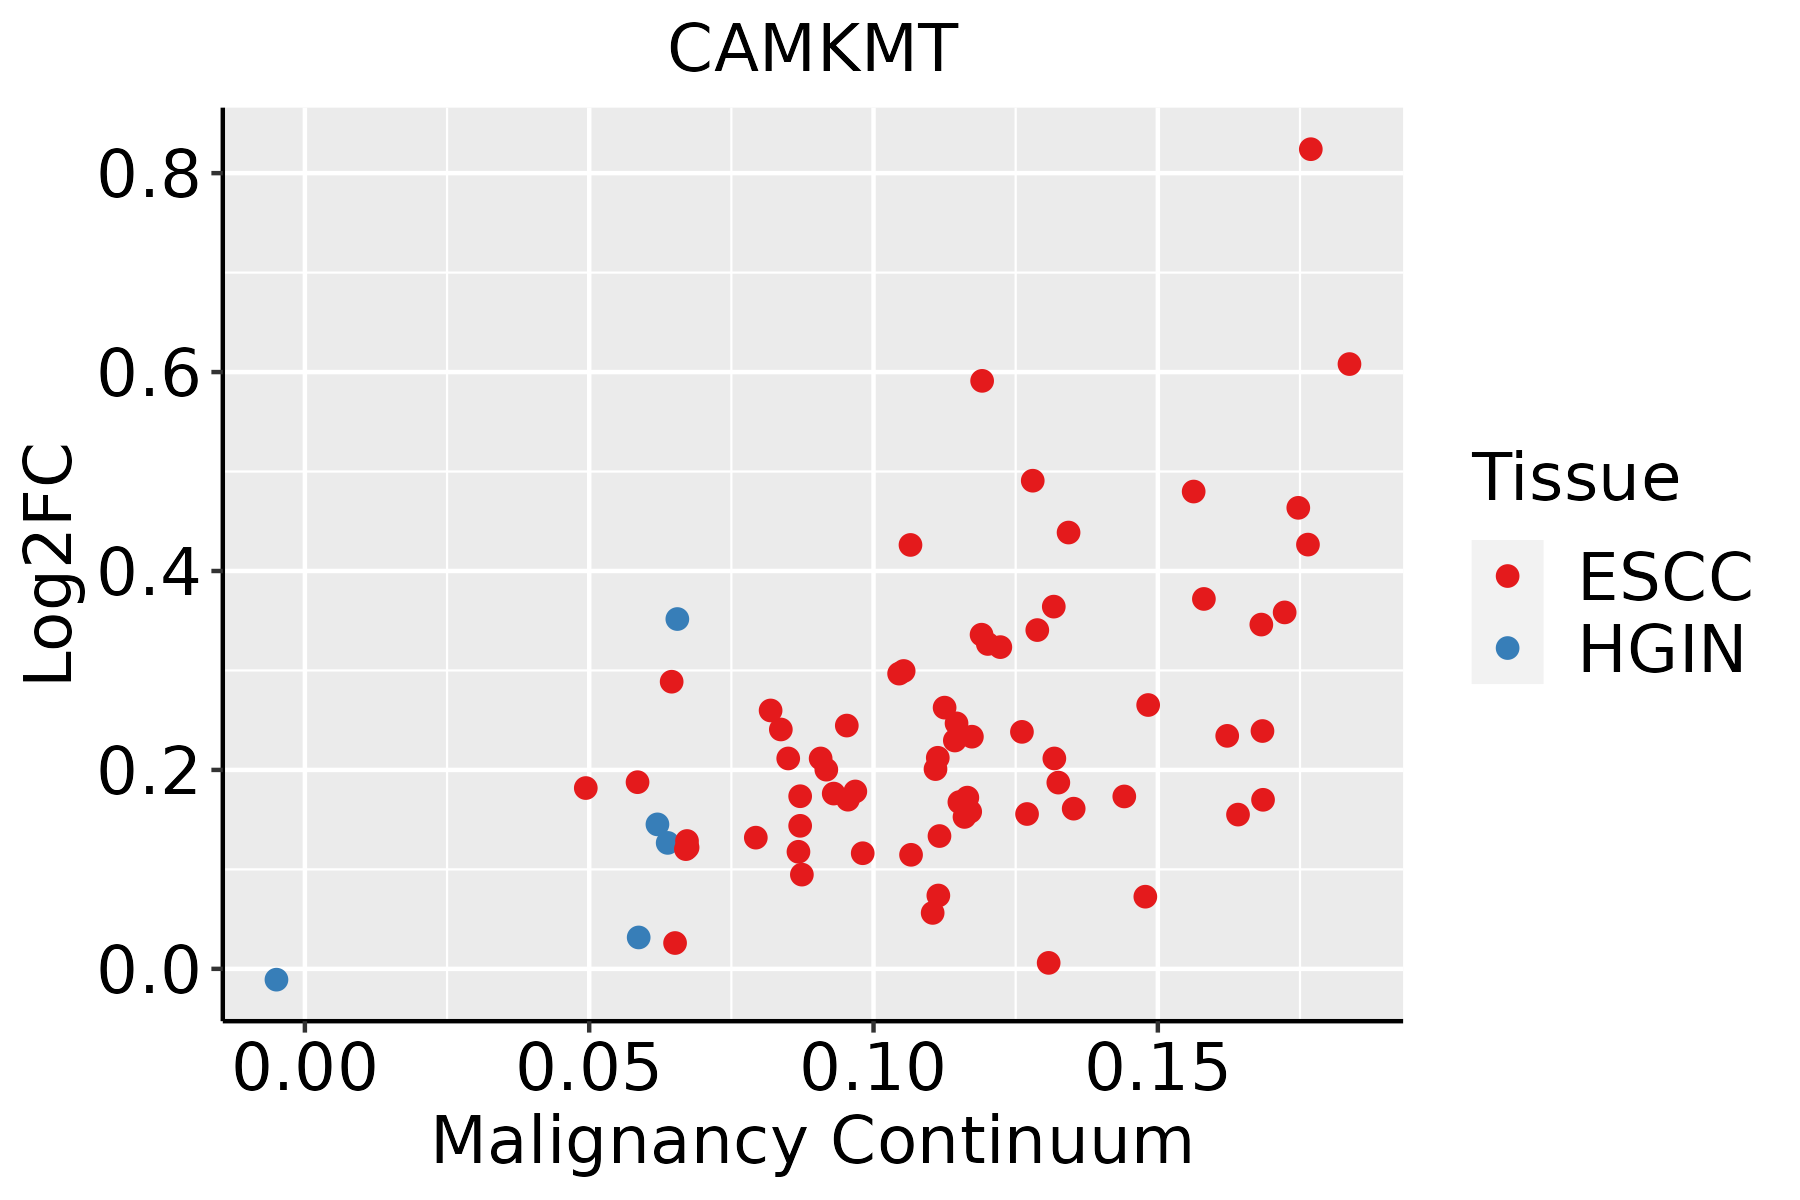 | ESCC: Esophageal squamous cell carcinoma |
| HGIN: High-grade intraepithelial neoplasias | ||
| LGIN: Low-grade intraepithelial neoplasias | ||
| Lung | 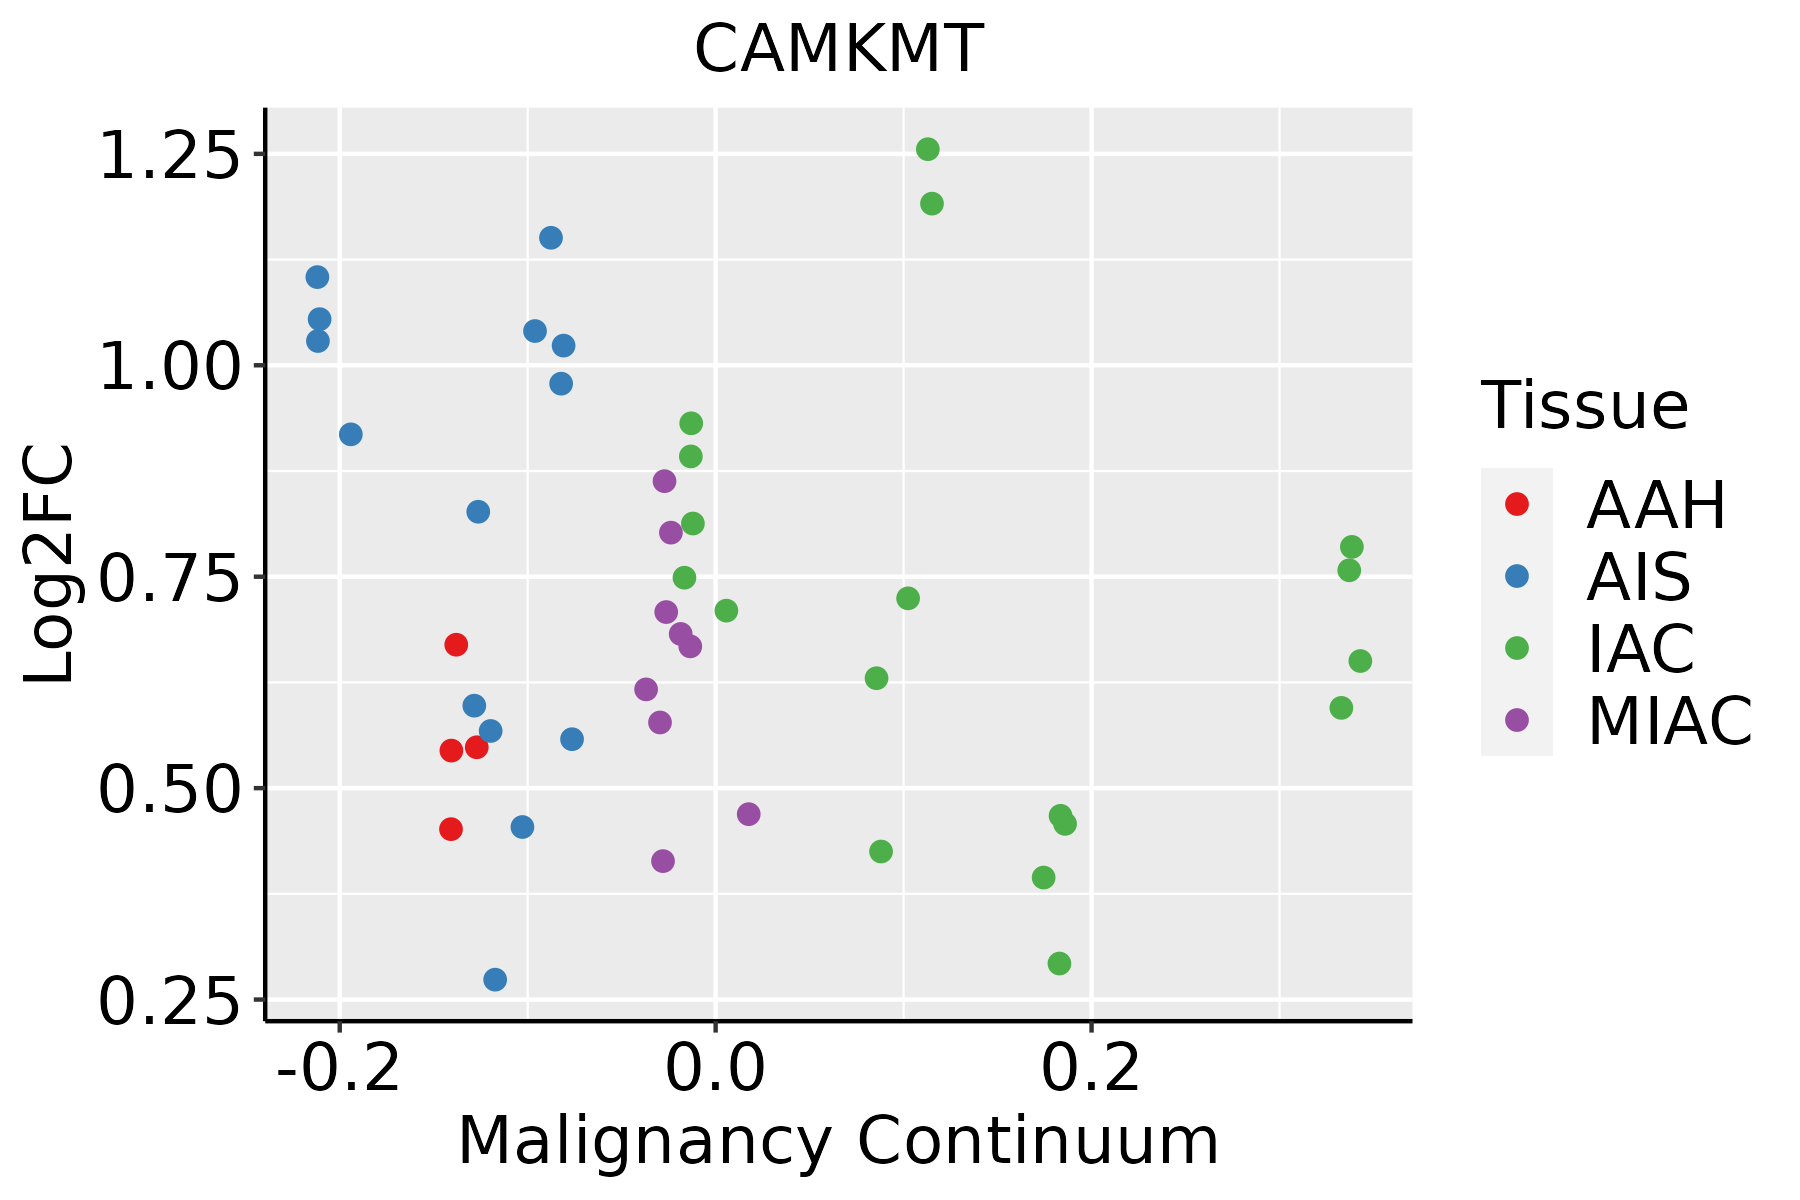 | AAH: Atypical adenomatous hyperplasia |
| AIS: Adenocarcinoma in situ | ||
| IAC: Invasive lung adenocarcinoma | ||
| MIA: Minimally invasive adenocarcinoma |
| ∗log2FC in expression of this searched gene in stem-like cells from each diseased tissue sample relative to stem-like cells in normal samples in each tissue plotted against the malignancy continuum. Samples are colored based on if they are from different disease stage. |
Top |
Malignant transformation related pathway analysis |
| Find out the enriched GO biological processes and KEGG pathways involved in transition from healthy to precancer to cancer |
| Tissue | Disease Stage | Enriched GO biological Processes |
| Colorectum | AD |  |
| Colorectum | SER |  |
| Colorectum | MSS |  |
| Colorectum | MSI-H |  |
| Colorectum | FAP |  |
| ∗Top 15 enriched GO BP terms are showed in the bar plot of each disease state in each tissue. Each row represents a significant GO biological process which is colored according to the -log10(p.adjust). |
| Page: 1 2 3 4 5 6 7 8 9 |
| GO ID | Tissue | Disease Stage | Description | Gene Ratio | Bg Ratio | pvalue | p.adjust | Count |
| GO:00712148 | Cervix | CC | cellular response to abiotic stimulus | 69/2311 | 331/18723 | 7.36e-06 | 1.73e-04 | 69 |
| GO:01040048 | Cervix | CC | cellular response to environmental stimulus | 69/2311 | 331/18723 | 7.36e-06 | 1.73e-04 | 69 |
| GO:00093149 | Cervix | CC | response to radiation | 86/2311 | 456/18723 | 3.50e-05 | 5.63e-04 | 86 |
| GO:00714786 | Cervix | CC | cellular response to radiation | 41/2311 | 186/18723 | 1.41e-04 | 1.71e-03 | 41 |
| GO:00180224 | Cervix | CC | peptidyl-lysine methylation | 28/2311 | 131/18723 | 2.43e-03 | 1.71e-02 | 28 |
| GO:00064795 | Cervix | CC | protein methylation | 36/2311 | 181/18723 | 2.46e-03 | 1.71e-02 | 36 |
| GO:00082135 | Cervix | CC | protein alkylation | 36/2311 | 181/18723 | 2.46e-03 | 1.71e-02 | 36 |
| GO:00094163 | Cervix | CC | response to light stimulus | 54/2311 | 320/18723 | 1.03e-02 | 4.97e-02 | 54 |
| GO:00182054 | Cervix | CC | peptidyl-lysine modification | 62/2311 | 376/18723 | 1.04e-02 | 4.97e-02 | 62 |
| GO:0006479 | Colorectum | FAP | protein methylation | 39/2622 | 181/18723 | 3.60e-03 | 2.58e-02 | 39 |
| GO:0008213 | Colorectum | FAP | protein alkylation | 39/2622 | 181/18723 | 3.60e-03 | 2.58e-02 | 39 |
| GO:0071214 | Colorectum | FAP | cellular response to abiotic stimulus | 63/2622 | 331/18723 | 6.38e-03 | 3.99e-02 | 63 |
| GO:0104004 | Colorectum | FAP | cellular response to environmental stimulus | 63/2622 | 331/18723 | 6.38e-03 | 3.99e-02 | 63 |
| GO:00712149 | Endometrium | AEH | cellular response to abiotic stimulus | 55/2100 | 331/18723 | 1.85e-03 | 1.46e-02 | 55 |
| GO:01040049 | Endometrium | AEH | cellular response to environmental stimulus | 55/2100 | 331/18723 | 1.85e-03 | 1.46e-02 | 55 |
| GO:000931410 | Endometrium | AEH | response to radiation | 70/2100 | 456/18723 | 3.99e-03 | 2.68e-02 | 70 |
| GO:007121414 | Endometrium | EEC | cellular response to abiotic stimulus | 58/2168 | 331/18723 | 8.25e-04 | 7.64e-03 | 58 |
| GO:010400414 | Endometrium | EEC | cellular response to environmental stimulus | 58/2168 | 331/18723 | 8.25e-04 | 7.64e-03 | 58 |
| GO:000931413 | Endometrium | EEC | response to radiation | 71/2168 | 456/18723 | 5.69e-03 | 3.42e-02 | 71 |
| GO:001820514 | Esophagus | ESCC | peptidyl-lysine modification | 259/8552 | 376/18723 | 3.90e-20 | 5.26e-18 | 259 |
| Page: 1 2 3 |
| Pathway ID | Tissue | Disease Stage | Description | Gene Ratio | Bg Ratio | pvalue | p.adjust | qvalue | Count |
| hsa00310 | Colorectum | AD | Lysine degradation | 27/2092 | 63/8465 | 1.17e-03 | 7.75e-03 | 4.94e-03 | 27 |
| hsa003101 | Colorectum | AD | Lysine degradation | 27/2092 | 63/8465 | 1.17e-03 | 7.75e-03 | 4.94e-03 | 27 |
| hsa003102 | Colorectum | MSS | Lysine degradation | 24/1875 | 63/8465 | 2.94e-03 | 1.39e-02 | 8.50e-03 | 24 |
| hsa003103 | Colorectum | MSS | Lysine degradation | 24/1875 | 63/8465 | 2.94e-03 | 1.39e-02 | 8.50e-03 | 24 |
| hsa003104 | Colorectum | FAP | Lysine degradation | 23/1404 | 63/8465 | 1.04e-04 | 9.46e-04 | 5.76e-04 | 23 |
| hsa003105 | Colorectum | FAP | Lysine degradation | 23/1404 | 63/8465 | 1.04e-04 | 9.46e-04 | 5.76e-04 | 23 |
| hsa003106 | Colorectum | CRC | Lysine degradation | 18/1091 | 63/8465 | 7.21e-04 | 6.34e-03 | 4.30e-03 | 18 |
| hsa003107 | Colorectum | CRC | Lysine degradation | 18/1091 | 63/8465 | 7.21e-04 | 6.34e-03 | 4.30e-03 | 18 |
| hsa0031010 | Esophagus | ESCC | Lysine degradation | 41/4205 | 63/8465 | 9.63e-03 | 2.27e-02 | 1.16e-02 | 41 |
| hsa0031013 | Esophagus | ESCC | Lysine degradation | 41/4205 | 63/8465 | 9.63e-03 | 2.27e-02 | 1.16e-02 | 41 |
| hsa003109 | Lung | IAC | Lysine degradation | 17/1053 | 63/8465 | 1.35e-03 | 8.63e-03 | 5.73e-03 | 17 |
| hsa0031012 | Lung | IAC | Lysine degradation | 17/1053 | 63/8465 | 1.35e-03 | 8.63e-03 | 5.73e-03 | 17 |
| hsa0031022 | Lung | AIS | Lysine degradation | 16/961 | 63/8465 | 1.41e-03 | 9.49e-03 | 6.07e-03 | 16 |
| hsa0031032 | Lung | AIS | Lysine degradation | 16/961 | 63/8465 | 1.41e-03 | 9.49e-03 | 6.07e-03 | 16 |
| hsa0031042 | Lung | MIAC | Lysine degradation | 10/507 | 63/8465 | 3.93e-03 | 3.18e-02 | 2.30e-02 | 10 |
| hsa0031052 | Lung | MIAC | Lysine degradation | 10/507 | 63/8465 | 3.93e-03 | 3.18e-02 | 2.30e-02 | 10 |
| Page: 1 |
Top |
Cell-cell communication analysis |
| Identification of potential cell-cell interactions between two cell types and their ligand-receptor pairs for different disease states |
| Ligand | Receptor | LRpair | Pathway | Tissue | Disease Stage |
| Page: 1 |
Top |
Single-cell gene regulatory network inference analysis |
| Find out the significant the regulons (TFs) and the target genes of each regulon across cell types for different disease states |
| TF | Cell Type | Tissue | Disease Stage | Target Gene | RSS | Regulon Activity |
| ∗The dot plots of a searched regulon are shown for all cell subpopulations in each disease state of each tissue based on the regulon specific score inferred using pySCENIC and by calculating the average expression. |
| Page: 1 |
Top |
Somatic mutation of malignant transformation related genes |
| Annotation of somatic variants for genes involved in malignant transformation |
| Hugo Symbol | Variant Class | Variant Classification | dbSNP RS | HGVSc | HGVSp | HGVSp Short | SWISSPROT | BIOTYPE | SIFT | PolyPhen | Tumor Sample Barcode | Tissue | Histology | Sex | Age | Stage | Therapy Types | Drugs | Outcome |
| CAMKMT | SNV | Missense_Mutation | c.215N>T | p.Ser72Leu | p.S72L | Q7Z624 | protein_coding | deleterious(0.01) | benign(0.335) | TCGA-AC-A23H-01 | Breast | breast invasive carcinoma | Female | >=65 | I/II | Unknown | Unknown | PD | |
| CAMKMT | SNV | Missense_Mutation | c.770C>T | p.Ala257Val | p.A257V | Q7Z624 | protein_coding | tolerated(0.13) | probably_damaging(0.999) | TCGA-AR-A0U2-01 | Breast | breast invasive carcinoma | Female | <65 | III/IV | Hormone Therapy | tamoxiphen | PD | |
| CAMKMT | SNV | Missense_Mutation | c.509N>T | p.Asp170Val | p.D170V | Q7Z624 | protein_coding | deleterious(0) | possibly_damaging(0.864) | TCGA-AR-A251-01 | Breast | breast invasive carcinoma | Female | <65 | III/IV | Chemotherapy | doxorubicin | SD | |
| CAMKMT | SNV | Missense_Mutation | c.215C>T | p.Ser72Leu | p.S72L | Q7Z624 | protein_coding | deleterious(0.01) | benign(0.335) | TCGA-BH-A0H5-01 | Breast | breast invasive carcinoma | Female | <65 | I/II | Chemotherapy | cytoxan | CR | |
| CAMKMT | SNV | Missense_Mutation | c.472A>G | p.Thr158Ala | p.T158A | Q7Z624 | protein_coding | deleterious(0) | benign(0.027) | TCGA-BH-A18G-01 | Breast | breast invasive carcinoma | Female | >=65 | I/II | Unknown | Unknown | SD | |
| CAMKMT | SNV | Missense_Mutation | c.721N>T | p.Ala241Ser | p.A241S | Q7Z624 | protein_coding | tolerated(0.13) | possibly_damaging(0.67) | TCGA-C5-A7UE-01 | Cervix | cervical & endocervical cancer | Female | <65 | I/II | Chemotherapy | cisplatin | SD | |
| CAMKMT | SNV | Missense_Mutation | c.719N>A | p.Arg240Lys | p.R240K | Q7Z624 | protein_coding | deleterious(0.01) | probably_damaging(0.994) | TCGA-JX-A3Q0-01 | Cervix | cervical & endocervical cancer | Female | <65 | III/IV | Unknown | Unknown | SD | |
| CAMKMT | SNV | Missense_Mutation | rs201075899 | c.787N>T | p.Arg263Cys | p.R263C | Q7Z624 | protein_coding | tolerated(0.21) | possibly_damaging(0.761) | TCGA-AA-3672-01 | Colorectum | colon adenocarcinoma | Female | >=65 | III/IV | Unknown | Unknown | SD |
| CAMKMT | SNV | Missense_Mutation | rs759924384 | c.173G>A | p.Arg58Gln | p.R58Q | Q7Z624 | protein_coding | tolerated(0.62) | benign(0.013) | TCGA-AA-3984-01 | Colorectum | colon adenocarcinoma | Female | <65 | I/II | Unknown | Unknown | SD |
| CAMKMT | deletion | Frame_Shift_Del | novel | c.300delN | p.Ser100ArgfsTer4 | p.S100Rfs*4 | Q7Z624 | protein_coding | TCGA-AM-5820-01 | Colorectum | colon adenocarcinoma | Female | <65 | I/II | Unknown | Unknown | SD |
| Page: 1 2 3 4 |
Top |
Related drugs of malignant transformation related genes |
| Identification of chemicals and drugs interact with genes involved in malignant transfromation |
| (DGIdb 4.0) |
| Entrez ID | Symbol | Category | Interaction Types | Drug Claim Name | Drug Name | PMIDs |
| Page: 1 |

Copyright 2023-Present -The University of Texas Health Science Center at Houston |