
|
|||||
|
 | |
| |
| |
| |
| |
| |
|
Gene: CAMKK2 |
Gene summary for CAMKK2 |
| Gene information | Species | Human | Gene symbol | CAMKK2 | Gene ID | 10645 |
| Gene name | calcium/calmodulin dependent protein kinase kinase 2 | |
| Gene Alias | CAMKK | |
| Cytomap | 12q24.31 | |
| Gene Type | protein-coding | GO ID | GO:0000165 | UniProtAcc | A0A024RBQ0 |
Top |
Malignant transformation analysis |
| Identification of the aberrant gene expression in precancerous and cancerous lesions by comparing the gene expression of stem-like cells in diseased tissues with normal stem cells |
| Entrez ID | Symbol | Replicates | Species | Organ | Tissue | Adj P-value | Log2FC | Malignancy |
| 10645 | CAMKK2 | LZE7T | Human | Esophagus | ESCC | 2.89e-02 | 1.33e-01 | 0.0667 |
| 10645 | CAMKK2 | LZE8T | Human | Esophagus | ESCC | 1.24e-02 | 3.52e-02 | 0.067 |
| 10645 | CAMKK2 | LZE20T | Human | Esophagus | ESCC | 1.30e-03 | 4.51e-02 | 0.0662 |
| 10645 | CAMKK2 | LZE22T | Human | Esophagus | ESCC | 1.63e-05 | 2.45e-01 | 0.068 |
| 10645 | CAMKK2 | LZE24T | Human | Esophagus | ESCC | 4.97e-06 | 8.70e-02 | 0.0596 |
| 10645 | CAMKK2 | LZE21T | Human | Esophagus | ESCC | 1.11e-04 | 1.44e-01 | 0.0655 |
| 10645 | CAMKK2 | P1T-E | Human | Esophagus | ESCC | 2.50e-06 | 1.78e-01 | 0.0875 |
| 10645 | CAMKK2 | P2T-E | Human | Esophagus | ESCC | 4.90e-39 | 7.27e-01 | 0.1177 |
| 10645 | CAMKK2 | P4T-E | Human | Esophagus | ESCC | 6.37e-15 | 2.10e-01 | 0.1323 |
| 10645 | CAMKK2 | P5T-E | Human | Esophagus | ESCC | 9.27e-10 | 1.87e-01 | 0.1327 |
| 10645 | CAMKK2 | P8T-E | Human | Esophagus | ESCC | 1.31e-14 | 1.98e-01 | 0.0889 |
| 10645 | CAMKK2 | P9T-E | Human | Esophagus | ESCC | 1.43e-19 | 2.52e-01 | 0.1131 |
| 10645 | CAMKK2 | P10T-E | Human | Esophagus | ESCC | 3.22e-09 | 9.84e-02 | 0.116 |
| 10645 | CAMKK2 | P11T-E | Human | Esophagus | ESCC | 1.00e-17 | 4.15e-01 | 0.1426 |
| 10645 | CAMKK2 | P12T-E | Human | Esophagus | ESCC | 1.18e-12 | 1.89e-01 | 0.1122 |
| 10645 | CAMKK2 | P15T-E | Human | Esophagus | ESCC | 2.32e-20 | 1.84e-01 | 0.1149 |
| 10645 | CAMKK2 | P16T-E | Human | Esophagus | ESCC | 6.03e-15 | 1.24e-01 | 0.1153 |
| 10645 | CAMKK2 | P17T-E | Human | Esophagus | ESCC | 4.51e-08 | 1.44e-01 | 0.1278 |
| 10645 | CAMKK2 | P19T-E | Human | Esophagus | ESCC | 1.60e-02 | 4.83e-01 | 0.1662 |
| 10645 | CAMKK2 | P20T-E | Human | Esophagus | ESCC | 4.03e-23 | 3.49e-01 | 0.1124 |
| Page: 1 2 3 4 5 |
| Tissue | Expression Dynamics | Abbreviation |
| Esophagus | 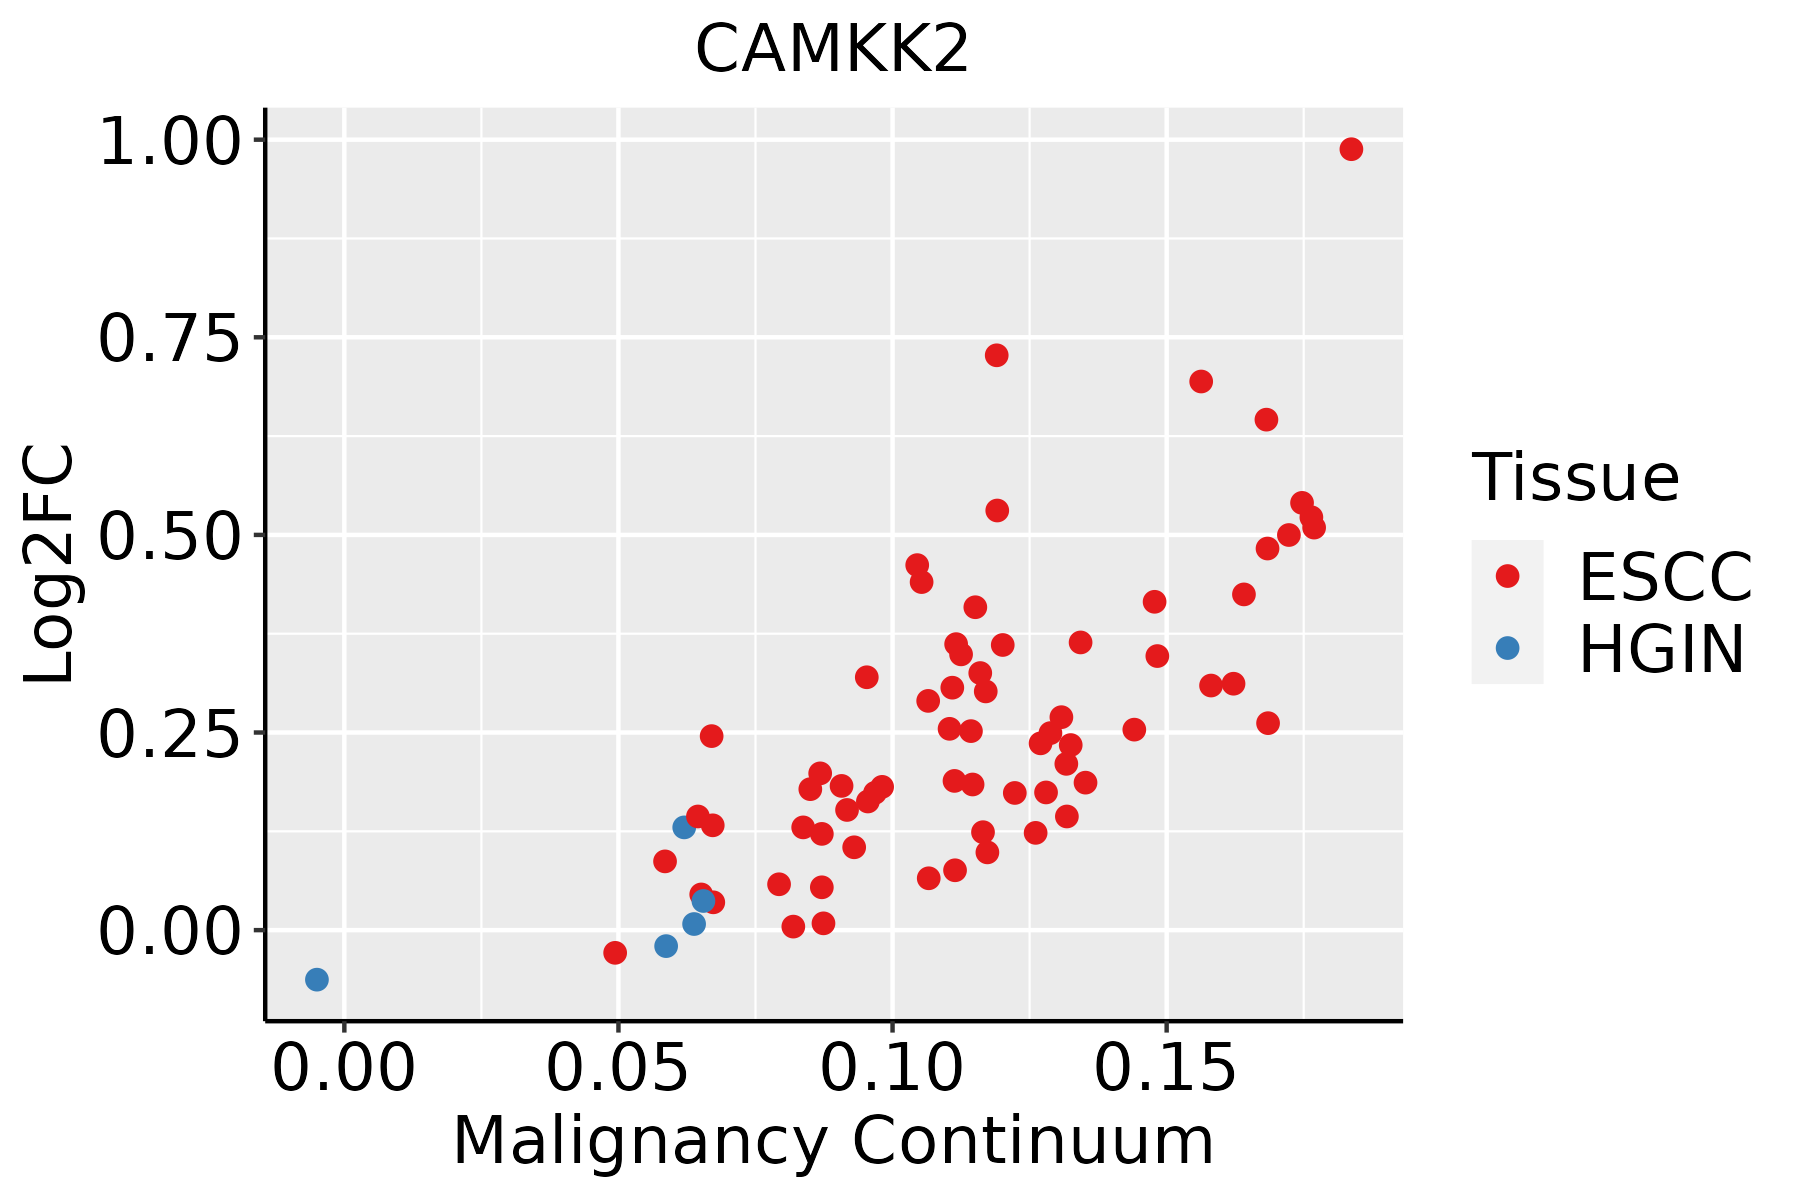 | ESCC: Esophageal squamous cell carcinoma |
| HGIN: High-grade intraepithelial neoplasias | ||
| LGIN: Low-grade intraepithelial neoplasias | ||
| Liver | 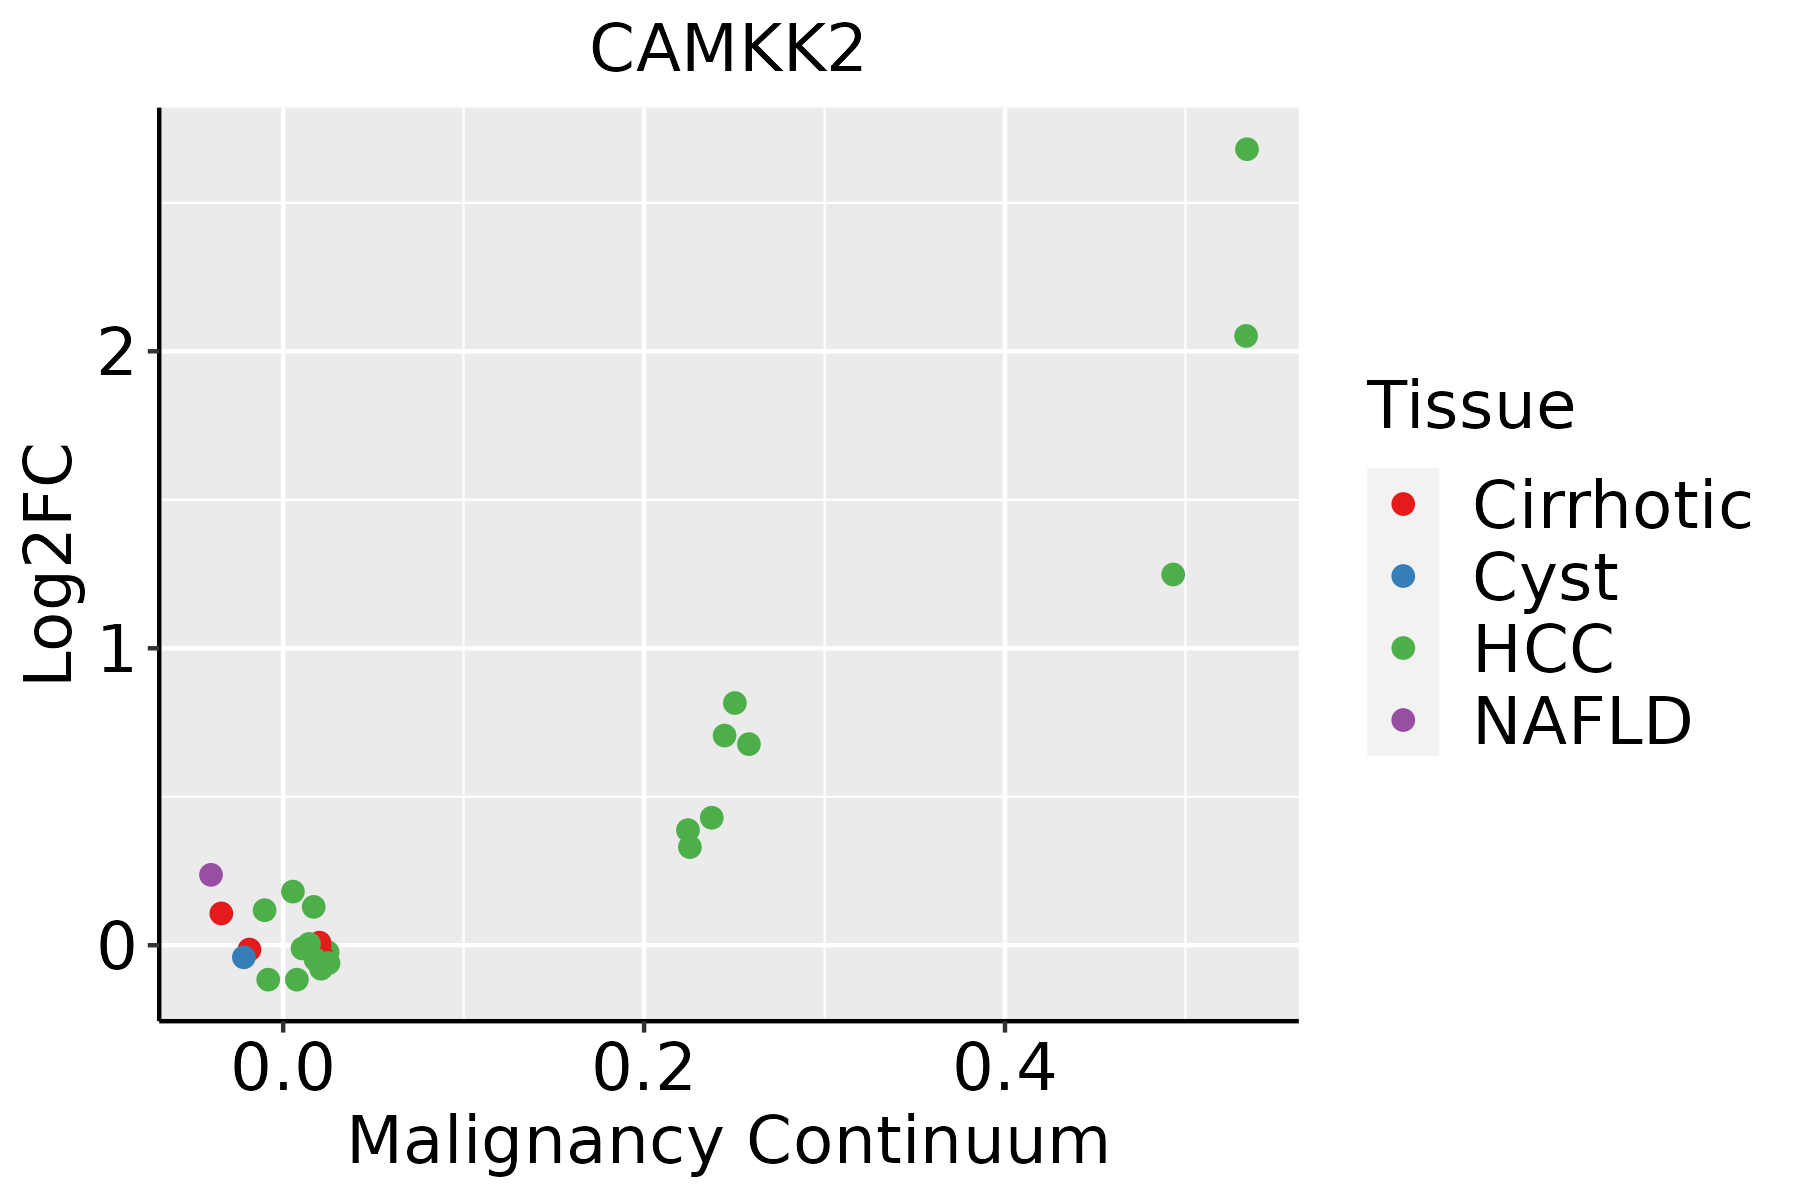 | HCC: Hepatocellular carcinoma |
| NAFLD: Non-alcoholic fatty liver disease | ||
| Oral Cavity |  | EOLP: Erosive Oral lichen planus |
| LP: leukoplakia | ||
| NEOLP: Non-erosive oral lichen planus | ||
| OSCC: Oral squamous cell carcinoma | ||
| Prostate | 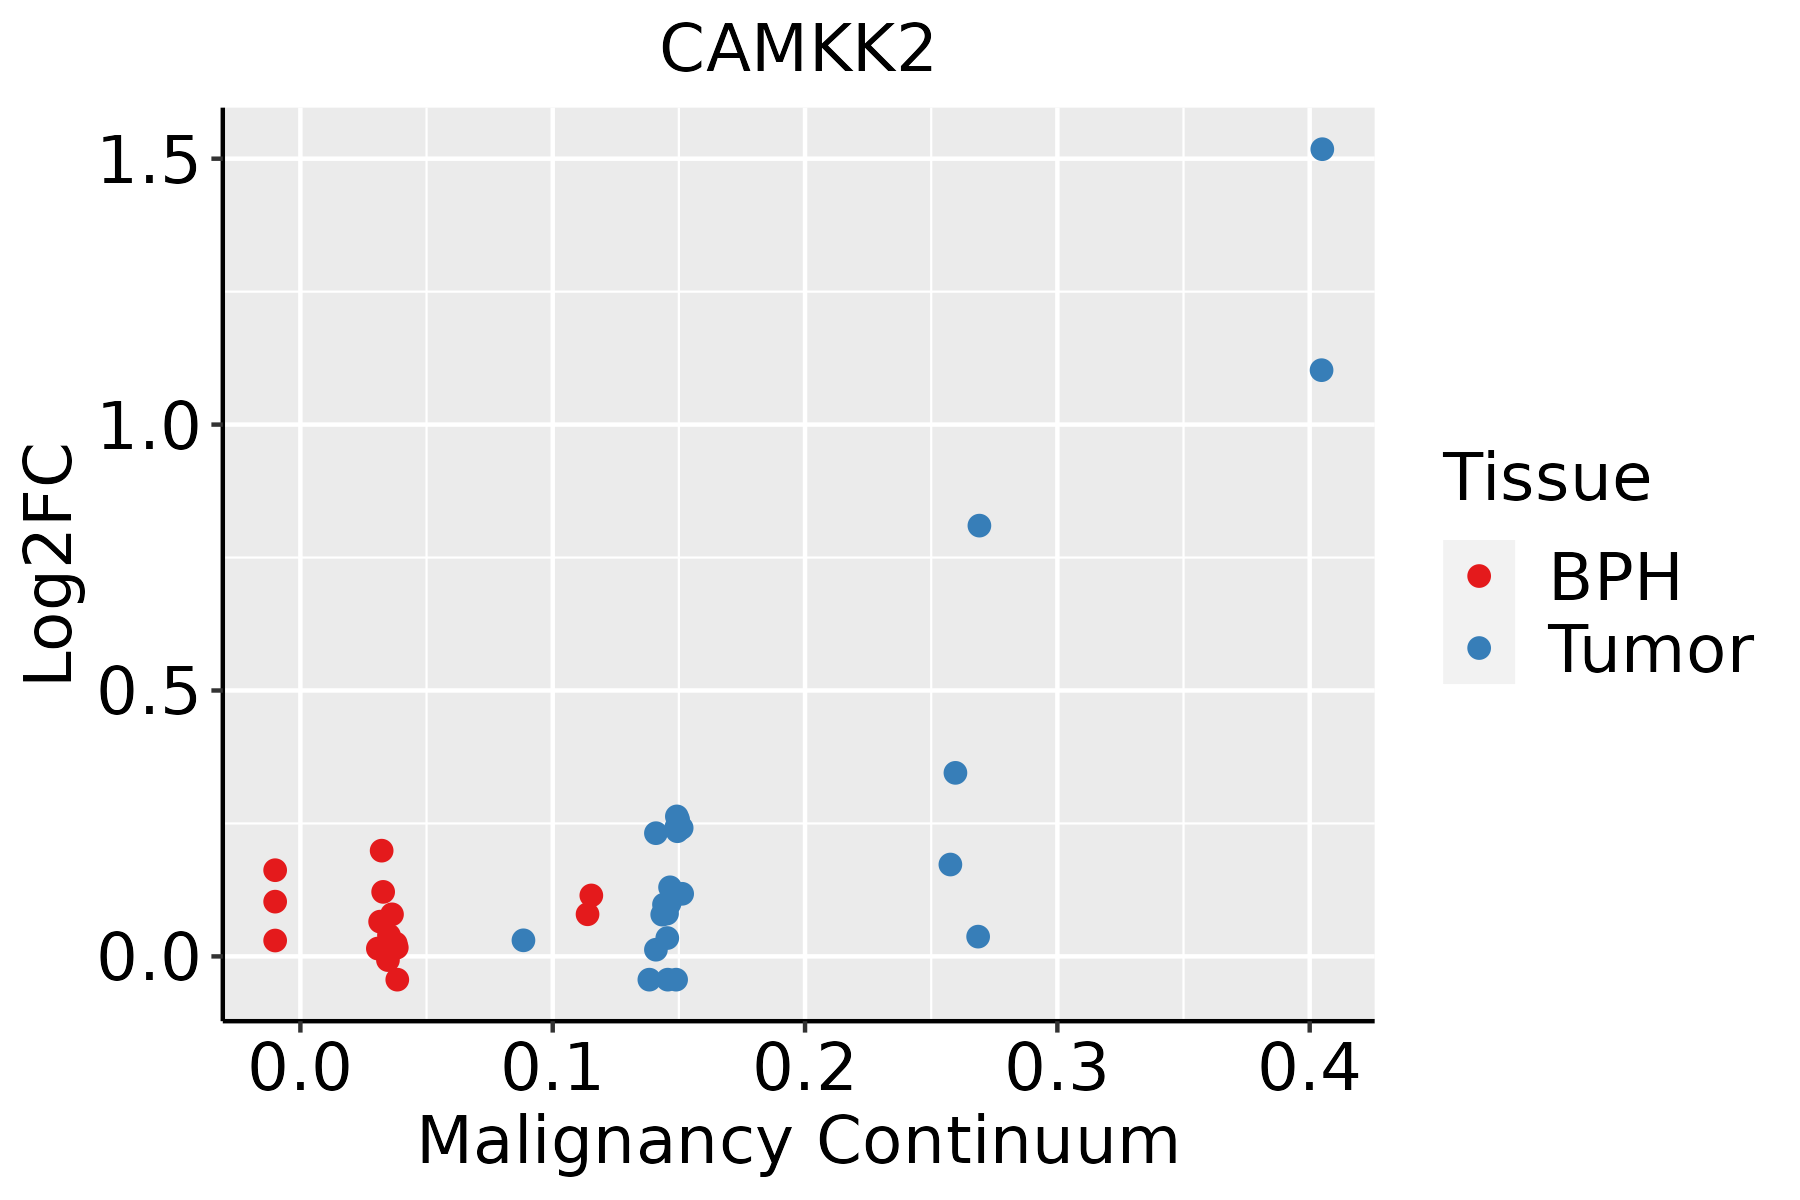 | BPH: Benign Prostatic Hyperplasia |
| ∗log2FC in expression of this searched gene in stem-like cells from each diseased tissue sample relative to stem-like cells in normal samples in each tissue plotted against the malignancy continuum. Samples are colored based on if they are from different disease stage. |
Top |
Malignant transformation related pathway analysis |
| Find out the enriched GO biological processes and KEGG pathways involved in transition from healthy to precancer to cancer |
| Tissue | Disease Stage | Enriched GO biological Processes |
| Colorectum | AD |  |
| Colorectum | SER |  |
| Colorectum | MSS |  |
| Colorectum | MSI-H |  |
| Colorectum | FAP |  |
| ∗Top 15 enriched GO BP terms are showed in the bar plot of each disease state in each tissue. Each row represents a significant GO biological process which is colored according to the -log10(p.adjust). |
| Page: 1 2 3 4 5 6 7 8 9 |
| GO ID | Tissue | Disease Stage | Description | Gene Ratio | Bg Ratio | pvalue | p.adjust | Count |
| GO:0022411111 | Esophagus | ESCC | cellular component disassembly | 305/8552 | 443/18723 | 1.94e-23 | 4.57e-21 | 305 |
| GO:0009896111 | Esophagus | ESCC | positive regulation of catabolic process | 332/8552 | 492/18723 | 4.36e-23 | 9.22e-21 | 332 |
| GO:0006979111 | Esophagus | ESCC | response to oxidative stress | 303/8552 | 446/18723 | 7.15e-22 | 1.30e-19 | 303 |
| GO:0031331111 | Esophagus | ESCC | positive regulation of cellular catabolic process | 292/8552 | 427/18723 | 8.67e-22 | 1.53e-19 | 292 |
| GO:0062197111 | Esophagus | ESCC | cellular response to chemical stress | 234/8552 | 337/18723 | 5.37e-19 | 5.97e-17 | 234 |
| GO:001050617 | Esophagus | ESCC | regulation of autophagy | 220/8552 | 317/18723 | 6.72e-18 | 6.36e-16 | 220 |
| GO:0034599111 | Esophagus | ESCC | cellular response to oxidative stress | 197/8552 | 288/18723 | 3.76e-15 | 2.15e-13 | 197 |
| GO:190300816 | Esophagus | ESCC | organelle disassembly | 89/8552 | 114/18723 | 1.36e-12 | 5.80e-11 | 89 |
| GO:0010821110 | Esophagus | ESCC | regulation of mitochondrion organization | 107/8552 | 144/18723 | 2.31e-12 | 9.41e-11 | 107 |
| GO:0000302111 | Esophagus | ESCC | response to reactive oxygen species | 150/8552 | 222/18723 | 3.06e-11 | 1.02e-09 | 150 |
| GO:000042217 | Esophagus | ESCC | autophagy of mitochondrion | 63/8552 | 81/18723 | 3.41e-09 | 7.24e-08 | 63 |
| GO:006172617 | Esophagus | ESCC | mitochondrion disassembly | 63/8552 | 81/18723 | 3.41e-09 | 7.24e-08 | 63 |
| GO:001082215 | Esophagus | ESCC | positive regulation of mitochondrion organization | 58/8552 | 74/18723 | 8.55e-09 | 1.73e-07 | 58 |
| GO:003461420 | Esophagus | ESCC | cellular response to reactive oxygen species | 103/8552 | 155/18723 | 1.34e-07 | 2.17e-06 | 103 |
| GO:004677710 | Esophagus | ESCC | protein autophosphorylation | 138/8552 | 227/18723 | 2.98e-06 | 3.38e-05 | 138 |
| GO:001050816 | Esophagus | ESCC | positive regulation of autophagy | 81/8552 | 124/18723 | 7.74e-06 | 7.65e-05 | 81 |
| GO:190314610 | Esophagus | ESCC | regulation of autophagy of mitochondrion | 27/8552 | 33/18723 | 2.20e-05 | 1.89e-04 | 27 |
| GO:00182124 | Esophagus | ESCC | peptidyl-tyrosine modification | 202/8552 | 378/18723 | 1.34e-03 | 6.39e-03 | 202 |
| GO:00181084 | Esophagus | ESCC | peptidyl-tyrosine phosphorylation | 200/8552 | 375/18723 | 1.60e-03 | 7.45e-03 | 200 |
| GO:19035999 | Esophagus | ESCC | positive regulation of autophagy of mitochondrion | 10/8552 | 12/18723 | 8.94e-03 | 3.12e-02 | 10 |
| Page: 1 2 3 4 5 |
| Pathway ID | Tissue | Disease Stage | Description | Gene Ratio | Bg Ratio | pvalue | p.adjust | qvalue | Count |
| hsa0414010 | Esophagus | ESCC | Autophagy - animal | 101/4205 | 141/8465 | 7.60e-08 | 6.21e-07 | 3.18e-07 | 101 |
| hsa0415210 | Esophagus | ESCC | AMPK signaling pathway | 80/4205 | 121/8465 | 1.73e-04 | 6.67e-04 | 3.42e-04 | 80 |
| hsa0421114 | Esophagus | ESCC | Longevity regulating pathway | 58/4205 | 89/8465 | 2.19e-03 | 6.16e-03 | 3.16e-03 | 58 |
| hsa0414015 | Esophagus | ESCC | Autophagy - animal | 101/4205 | 141/8465 | 7.60e-08 | 6.21e-07 | 3.18e-07 | 101 |
| hsa0415213 | Esophagus | ESCC | AMPK signaling pathway | 80/4205 | 121/8465 | 1.73e-04 | 6.67e-04 | 3.42e-04 | 80 |
| hsa0421115 | Esophagus | ESCC | Longevity regulating pathway | 58/4205 | 89/8465 | 2.19e-03 | 6.16e-03 | 3.16e-03 | 58 |
| hsa041406 | Liver | Cirrhotic | Autophagy - animal | 65/2530 | 141/8465 | 3.10e-05 | 2.47e-04 | 1.52e-04 | 65 |
| hsa04936 | Liver | Cirrhotic | Alcoholic liver disease | 60/2530 | 142/8465 | 1.07e-03 | 5.85e-03 | 3.61e-03 | 60 |
| hsa0415221 | Liver | Cirrhotic | AMPK signaling pathway | 49/2530 | 121/8465 | 7.90e-03 | 2.74e-02 | 1.69e-02 | 49 |
| hsa042118 | Liver | Cirrhotic | Longevity regulating pathway | 37/2530 | 89/8465 | 1.22e-02 | 3.89e-02 | 2.40e-02 | 37 |
| hsa0414011 | Liver | Cirrhotic | Autophagy - animal | 65/2530 | 141/8465 | 3.10e-05 | 2.47e-04 | 1.52e-04 | 65 |
| hsa049361 | Liver | Cirrhotic | Alcoholic liver disease | 60/2530 | 142/8465 | 1.07e-03 | 5.85e-03 | 3.61e-03 | 60 |
| hsa0415231 | Liver | Cirrhotic | AMPK signaling pathway | 49/2530 | 121/8465 | 7.90e-03 | 2.74e-02 | 1.69e-02 | 49 |
| hsa0421111 | Liver | Cirrhotic | Longevity regulating pathway | 37/2530 | 89/8465 | 1.22e-02 | 3.89e-02 | 2.40e-02 | 37 |
| hsa0414021 | Liver | HCC | Autophagy - animal | 99/4020 | 141/8465 | 3.08e-08 | 4.70e-07 | 2.61e-07 | 99 |
| hsa0421121 | Liver | HCC | Longevity regulating pathway | 61/4020 | 89/8465 | 4.46e-05 | 2.37e-04 | 1.32e-04 | 61 |
| hsa049362 | Liver | HCC | Alcoholic liver disease | 89/4020 | 142/8465 | 1.73e-04 | 8.53e-04 | 4.75e-04 | 89 |
| hsa0415241 | Liver | HCC | AMPK signaling pathway | 77/4020 | 121/8465 | 2.32e-04 | 1.11e-03 | 6.18e-04 | 77 |
| hsa049202 | Liver | HCC | Adipocytokine signaling pathway | 45/4020 | 69/8465 | 2.19e-03 | 7.55e-03 | 4.20e-03 | 45 |
| hsa0414031 | Liver | HCC | Autophagy - animal | 99/4020 | 141/8465 | 3.08e-08 | 4.70e-07 | 2.61e-07 | 99 |
| Page: 1 2 |
Top |
Cell-cell communication analysis |
| Identification of potential cell-cell interactions between two cell types and their ligand-receptor pairs for different disease states |
| Ligand | Receptor | LRpair | Pathway | Tissue | Disease Stage |
| Page: 1 |
Top |
Single-cell gene regulatory network inference analysis |
| Find out the significant the regulons (TFs) and the target genes of each regulon across cell types for different disease states |
| TF | Cell Type | Tissue | Disease Stage | Target Gene | RSS | Regulon Activity |
| ∗The dot plots of a searched regulon are shown for all cell subpopulations in each disease state of each tissue based on the regulon specific score inferred using pySCENIC and by calculating the average expression. |
| Page: 1 |
Top |
Somatic mutation of malignant transformation related genes |
| Annotation of somatic variants for genes involved in malignant transformation |
| Hugo Symbol | Variant Class | Variant Classification | dbSNP RS | HGVSc | HGVSp | HGVSp Short | SWISSPROT | BIOTYPE | SIFT | PolyPhen | Tumor Sample Barcode | Tissue | Histology | Sex | Age | Stage | Therapy Types | Drugs | Outcome |
| CAMKK2 | SNV | Missense_Mutation | c.854N>T | p.Ser285Phe | p.S285F | Q96RR4 | protein_coding | deleterious(0) | possibly_damaging(0.866) | TCGA-AC-A23H-01 | Breast | breast invasive carcinoma | Female | >=65 | I/II | Unknown | Unknown | PD | |
| CAMKK2 | SNV | Missense_Mutation | rs200801054 | c.289N>T | p.Arg97Cys | p.R97C | Q96RR4 | protein_coding | deleterious_low_confidence(0.01) | possibly_damaging(0.889) | TCGA-BH-A18I-01 | Breast | breast invasive carcinoma | Female | <65 | I/II | Chemotherapy | taxotere | CR |
| CAMKK2 | SNV | Missense_Mutation | c.859N>A | p.Asp287Asn | p.D287N | Q96RR4 | protein_coding | tolerated(0.1) | benign(0.374) | TCGA-EW-A1J5-01 | Breast | breast invasive carcinoma | Female | <65 | I/II | Chemotherapy | adriamycin | SD | |
| CAMKK2 | SNV | Missense_Mutation | c.17N>G | p.Ser6Cys | p.S6C | Q96RR4 | protein_coding | deleterious_low_confidence(0) | possibly_damaging(0.533) | TCGA-FU-A5XV-01 | Cervix | cervical & endocervical cancer | Female | <65 | III/IV | Unknown | Unknown | SD | |
| CAMKK2 | SNV | Missense_Mutation | c.55N>A | p.Glu19Lys | p.E19K | Q96RR4 | protein_coding | deleterious_low_confidence(0.01) | benign(0.022) | TCGA-IR-A3LA-01 | Cervix | cervical & endocervical cancer | Female | <65 | I/II | Chemotherapy | cisplatin | CR | |
| CAMKK2 | SNV | Missense_Mutation | c.1520N>G | p.Glu507Gly | p.E507G | Q96RR4 | protein_coding | tolerated(0.08) | benign(0.006) | TCGA-IR-A3LH-01 | Cervix | cervical & endocervical cancer | Female | <65 | I/II | Chemotherapy | cisplatin | CR | |
| CAMKK2 | SNV | Missense_Mutation | novel | c.1371N>T | p.Glu457Asp | p.E457D | Q96RR4 | protein_coding | deleterious(0) | possibly_damaging(0.871) | TCGA-AA-3950-01 | Colorectum | colon adenocarcinoma | Female | >=65 | I/II | Unknown | Unknown | SD |
| CAMKK2 | SNV | Missense_Mutation | c.1474N>T | p.Arg492Cys | p.R492C | Q96RR4 | protein_coding | deleterious(0) | possibly_damaging(0.701) | TCGA-AA-A022-01 | Colorectum | colon adenocarcinoma | Female | >=65 | I/II | Unknown | Unknown | SD | |
| CAMKK2 | SNV | Missense_Mutation | c.802N>A | p.Glu268Lys | p.E268K | Q96RR4 | protein_coding | deleterious(0) | probably_damaging(0.958) | TCGA-AZ-4315-01 | Colorectum | colon adenocarcinoma | Male | <65 | I/II | Unknown | Unknown | SD | |
| CAMKK2 | SNV | Missense_Mutation | c.1746G>T | p.Glu582Asp | p.E582D | Q96RR4 | protein_coding | tolerated_low_confidence(0.58) | benign(0) | TCGA-CM-6674-01 | Colorectum | colon adenocarcinoma | Male | <65 | I/II | Unknown | Unknown | SD |
| Page: 1 2 3 4 5 |
Top |
Related drugs of malignant transformation related genes |
| Identification of chemicals and drugs interact with genes involved in malignant transfromation |
| (DGIdb 4.0) |
| Entrez ID | Symbol | Category | Interaction Types | Drug Claim Name | Drug Name | PMIDs |
| 10645 | CAMKK2 | KINASE, DRUGGABLE GENOME, ENZYME, TYROSINE KINASE, SERINE THREONINE KINASE | PF-562271 | PF-00562271 | ||
| 10645 | CAMKK2 | KINASE, DRUGGABLE GENOME, ENZYME, TYROSINE KINASE, SERINE THREONINE KINASE | inhibitor | 178101957 | ||
| 10645 | CAMKK2 | KINASE, DRUGGABLE GENOME, ENZYME, TYROSINE KINASE, SERINE THREONINE KINASE | US9623028, Compound 101 | |||
| 10645 | CAMKK2 | KINASE, DRUGGABLE GENOME, ENZYME, TYROSINE KINASE, SERINE THREONINE KINASE | CQ7 | |||
| 10645 | CAMKK2 | KINASE, DRUGGABLE GENOME, ENZYME, TYROSINE KINASE, SERINE THREONINE KINASE | JNJ-7706621 | JNJ-7706621 | ||
| 10645 | CAMKK2 | KINASE, DRUGGABLE GENOME, ENZYME, TYROSINE KINASE, SERINE THREONINE KINASE | DOVITINIB | DOVITINIB | ||
| 10645 | CAMKK2 | KINASE, DRUGGABLE GENOME, ENZYME, TYROSINE KINASE, SERINE THREONINE KINASE | US9623028, Compound 79 | |||
| 10645 | CAMKK2 | KINASE, DRUGGABLE GENOME, ENZYME, TYROSINE KINASE, SERINE THREONINE KINASE | AST-487 | AST-487 |
| Page: 1 |

Copyright 2023-Present -The University of Texas Health Science Center at Houston |