Schematic overview of the cellular and molecular mechanisms involved in the cancer progression, including the proposed cellular and molecular mechanisms in cancer cells trajectory. AT1: alveolar type 1 cells; AT2: alveolar type 2 cells; AAH: atypical adenomatous hyperplasia; AIS: adenocarcinoma in situ; MIA: minimally invasive adenocarcinoma; IA: invasive adenocarcinoma; EMT: epithelial-mesenchymal transition

Home

Download

Statistics

Help

Contact

Center for Computational Systems Medicine
leaf

Gene summary

leaf

Malignant transformation analysis

leaf

Malignant transformation related pathway analysis

leaf

Cell-cell communication analysis

leaf

Single-cell gene regulatory network inference analysis

leaf

Somatic mutation of malignant transformation related genes

leaf

Related drugs of malignant transformation related genes

Gene: CAMK2N1

Gene summary for CAMK2N1

check button Gene summary.

Gene informationSpeciesHuman
Gene symbol

CAMK2N1

Gene ID

55450

Gene namecalcium/calmodulin dependent protein kinase II inhibitor 1
Gene AliasPRO1489
Cytomap1p36.12
Gene Typeprotein-coding
GO ID

GO:0000165

UniProtAcc

Q7Z7J9


Top

Malignant transformation analysis

check button Identification of the aberrant gene expression in precancerous and cancerous lesions by comparing the gene expression of stem-like cells in diseased tissues with normal stem cells
check button Malignant transformation involving gene list.
Entrez IDSymbolReplicatesSpeciesOrganTissueAdj P-valueLog2FCMalignancy
55450CAMK2N1GSM4909285HumanBreastIDC3.78e-02-1.77e-010.21
55450CAMK2N1GSM4909286HumanBreastIDC1.03e-04-2.03e-010.1081
55450CAMK2N1GSM4909287HumanBreastIDC4.38e-07-2.14e-010.2057
55450CAMK2N1GSM4909290HumanBreastIDC1.81e-04-2.14e-010.2096
55450CAMK2N1GSM4909291HumanBreastIDC1.25e-115.38e-010.1753
55450CAMK2N1GSM4909293HumanBreastIDC8.37e-062.98e-010.1581
55450CAMK2N1GSM4909294HumanBreastIDC3.10e-022.50e-010.2022
55450CAMK2N1GSM4909297HumanBreastIDC5.90e-043.04e-010.1517
55450CAMK2N1GSM4909298HumanBreastIDC3.35e-093.32e-010.1551
55450CAMK2N1GSM4909306HumanBreastIDC1.27e-022.55e-010.1564
55450CAMK2N1GSM4909307HumanBreastIDC2.07e-03-1.80e-010.1569
55450CAMK2N1GSM4909308HumanBreastIDC1.11e-03-2.07e-010.158
55450CAMK2N1GSM4909311HumanBreastIDC6.00e-06-9.27e-020.1534
55450CAMK2N1GSM4909317HumanBreastIDC2.93e-093.02e-010.1355
55450CAMK2N1GSM4909319HumanBreastIDC9.19e-07-1.63e-010.1563
55450CAMK2N1GSM4909321HumanBreastIDC2.64e-073.73e-010.1559
55450CAMK2N1brca2HumanBreastPrecancer6.22e-041.16e-01-0.024
55450CAMK2N1brca3HumanBreastPrecancer3.00e-041.62e-01-0.0263
55450CAMK2N1NCCBC14HumanBreastDCIS3.01e-238.46e-010.2021
55450CAMK2N1NCCBC5HumanBreastDCIS2.16e-033.30e-010.2046
Page: 1 2 3 4 5 6 7 8 

check button Transcriptomic changes along malignancy continuum.
TissueExpression DynamicsAbbreviation
BreastThe image shows the transcriptomic changes along malignancy continuum.log2FC in expression of this searched gene in stem-like cells from each diseased tissue sample relative to stem-like cells in normal samples in each tissue plotted against the malignancy continuum. Samples are colored based on if they are from different disease stage.IDC: Invasive ductal carcinoma
DCIS: Ductal carcinoma in situ
Precancer(BRCA1-mut): Precancerous lesion from BRCA1 mutation carriers
Colorectum (GSE201348)The image shows the transcriptomic changes along malignancy continuum.log2FC in expression of this searched gene in stem-like cells from each diseased tissue sample relative to stem-like cells in normal samples in each tissue plotted against the malignancy continuum. Samples are colored based on if they are from different disease stage.FAP: Familial adenomatous polyposis
CRC: Colorectal cancer
Colorectum (HTA11)The image shows the transcriptomic changes along malignancy continuum.log2FC in expression of this searched gene in stem-like cells from each diseased tissue sample relative to stem-like cells in normal samples in each tissue plotted against the malignancy continuum. Samples are colored based on if they are from different disease stage.AD: Adenomas
SER: Sessile serrated lesions
MSI-H: Microsatellite-high colorectal cancer
MSS: Microsatellite stable colorectal cancer
EsophagusThe image shows the transcriptomic changes along malignancy continuum.log2FC in expression of this searched gene in stem-like cells from each diseased tissue sample relative to stem-like cells in normal samples in each tissue plotted against the malignancy continuum. Samples are colored based on if they are from different disease stage.ESCC: Esophageal squamous cell carcinoma
HGIN: High-grade intraepithelial neoplasias
LGIN: Low-grade intraepithelial neoplasias
GCThe image shows the transcriptomic changes along malignancy continuum.log2FC in expression of this searched gene in stem-like cells from each diseased tissue sample relative to stem-like cells in normal samples in each tissue plotted against the malignancy continuum. Samples are colored based on if they are from different disease stage.
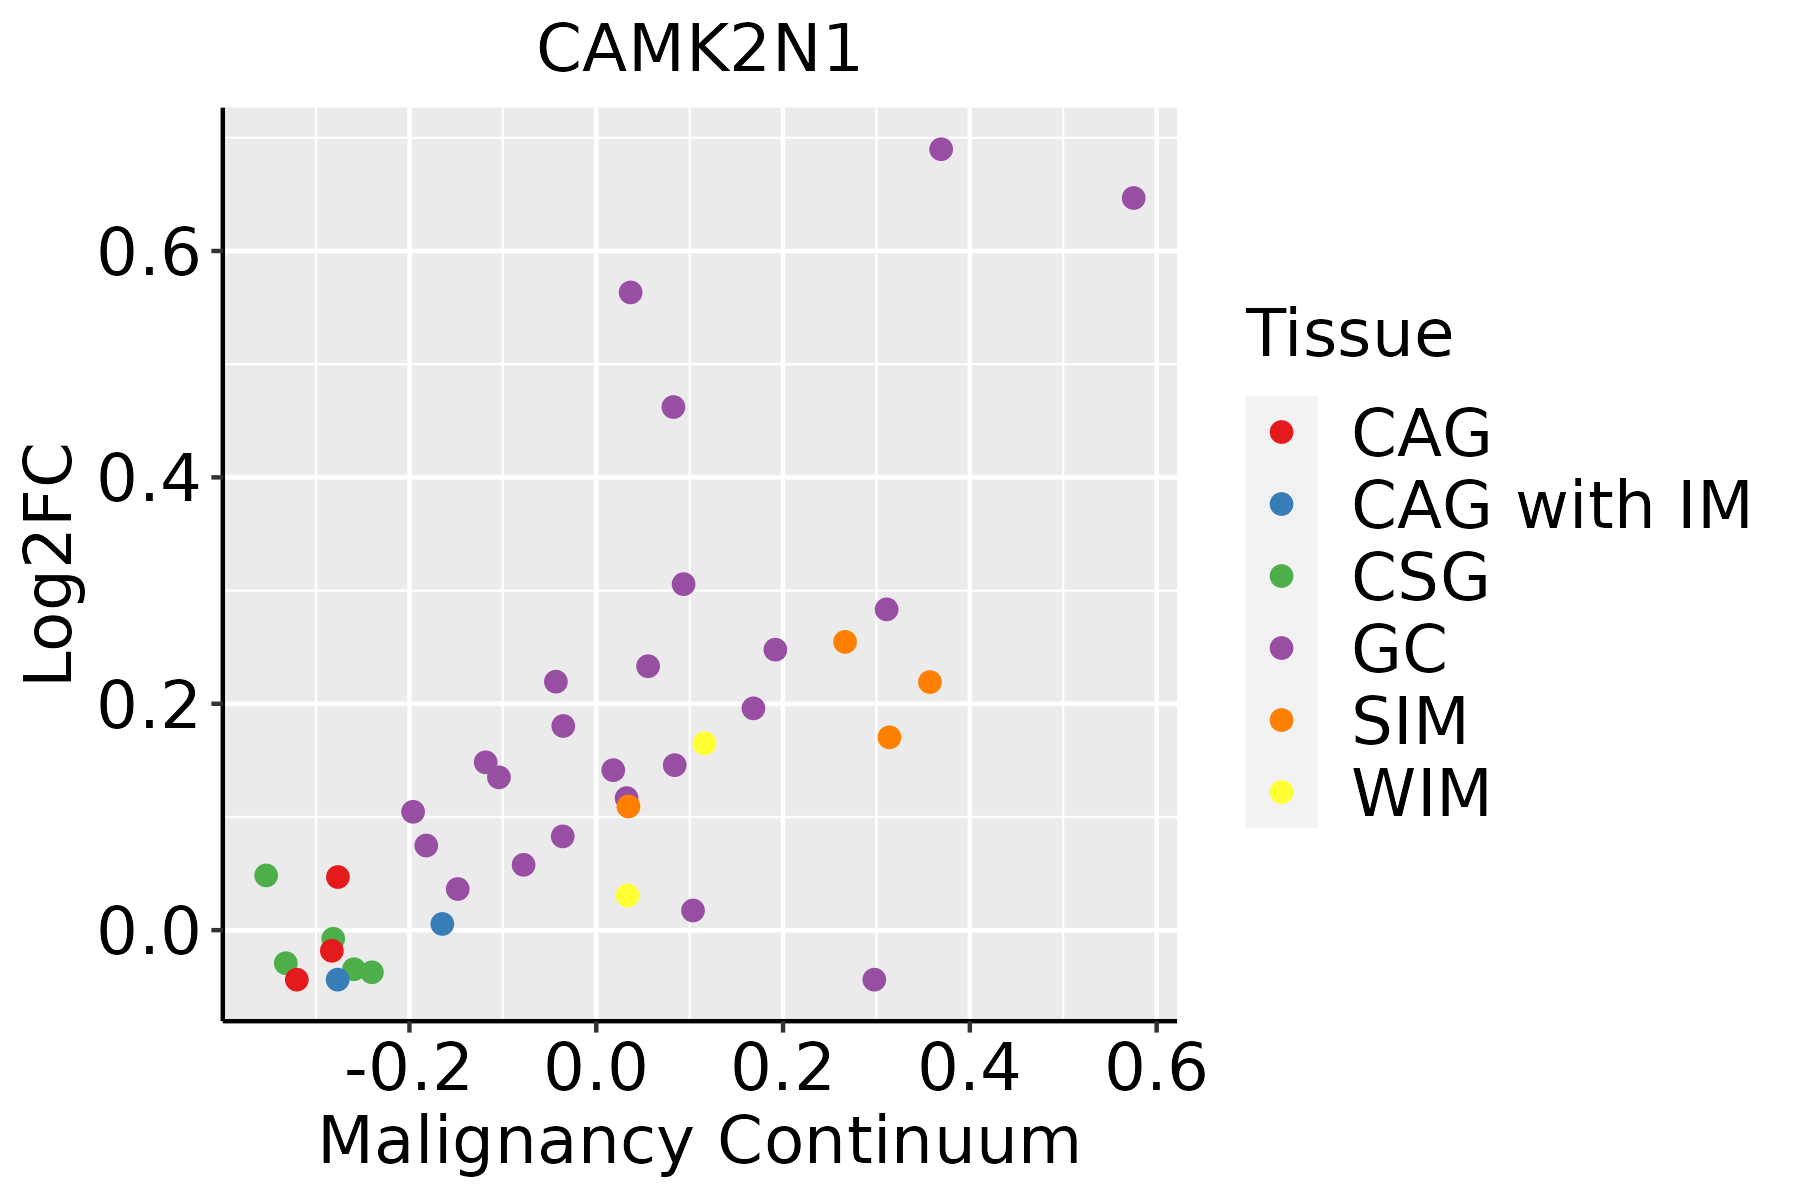
CAG: Chronic atrophic gastritis
CAG with IM: Chronic atrophic gastritis with intestinal metaplasia
CSG: Chronic superficial gastritis
GC: Gastric cancer
SIM: Severe intestinal metaplasia
WIM: Wild intestinal metaplasia
LiverThe image shows the transcriptomic changes along malignancy continuum.log2FC in expression of this searched gene in stem-like cells from each diseased tissue sample relative to stem-like cells in normal samples in each tissue plotted against the malignancy continuum. Samples are colored based on if they are from different disease stage.
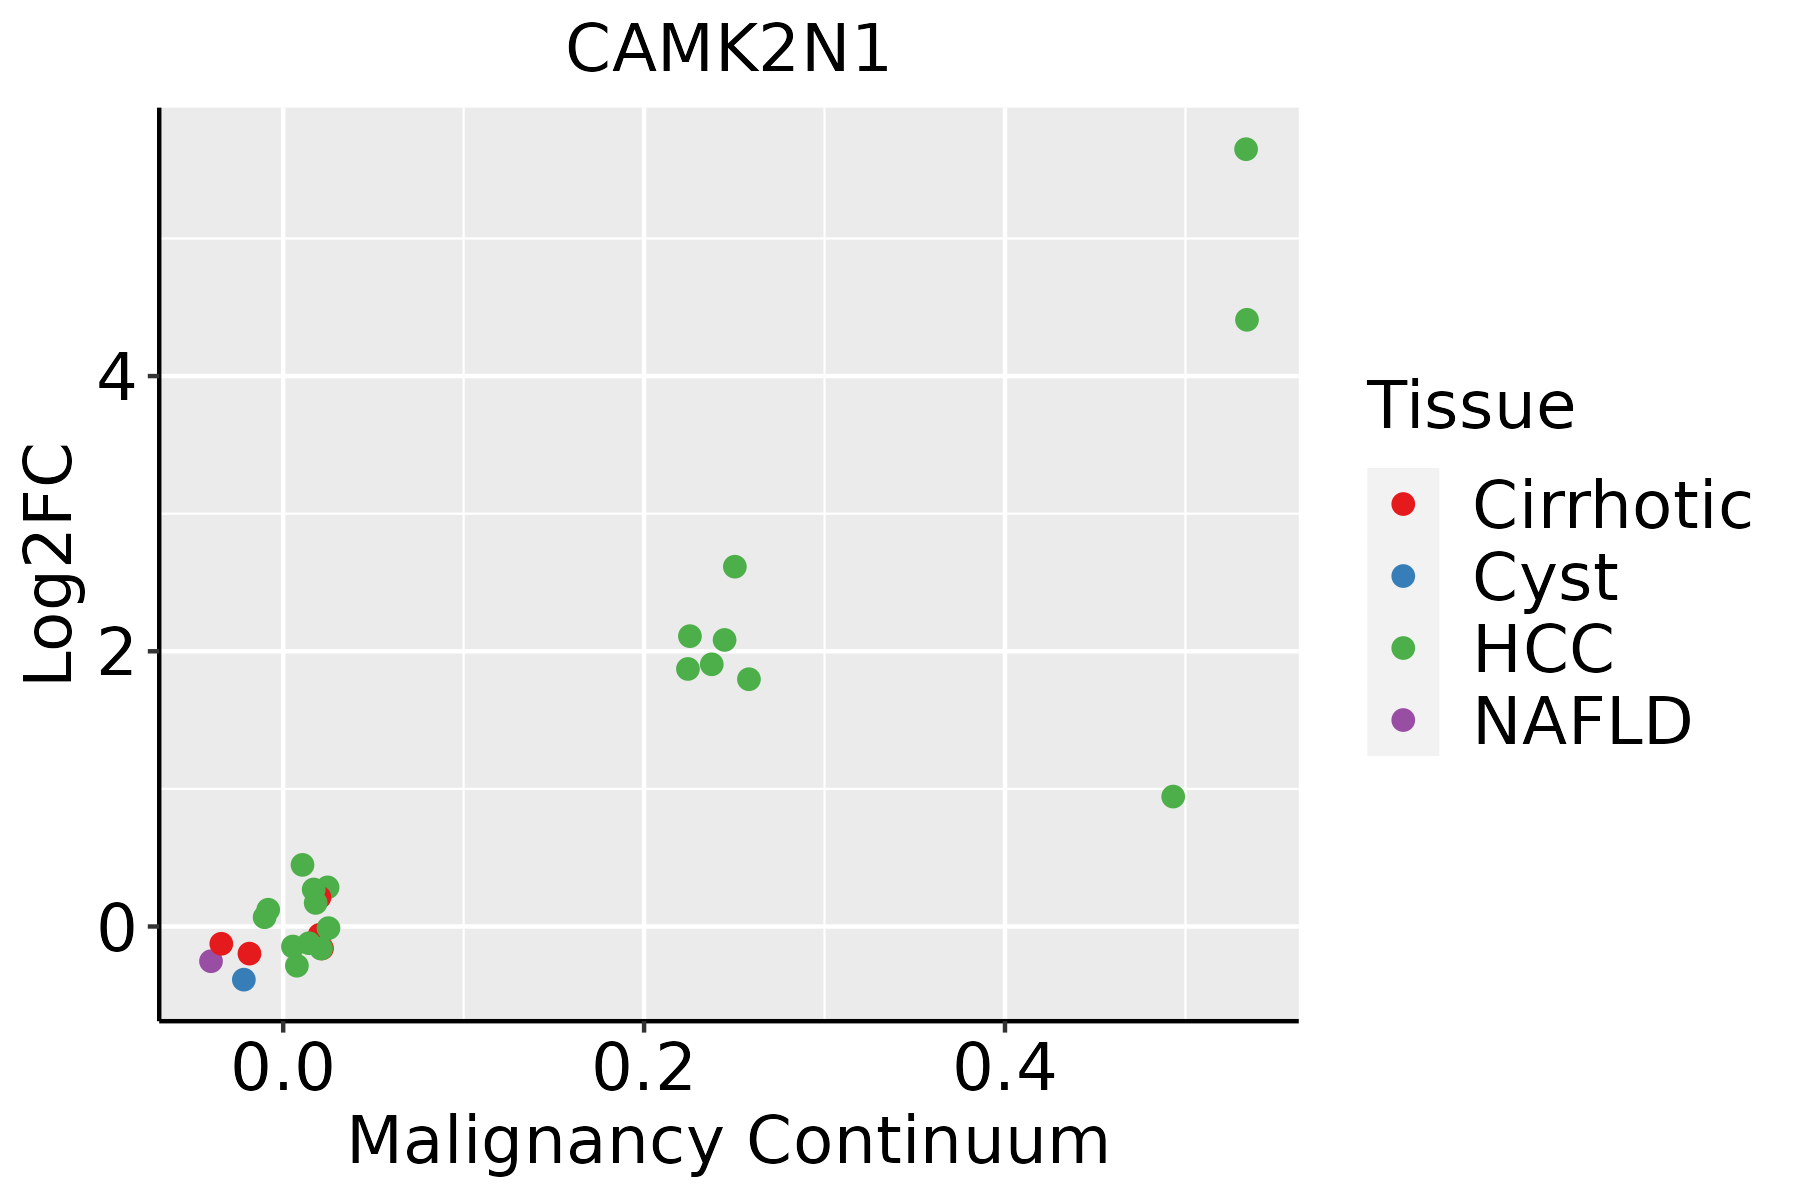
HCC: Hepatocellular carcinoma
NAFLD: Non-alcoholic fatty liver disease
Oral CavityThe image shows the transcriptomic changes along malignancy continuum.log2FC in expression of this searched gene in stem-like cells from each diseased tissue sample relative to stem-like cells in normal samples in each tissue plotted against the malignancy continuum. Samples are colored based on if they are from different disease stage.
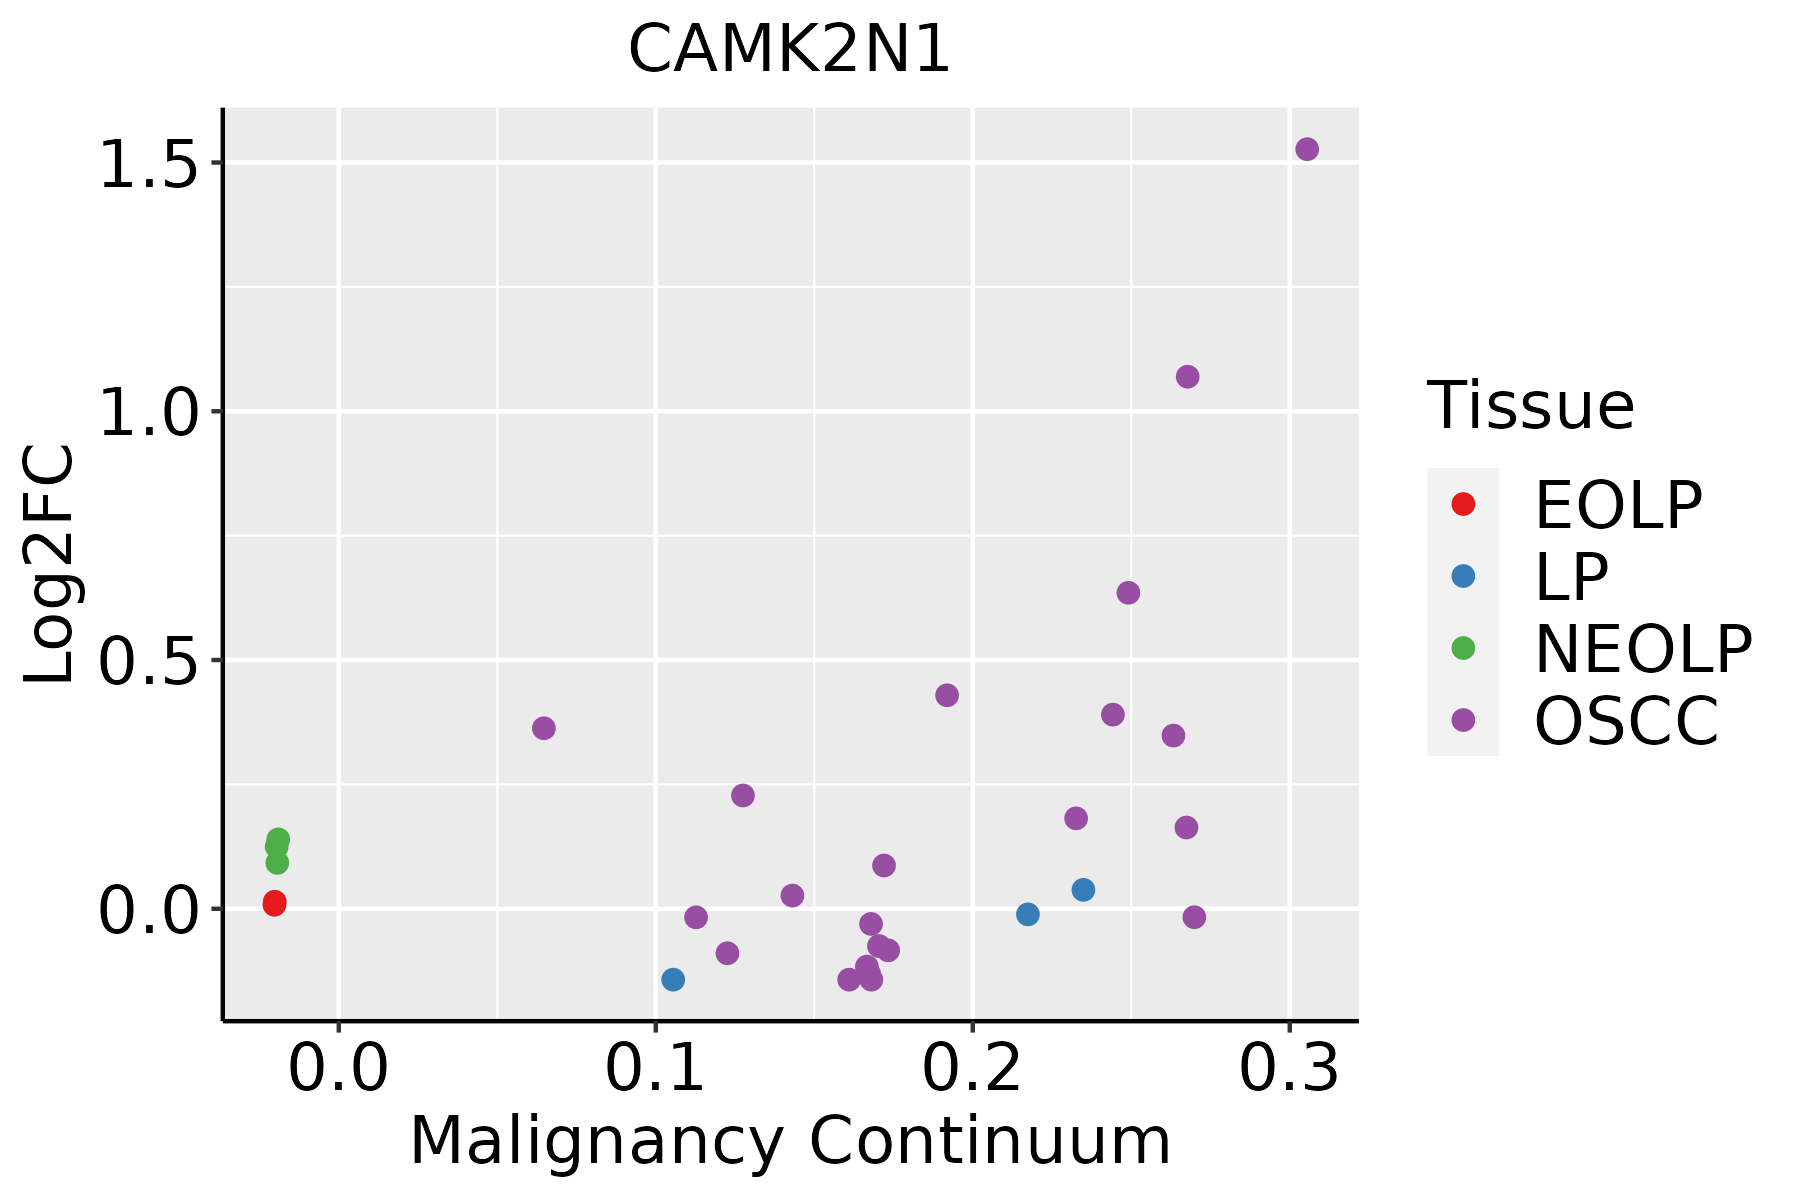
EOLP: Erosive Oral lichen planus
LP: leukoplakia
NEOLP: Non-erosive oral lichen planus
OSCC: Oral squamous cell carcinoma
ProstateThe image shows the transcriptomic changes along malignancy continuum.log2FC in expression of this searched gene in stem-like cells from each diseased tissue sample relative to stem-like cells in normal samples in each tissue plotted against the malignancy continuum. Samples are colored based on if they are from different disease stage.
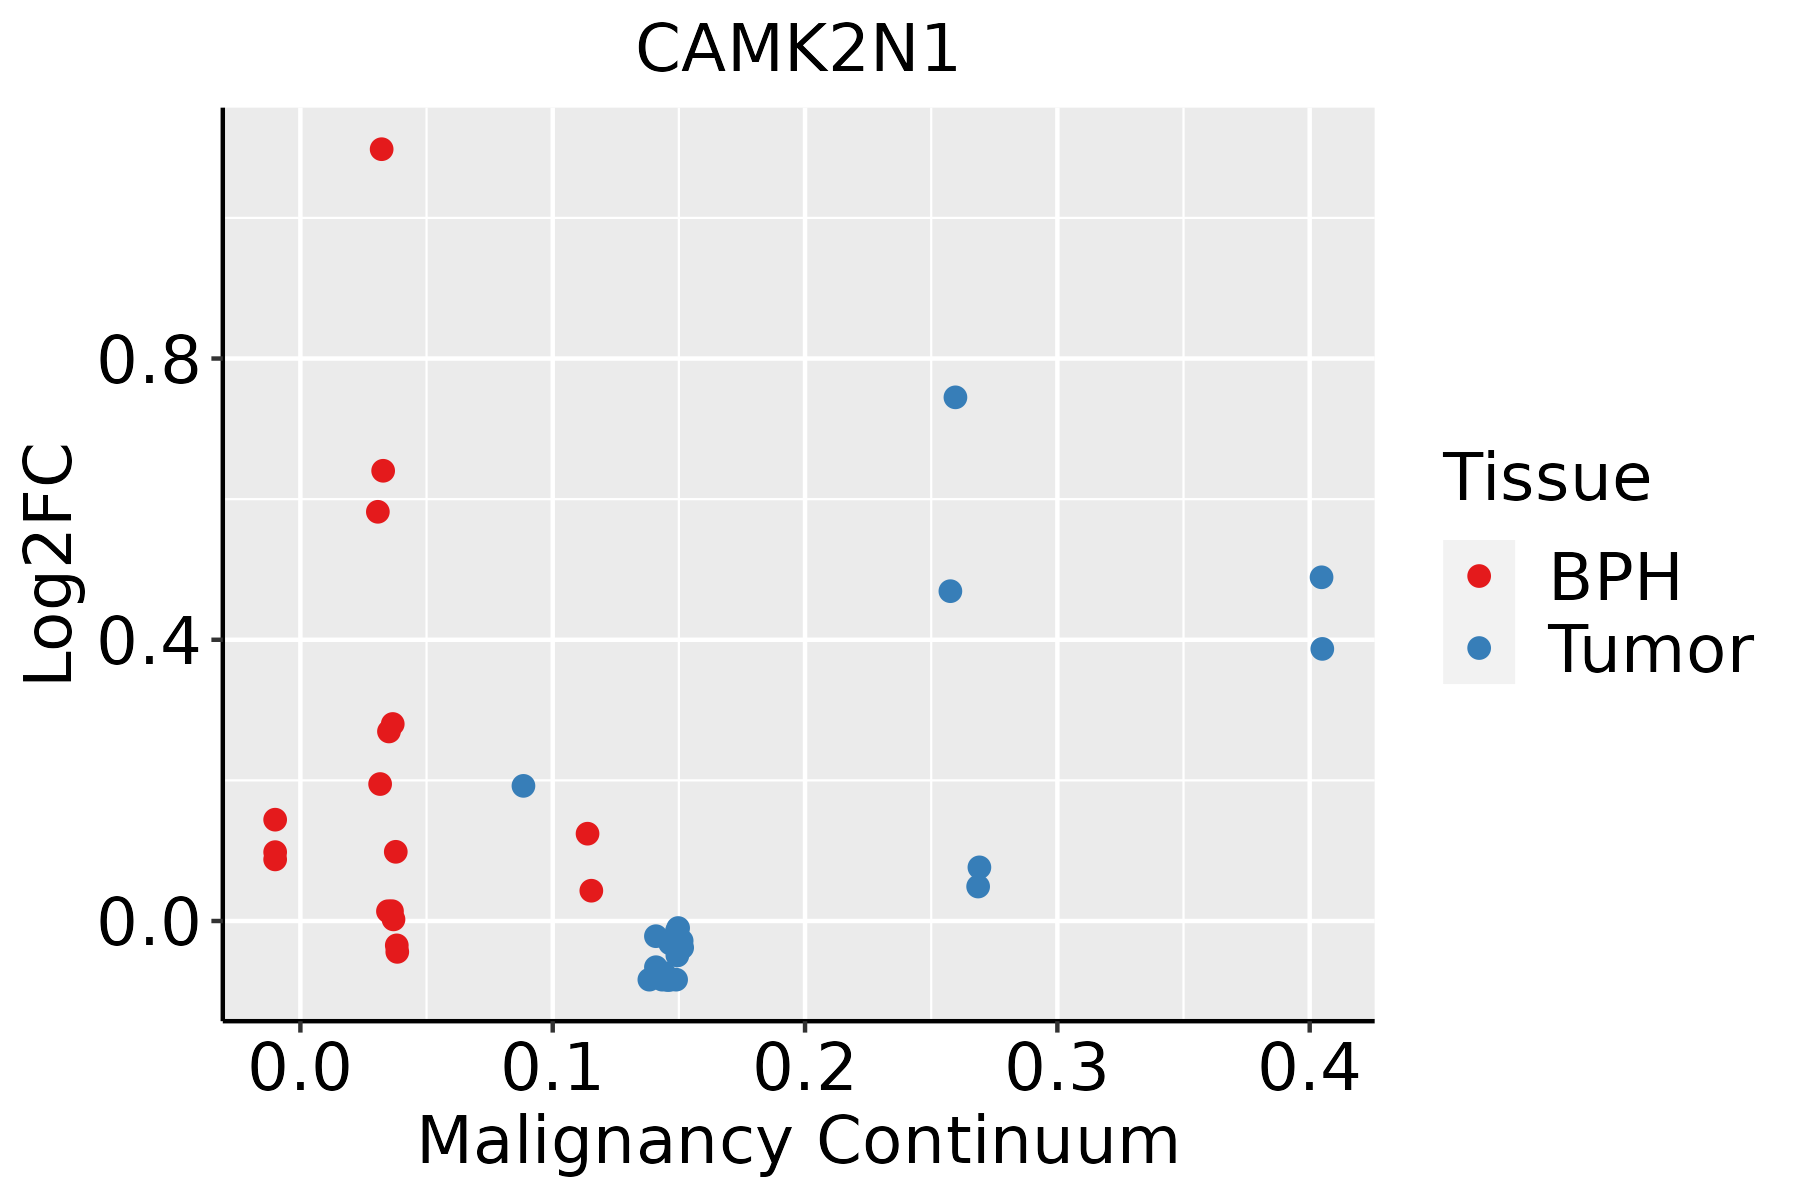
BPH: Benign Prostatic Hyperplasia
ThyroidThe image shows the transcriptomic changes along malignancy continuum.log2FC in expression of this searched gene in stem-like cells from each diseased tissue sample relative to stem-like cells in normal samples in each tissue plotted against the malignancy continuum. Samples are colored based on if they are from different disease stage.ATC: Anaplastic thyroid cancer
HT: Hashimoto's thyroiditis
PTC: Papillary thyroid cancer
∗log2FC in expression of this searched gene in stem-like cells from each diseased tissue sample relative to stem-like cells in normal samples in each tissue plotted against the malignancy continuum. Samples are colored based on if they are from different disease stage.

Top

Malignant transformation related pathway analysis

check buttonFind out the enriched GO biological processes and KEGG pathways involved in transition from healthy to precancer to cancer
check button Figure of enriched GO biological processes.
TissueDisease StageEnriched GO biological Processes
ColorectumADGO analysis - Figure of enriched GO biological processes: Top 15 enriched GO BP terms are showed in the bar plot of each disease state in each tissue. Each row represents a significant GO biological process which is colored according to the -log10(p.adjust).
ColorectumSERGO analysis - Figure of enriched GO biological processes: Top 15 enriched GO BP terms are showed in the bar plot of each disease state in each tissue. Each row represents a significant GO biological process which is colored according to the -log10(p.adjust).
ColorectumMSSGO analysis - Figure of enriched GO biological processes: Top 15 enriched GO BP terms are showed in the bar plot of each disease state in each tissue. Each row represents a significant GO biological process which is colored according to the -log10(p.adjust).
ColorectumMSI-HGO analysis - Figure of enriched GO biological processes: Top 15 enriched GO BP terms are showed in the bar plot of each disease state in each tissue. Each row represents a significant GO biological process which is colored according to the -log10(p.adjust).
ColorectumFAPGO analysis - Figure of enriched GO biological processes: Top 15 enriched GO BP terms are showed in the bar plot of each disease state in each tissue. Each row represents a significant GO biological process which is colored according to the -log10(p.adjust).
∗Top 15 enriched GO BP terms are showed in the bar plot of each disease state in each tissue. Each row represents a significant GO biological process which is colored according to the -log10(p.adjust).
Page: 1 2 3 4 5 6 7 8 9 

check button Enriched GO biological processes.
GO IDTissueDisease StageDescriptionGene RatioBg Ratiopvaluep.adjustCount
GO:00458619BreastPrecancernegative regulation of proteolysis50/1080351/187232.99e-092.39e-0750
GO:00342849BreastPrecancerresponse to monosaccharide29/1080225/187234.19e-059.00e-0429
GO:00097439BreastPrecancerresponse to carbohydrate31/1080253/187236.15e-051.25e-0331
GO:00425938BreastPrecancerglucose homeostasis31/1080258/187238.89e-051.69e-0331
GO:19049519BreastPrecancerpositive regulation of establishment of protein localization36/1080319/187239.30e-051.75e-0336
GO:00335008BreastPrecancercarbohydrate homeostasis31/1080259/187239.56e-051.79e-0331
GO:00097469BreastPrecancerresponse to hexose27/1080219/187231.61e-042.69e-0327
GO:00097498BreastPrecancerresponse to glucose25/1080212/187235.46e-047.00e-0325
GO:00016787BreastPrecancercellular glucose homeostasis21/1080172/187239.38e-041.06e-0221
GO:00713337BreastPrecancercellular response to glucose stimulus19/1080151/187231.12e-031.23e-0219
GO:00713228BreastPrecancercellular response to carbohydrate stimulus20/1080163/187231.15e-031.26e-0220
GO:00713317BreastPrecancercellular response to hexose stimulus19/1080153/187231.31e-031.39e-0219
GO:00713267BreastPrecancercellular response to monosaccharide stimulus19/1080154/187231.42e-031.48e-0219
GO:00512229BreastPrecancerpositive regulation of protein transport31/1080303/187231.44e-031.50e-0231
GO:00507086BreastPrecancerregulation of protein secretion28/1080268/187231.76e-031.74e-0228
GO:00158336BreastPrecancerpeptide transport27/1080264/187232.84e-032.49e-0227
GO:00900875BreastPrecancerregulation of peptide transport22/1080202/187233.14e-032.65e-0222
GO:00513489BreastPrecancernegative regulation of transferase activity27/1080268/187233.49e-032.90e-0227
GO:00300736BreastPrecancerinsulin secretion21/1080195/187234.38e-033.42e-0221
GO:00716926BreastPrecancerprotein localization to extracellular region34/1080368/187234.65e-033.58e-0234
Page: 1 2 3 4 5 6 7 8 9 10 11 12 13 14 15 16 17 18 19 20 21 22 23 24 25 26 27 28 29 

check button Enriched KEGG pathways.
Pathway IDTissueDisease StageDescriptionGene RatioBg Ratiopvaluep.adjustqvalueCount
Page: 1 

Top

Cell-cell communication analysis

check buttonIdentification of potential cell-cell interactions between two cell types and their ligand-receptor pairs for different disease states
LigandReceptorLRpairPathwayTissueDisease Stage
Page: 1 

Top

Single-cell gene regulatory network inference analysis

check buttonFind out the significant the regulons (TFs) and the target genes of each regulon across cell types for different disease states
TFCell TypeTissueDisease StageTarget GeneRSSRegulon Activity
∗The dot plots of a searched regulon are shown for all cell subpopulations in each disease state of each tissue based on the regulon specific score inferred using pySCENIC and by calculating the average expression.
Page: 1 

Top

Somatic mutation of malignant transformation related genes

check buttonAnnotation of somatic variants for genes involved in malignant transformation
Hugo SymbolVariant ClassVariant ClassificationdbSNP RSHGVScHGVSpHGVSp ShortSWISSPROTBIOTYPESIFTPolyPhenTumor Sample BarcodeTissueHistologySexAgeStageTherapy TypesDrugsOutcome
CAMK2N1SNVMissense_Mutationnovelc.203N>Cp.Lys68Thrp.K68TQ7Z7J9protein_codingdeleterious_low_confidence(0.01)possibly_damaging(0.563)TCGA-AJ-A5DW-01Endometriumuterine corpus endometrioid carcinomaFemale<65I/IIUnknownUnknownSD
CAMK2N1SNVMissense_Mutationnovelc.196N>Ap.Val66Metp.V66MQ7Z7J9protein_codingdeleterious_low_confidence(0)possibly_damaging(0.706)TCGA-AP-A1DK-01Endometriumuterine corpus endometrioid carcinomaFemale<65I/IIUnknownUnknownSD
CAMK2N1SNVMissense_Mutationnovelc.185G>Tp.Arg62Metp.R62MQ7Z7J9protein_codingdeleterious_low_confidence(0)probably_damaging(0.993)TCGA-FI-A2D5-01Endometriumuterine corpus endometrioid carcinomaFemale<65III/IVChemotherapycarboplatinumPD
CAMK2N1SNVMissense_Mutationc.113N>Gp.Ala38Glyp.A38GQ7Z7J9protein_codingtolerated_low_confidence(1)benign(0)TCGA-CC-A7IH-01Liverliver hepatocellular carcinomaMale<65III/IVUnknownUnknownSD
CAMK2N1SNVMissense_Mutationc.219N>Tp.Lys73Asnp.K73NQ7Z7J9protein_codingdeleterious_low_confidence(0.01)probably_damaging(0.991)TCGA-50-5930-01Lunglung adenocarcinomaMale<65III/IVChemotherapytaxoterePD
CAMK2N1SNVMissense_Mutationnovelc.195N>Ap.Asp65Glup.D65EQ7Z7J9protein_codingtolerated_low_confidence(0.57)benign(0.005)TCGA-78-7155-01Lunglung adenocarcinomaMale>=65I/IIChemotherapycarboplatinPD
CAMK2N1SNVMissense_Mutationc.95N>Ap.Thr32Asnp.T32NQ7Z7J9protein_codingdeleterious_low_confidence(0.01)benign(0)TCGA-97-7937-01Lunglung adenocarcinomaMale>=65I/IIUnknownUnknownSD
CAMK2N1SNVMissense_Mutationnovelc.220N>Tp.Ala74Serp.A74SQ7Z7J9protein_codingtolerated_low_confidence(1)benign(0.003)TCGA-39-5040-01Lunglung squamous cell carcinomaMale<65III/IVChemotherapycisplatinPD
Page: 1 

Top

Related drugs of malignant transformation related genes

check buttonIdentification of chemicals and drugs interact with genes involved in malignant transfromation
(DGIdb 4.0)
Entrez IDSymbolCategoryInteraction TypesDrug Claim NameDrug NamePMIDs
Page: 1