
|
|||||
|
 | |
| |
| |
| |
| |
| |
|
Gene: CAMK2B |
Gene summary for CAMK2B |
| Gene information | Species | Human | Gene symbol | CAMK2B | Gene ID | 816 |
| Gene name | calcium/calmodulin dependent protein kinase II beta | |
| Gene Alias | CAM2 | |
| Cytomap | 7p13 | |
| Gene Type | protein-coding | GO ID | GO:0000902 | UniProtAcc | A4D2J9 |
Top |
Malignant transformation analysis |
| Identification of the aberrant gene expression in precancerous and cancerous lesions by comparing the gene expression of stem-like cells in diseased tissues with normal stem cells |
| Entrez ID | Symbol | Replicates | Species | Organ | Tissue | Adj P-value | Log2FC | Malignancy |
| 816 | CAMK2B | HTA11_3410_2000001011 | Human | Colorectum | AD | 3.47e-03 | 1.03e-01 | 0.0155 |
| 816 | CAMK2B | HTA11_2487_2000001011 | Human | Colorectum | SER | 2.89e-04 | 1.44e-01 | -0.1808 |
| 816 | CAMK2B | HTA11_347_2000001011 | Human | Colorectum | AD | 8.18e-05 | 1.32e-01 | -0.1954 |
| 816 | CAMK2B | HTA11_3361_2000001011 | Human | Colorectum | AD | 5.46e-03 | 1.46e-01 | -0.1207 |
| 816 | CAMK2B | HTA11_696_2000001011 | Human | Colorectum | AD | 2.07e-07 | 1.70e-01 | -0.1464 |
| 816 | CAMK2B | HTA11_1391_2000001011 | Human | Colorectum | AD | 6.96e-05 | 1.50e-01 | -0.059 |
| 816 | CAMK2B | HTA11_5216_2000001011 | Human | Colorectum | SER | 3.40e-02 | 1.93e-01 | -0.1462 |
| 816 | CAMK2B | HTA11_10623_2000001011 | Human | Colorectum | AD | 8.98e-03 | 1.67e-01 | -0.0177 |
| 816 | CAMK2B | HTA11_10711_2000001011 | Human | Colorectum | AD | 3.52e-05 | 1.74e-01 | 0.0338 |
| 816 | CAMK2B | HTA11_7696_3000711011 | Human | Colorectum | AD | 8.62e-04 | 1.10e-01 | 0.0674 |
| 816 | CAMK2B | HTA11_6818_2000001011 | Human | Colorectum | AD | 2.86e-09 | 5.04e-01 | 0.0112 |
| 816 | CAMK2B | HTA11_7469_2000001011 | Human | Colorectum | AD | 3.81e-02 | 2.45e-01 | -0.0124 |
| 816 | CAMK2B | HTA11_6818_2000001021 | Human | Colorectum | AD | 7.45e-08 | 2.54e-01 | 0.0588 |
| 816 | CAMK2B | HTA11_99999973899_84307 | Human | Colorectum | MSS | 5.79e-04 | 1.99e-01 | 0.2585 |
| 816 | CAMK2B | LZE7T | Human | Esophagus | ESCC | 1.41e-03 | 3.02e-01 | 0.0667 |
| 816 | CAMK2B | P2T-E | Human | Esophagus | ESCC | 6.56e-10 | 3.24e-01 | 0.1177 |
| 816 | CAMK2B | P8T-E | Human | Esophagus | ESCC | 3.08e-12 | 4.97e-01 | 0.0889 |
| 816 | CAMK2B | P20T-E | Human | Esophagus | ESCC | 3.22e-15 | 6.37e-01 | 0.1124 |
| 816 | CAMK2B | P27T-E | Human | Esophagus | ESCC | 2.34e-03 | 1.28e-01 | 0.1055 |
| 816 | CAMK2B | P42T-E | Human | Esophagus | ESCC | 9.64e-04 | 2.58e-01 | 0.1175 |
| Page: 1 2 |
| Tissue | Expression Dynamics | Abbreviation |
| Colorectum (GSE201348) |  | FAP: Familial adenomatous polyposis |
| CRC: Colorectal cancer | ||
| Colorectum (HTA11) |  | AD: Adenomas |
| SER: Sessile serrated lesions | ||
| MSI-H: Microsatellite-high colorectal cancer | ||
| MSS: Microsatellite stable colorectal cancer | ||
| Esophagus | 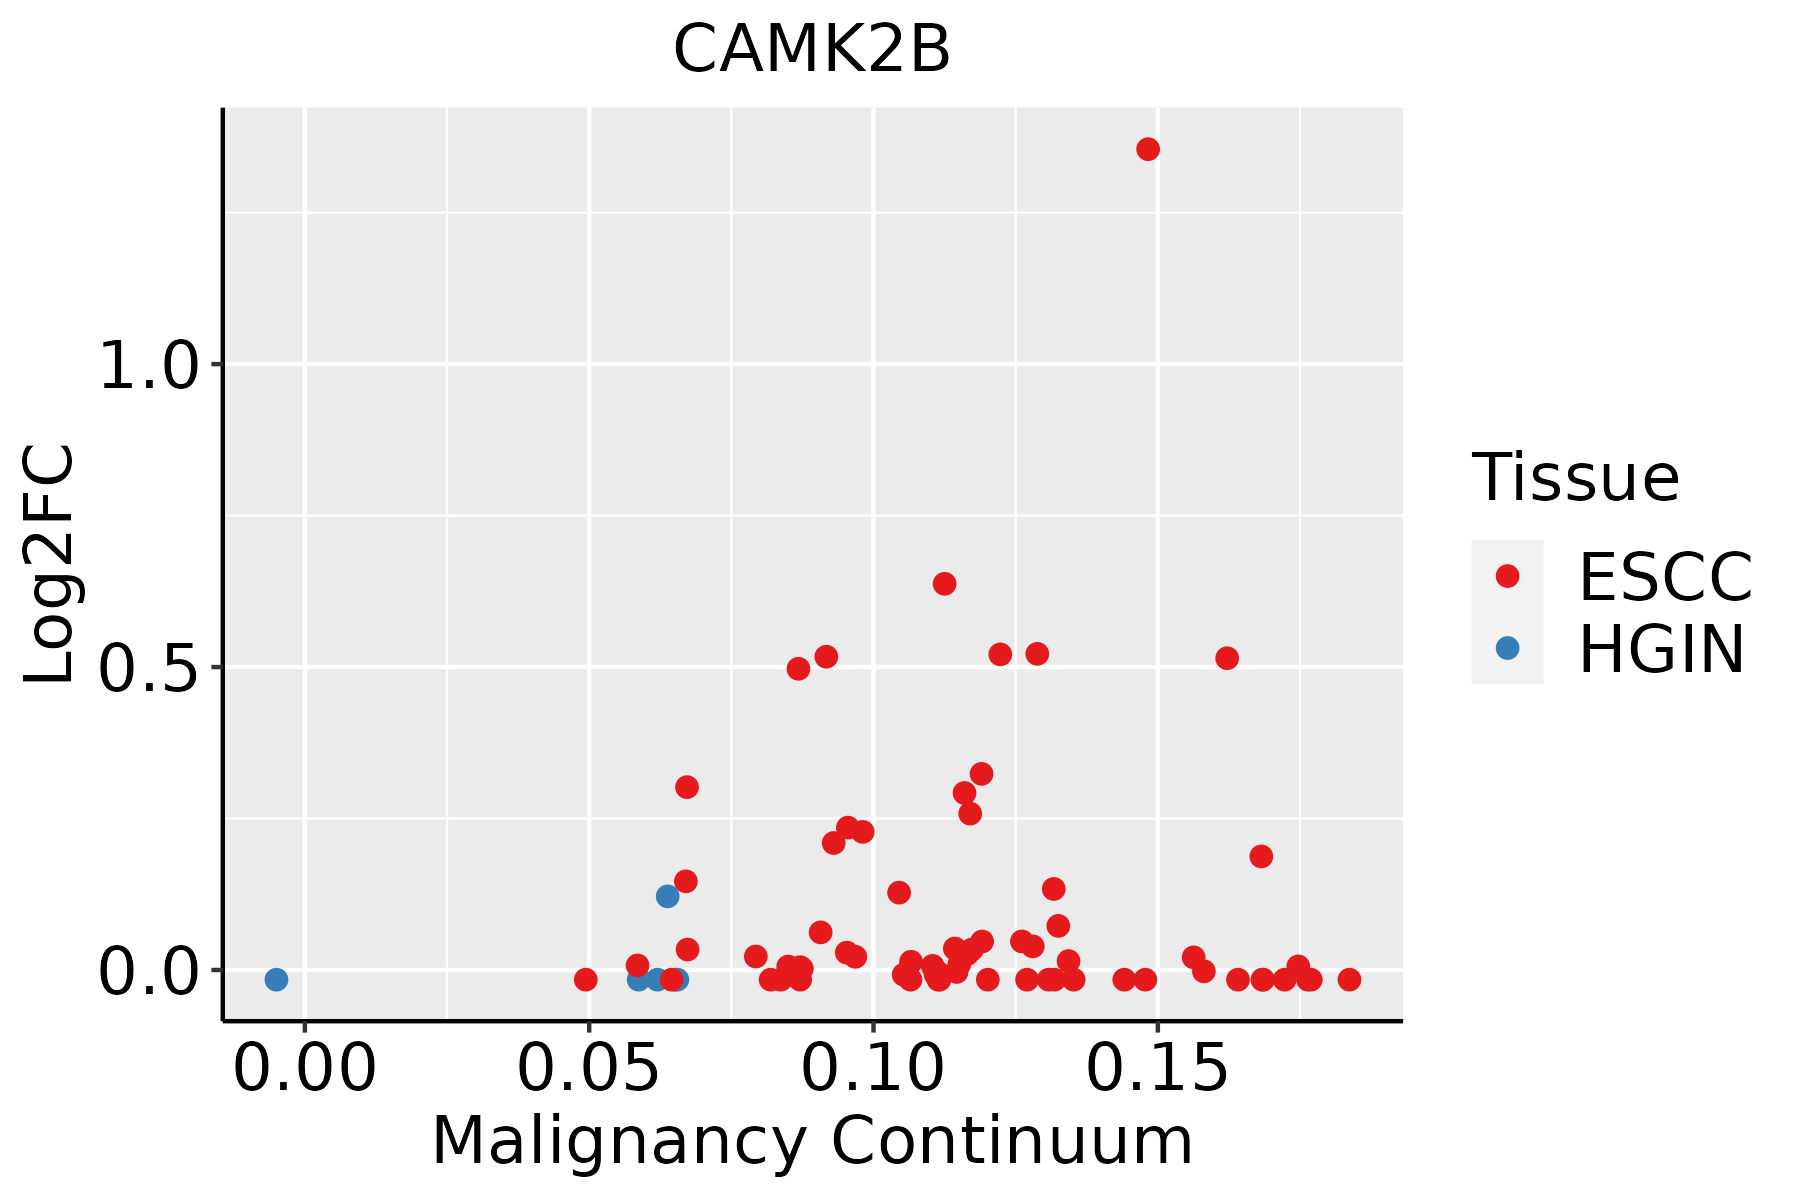 | ESCC: Esophageal squamous cell carcinoma |
| HGIN: High-grade intraepithelial neoplasias | ||
| LGIN: Low-grade intraepithelial neoplasias | ||
| Thyroid | 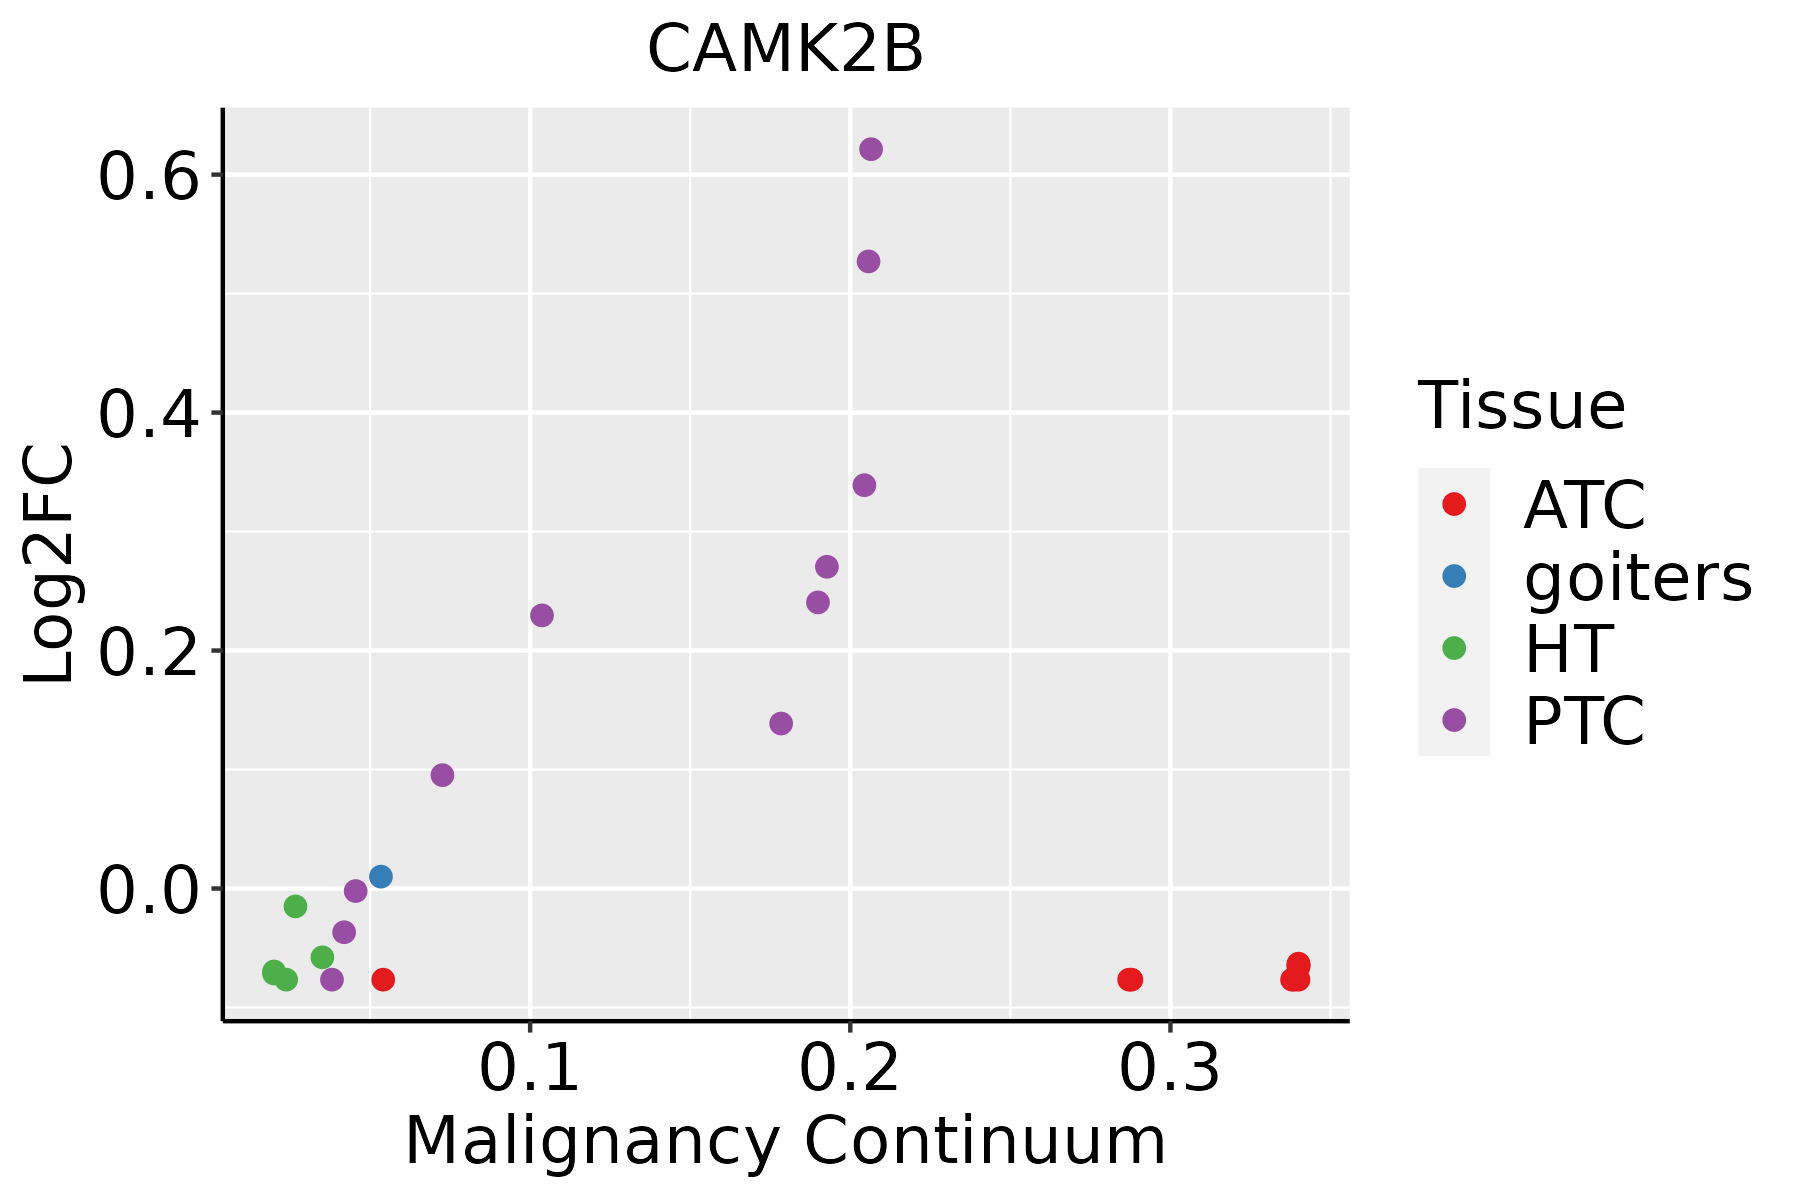 | ATC: Anaplastic thyroid cancer |
| HT: Hashimoto's thyroiditis | ||
| PTC: Papillary thyroid cancer |
| ∗log2FC in expression of this searched gene in stem-like cells from each diseased tissue sample relative to stem-like cells in normal samples in each tissue plotted against the malignancy continuum. Samples are colored based on if they are from different disease stage. |
Top |
Malignant transformation related pathway analysis |
| Find out the enriched GO biological processes and KEGG pathways involved in transition from healthy to precancer to cancer |
| Tissue | Disease Stage | Enriched GO biological Processes |
| Colorectum | AD |  |
| Colorectum | SER |  |
| Colorectum | MSS |  |
| Colorectum | MSI-H |  |
| Colorectum | FAP |  |
| ∗Top 15 enriched GO BP terms are showed in the bar plot of each disease state in each tissue. Each row represents a significant GO biological process which is colored according to the -log10(p.adjust). |
| Page: 1 2 3 4 5 6 7 8 9 |
| GO ID | Tissue | Disease Stage | Description | Gene Ratio | Bg Ratio | pvalue | p.adjust | Count |
| GO:0022604 | Colorectum | AD | regulation of cell morphogenesis | 109/3918 | 309/18723 | 3.08e-09 | 2.07e-07 | 109 |
| GO:0046777 | Colorectum | AD | protein autophosphorylation | 74/3918 | 227/18723 | 2.48e-05 | 4.76e-04 | 74 |
| GO:0010975 | Colorectum | AD | regulation of neuron projection development | 129/3918 | 445/18723 | 2.88e-05 | 5.37e-04 | 129 |
| GO:0106027 | Colorectum | AD | neuron projection organization | 36/3918 | 93/18723 | 6.58e-05 | 1.07e-03 | 36 |
| GO:0031346 | Colorectum | AD | positive regulation of cell projection organization | 104/3918 | 353/18723 | 8.26e-05 | 1.30e-03 | 104 |
| GO:0010769 | Colorectum | AD | regulation of cell morphogenesis involved in differentiation | 35/3918 | 96/18723 | 3.26e-04 | 3.85e-03 | 35 |
| GO:0010770 | Colorectum | AD | positive regulation of cell morphogenesis involved in differentiation | 30/3918 | 79/18723 | 3.81e-04 | 4.38e-03 | 30 |
| GO:0010720 | Colorectum | AD | positive regulation of cell development | 87/3918 | 298/18723 | 4.17e-04 | 4.71e-03 | 87 |
| GO:0097061 | Colorectum | AD | dendritic spine organization | 31/3918 | 84/18723 | 5.48e-04 | 5.83e-03 | 31 |
| GO:0090257 | Colorectum | AD | regulation of muscle system process | 73/3918 | 252/18723 | 1.46e-03 | 1.24e-02 | 73 |
| GO:0050767 | Colorectum | AD | regulation of neurogenesis | 99/3918 | 364/18723 | 2.35e-03 | 1.82e-02 | 99 |
| GO:0099173 | Colorectum | AD | postsynapse organization | 51/3918 | 168/18723 | 2.47e-03 | 1.90e-02 | 51 |
| GO:0016358 | Colorectum | AD | dendrite development | 69/3918 | 243/18723 | 3.32e-03 | 2.42e-02 | 69 |
| GO:0050808 | Colorectum | AD | synapse organization | 112/3918 | 426/18723 | 4.25e-03 | 2.92e-02 | 112 |
| GO:0050807 | Colorectum | AD | regulation of synapse organization | 60/3918 | 211/18723 | 5.67e-03 | 3.64e-02 | 60 |
| GO:0043502 | Colorectum | AD | regulation of muscle adaptation | 31/3918 | 98/18723 | 8.45e-03 | 4.94e-02 | 31 |
| GO:00226041 | Colorectum | SER | regulation of cell morphogenesis | 89/2897 | 309/18723 | 1.51e-09 | 1.52e-07 | 89 |
| GO:01060271 | Colorectum | SER | neuron projection organization | 33/2897 | 93/18723 | 1.64e-06 | 7.23e-05 | 33 |
| GO:00970611 | Colorectum | SER | dendritic spine organization | 29/2897 | 84/18723 | 1.27e-05 | 4.01e-04 | 29 |
| GO:00467771 | Colorectum | SER | protein autophosphorylation | 60/2897 | 227/18723 | 1.36e-05 | 4.25e-04 | 60 |
| Page: 1 2 3 4 5 |
| Pathway ID | Tissue | Disease Stage | Description | Gene Ratio | Bg Ratio | pvalue | p.adjust | qvalue | Count |
| hsa05012 | Colorectum | AD | Parkinson disease | 147/2092 | 266/8465 | 2.53e-27 | 8.48e-25 | 5.41e-25 | 147 |
| hsa05415 | Colorectum | AD | Diabetic cardiomyopathy | 114/2092 | 203/8465 | 3.65e-22 | 3.06e-20 | 1.95e-20 | 114 |
| hsa05022 | Colorectum | AD | Pathways of neurodegeneration - multiple diseases | 201/2092 | 476/8465 | 4.54e-18 | 1.27e-16 | 8.09e-17 | 201 |
| hsa04066 | Colorectum | AD | HIF-1 signaling pathway | 48/2092 | 109/8465 | 7.25e-06 | 7.84e-05 | 5.00e-05 | 48 |
| hsa04722 | Colorectum | AD | Neurotrophin signaling pathway | 50/2092 | 119/8465 | 2.28e-05 | 2.24e-04 | 1.43e-04 | 50 |
| hsa04922 | Colorectum | AD | Glucagon signaling pathway | 41/2092 | 107/8465 | 1.18e-03 | 7.75e-03 | 4.94e-03 | 41 |
| hsa05417 | Colorectum | AD | Lipid and atherosclerosis | 73/2092 | 215/8465 | 1.31e-03 | 8.27e-03 | 5.27e-03 | 73 |
| hsa05205 | Colorectum | AD | Proteoglycans in cancer | 70/2092 | 205/8465 | 1.37e-03 | 8.46e-03 | 5.39e-03 | 70 |
| hsa04912 | Colorectum | AD | GnRH signaling pathway | 35/2092 | 93/8465 | 3.69e-03 | 1.90e-02 | 1.21e-02 | 35 |
| hsa04360 | Colorectum | AD | Axon guidance | 61/2092 | 182/8465 | 4.36e-03 | 2.17e-02 | 1.38e-02 | 61 |
| hsa04728 | Colorectum | AD | Dopaminergic synapse | 46/2092 | 132/8465 | 5.55e-03 | 2.48e-02 | 1.58e-02 | 46 |
| hsa04971 | Colorectum | AD | Gastric acid secretion | 29/2092 | 76/8465 | 6.25e-03 | 2.68e-02 | 1.71e-02 | 29 |
| hsa04720 | Colorectum | AD | Long-term potentiation | 26/2092 | 67/8465 | 7.26e-03 | 2.97e-02 | 1.89e-02 | 26 |
| hsa04012 | Colorectum | AD | ErbB signaling pathway | 31/2092 | 85/8465 | 1.02e-02 | 3.91e-02 | 2.50e-02 | 31 |
| hsa04310 | Colorectum | AD | Wnt signaling pathway | 56/2092 | 171/8465 | 1.03e-02 | 3.93e-02 | 2.51e-02 | 56 |
| hsa050121 | Colorectum | AD | Parkinson disease | 147/2092 | 266/8465 | 2.53e-27 | 8.48e-25 | 5.41e-25 | 147 |
| hsa054151 | Colorectum | AD | Diabetic cardiomyopathy | 114/2092 | 203/8465 | 3.65e-22 | 3.06e-20 | 1.95e-20 | 114 |
| hsa050221 | Colorectum | AD | Pathways of neurodegeneration - multiple diseases | 201/2092 | 476/8465 | 4.54e-18 | 1.27e-16 | 8.09e-17 | 201 |
| hsa040661 | Colorectum | AD | HIF-1 signaling pathway | 48/2092 | 109/8465 | 7.25e-06 | 7.84e-05 | 5.00e-05 | 48 |
| hsa047221 | Colorectum | AD | Neurotrophin signaling pathway | 50/2092 | 119/8465 | 2.28e-05 | 2.24e-04 | 1.43e-04 | 50 |
| Page: 1 2 3 4 5 6 |
Top |
Cell-cell communication analysis |
| Identification of potential cell-cell interactions between two cell types and their ligand-receptor pairs for different disease states |
| Ligand | Receptor | LRpair | Pathway | Tissue | Disease Stage |
| Page: 1 |
Top |
Single-cell gene regulatory network inference analysis |
| Find out the significant the regulons (TFs) and the target genes of each regulon across cell types for different disease states |
| TF | Cell Type | Tissue | Disease Stage | Target Gene | RSS | Regulon Activity |
| ∗The dot plots of a searched regulon are shown for all cell subpopulations in each disease state of each tissue based on the regulon specific score inferred using pySCENIC and by calculating the average expression. |
| Page: 1 |
Top |
Somatic mutation of malignant transformation related genes |
| Annotation of somatic variants for genes involved in malignant transformation |
| Hugo Symbol | Variant Class | Variant Classification | dbSNP RS | HGVSc | HGVSp | HGVSp Short | SWISSPROT | BIOTYPE | SIFT | PolyPhen | Tumor Sample Barcode | Tissue | Histology | Sex | Age | Stage | Therapy Types | Drugs | Outcome |
| CAMK2B | SNV | Missense_Mutation | novel | c.121G>A | p.Ala41Thr | p.A41T | Q13554 | protein_coding | deleterious_low_confidence(0) | probably_damaging(0.999) | TCGA-A7-A56D-01 | Breast | breast invasive carcinoma | Female | >=65 | I/II | Hormone Therapy | arimidex | SD |
| CAMK2B | SNV | Missense_Mutation | novel | c.1639N>A | p.Glu547Lys | p.E547K | Q13554 | protein_coding | deleterious_low_confidence(0) | probably_damaging(0.997) | TCGA-JL-A3YW-01 | Breast | breast invasive carcinoma | Female | <65 | I/II | Unknown | Unknown | SD |
| CAMK2B | SNV | Missense_Mutation | rs773190468 | c.1882G>A | p.Gly628Arg | p.G628R | Q13554 | protein_coding | tolerated_low_confidence(0.21) | possibly_damaging(0.834) | TCGA-S3-A6ZF-01 | Breast | breast invasive carcinoma | Female | <65 | I/II | Chemotherapy | taxotere | CR |
| CAMK2B | SNV | Missense_Mutation | novel | c.1309N>A | p.Pro437Thr | p.P437T | Q13554 | protein_coding | tolerated_low_confidence(0.47) | benign(0.027) | TCGA-UU-A93S-01 | Breast | breast invasive carcinoma | Female | <65 | III/IV | Unknown | Unknown | PD |
| CAMK2B | insertion | Nonsense_Mutation | novel | c.716_717insAGGCATTAGAGGGTAGAGGTGAT | p.Asp239GlufsTer6 | p.D239Efs*6 | Q13554 | protein_coding | TCGA-A2-A0CP-01 | Breast | breast invasive carcinoma | Female | <65 | I/II | Chemotherapy | cytoxan | SD | ||
| CAMK2B | SNV | Missense_Mutation | rs758417712 | c.196N>T | p.Arg66Cys | p.R66C | Q13554 | protein_coding | deleterious_low_confidence(0) | probably_damaging(0.995) | TCGA-DS-A7WF-01 | Cervix | cervical & endocervical cancer | Female | <65 | I/II | Chemotherapy | cisplatin | PD |
| CAMK2B | SNV | Missense_Mutation | c.452N>A | p.Ala151Asp | p.A151D | Q13554 | protein_coding | deleterious_low_confidence(0) | probably_damaging(1) | TCGA-FU-A5XV-01 | Cervix | cervical & endocervical cancer | Female | <65 | III/IV | Unknown | Unknown | SD | |
| CAMK2B | SNV | Missense_Mutation | novel | c.328N>A | p.Glu110Lys | p.E110K | Q13554 | protein_coding | deleterious_low_confidence(0) | probably_damaging(0.933) | TCGA-VS-A954-01 | Cervix | cervical & endocervical cancer | Female | >=65 | III/IV | Chemotherapy | cisplatin | CR |
| CAMK2B | SNV | Missense_Mutation | rs773875653 | c.1400N>G | p.Glu467Gly | p.E467G | Q13554 | protein_coding | tolerated_low_confidence(0.28) | benign(0.007) | TCGA-5M-AAT6-01 | Colorectum | colon adenocarcinoma | Female | <65 | III/IV | Unknown | Unknown | PD |
| CAMK2B | SNV | Missense_Mutation | rs757820225 | c.1843N>A | p.Ala615Thr | p.A615T | Q13554 | protein_coding | deleterious_low_confidence(0) | probably_damaging(0.999) | TCGA-A6-6780-01 | Colorectum | colon adenocarcinoma | Male | >=65 | I/II | Unknown | Unknown | SD |
| Page: 1 2 3 4 5 6 7 |
Top |
Related drugs of malignant transformation related genes |
| Identification of chemicals and drugs interact with genes involved in malignant transfromation |
| (DGIdb 4.0) |
| Entrez ID | Symbol | Category | Interaction Types | Drug Claim Name | Drug Name | PMIDs |
| 816 | CAMK2B | DRUGGABLE GENOME, KINASE, SERINE THREONINE KINASE, ENZYME | TRIFLUOPERAZINE | TRIFLUOPERAZINE | 15845548 | |
| 816 | CAMK2B | DRUGGABLE GENOME, KINASE, SERINE THREONINE KINASE, ENZYME | TAE-684 | TAE-684 | ||
| 816 | CAMK2B | DRUGGABLE GENOME, KINASE, SERINE THREONINE KINASE, ENZYME | GSK-269962A | GSK-269962A | ||
| 816 | CAMK2B | DRUGGABLE GENOME, KINASE, SERINE THREONINE KINASE, ENZYME | HYDROGEN PEROXIDE | 15304367 | ||
| 816 | CAMK2B | DRUGGABLE GENOME, KINASE, SERINE THREONINE KINASE, ENZYME | LINIFANIB | LINIFANIB | ||
| 816 | CAMK2B | DRUGGABLE GENOME, KINASE, SERINE THREONINE KINASE, ENZYME | inhibitor | 135652717 | STAUROSPORINE | |
| 816 | CAMK2B | DRUGGABLE GENOME, KINASE, SERINE THREONINE KINASE, ENZYME | SOTRASTAURIN | SOTRASTAURIN | ||
| 816 | CAMK2B | DRUGGABLE GENOME, KINASE, SERINE THREONINE KINASE, ENZYME | IONOMYCIN | IONOMYCIN | 12193581,15845548 | |
| 816 | CAMK2B | DRUGGABLE GENOME, KINASE, SERINE THREONINE KINASE, ENZYME | VASOPRESSIN | VASOPRESSIN | 15845548 | |
| 816 | CAMK2B | DRUGGABLE GENOME, KINASE, SERINE THREONINE KINASE, ENZYME | CEDIRANIB | CEDIRANIB |
| Page: 1 2 3 |

Copyright 2023-Present -The University of Texas Health Science Center at Houston |