| Tissue | Expression Dynamics | Abbreviation |
| Cervix |  | CC: Cervix cancer |
| HSIL_HPV: HPV-infected high-grade squamous intraepithelial lesions |
| N_HPV: HPV-infected normal cervix |
| Colorectum (GSE201348) |  | FAP: Familial adenomatous polyposis |
| CRC: Colorectal cancer |
| Colorectum (HTA11) |  | AD: Adenomas |
| SER: Sessile serrated lesions |
| MSI-H: Microsatellite-high colorectal cancer |
| MSS: Microsatellite stable colorectal cancer |
| Endometrium | 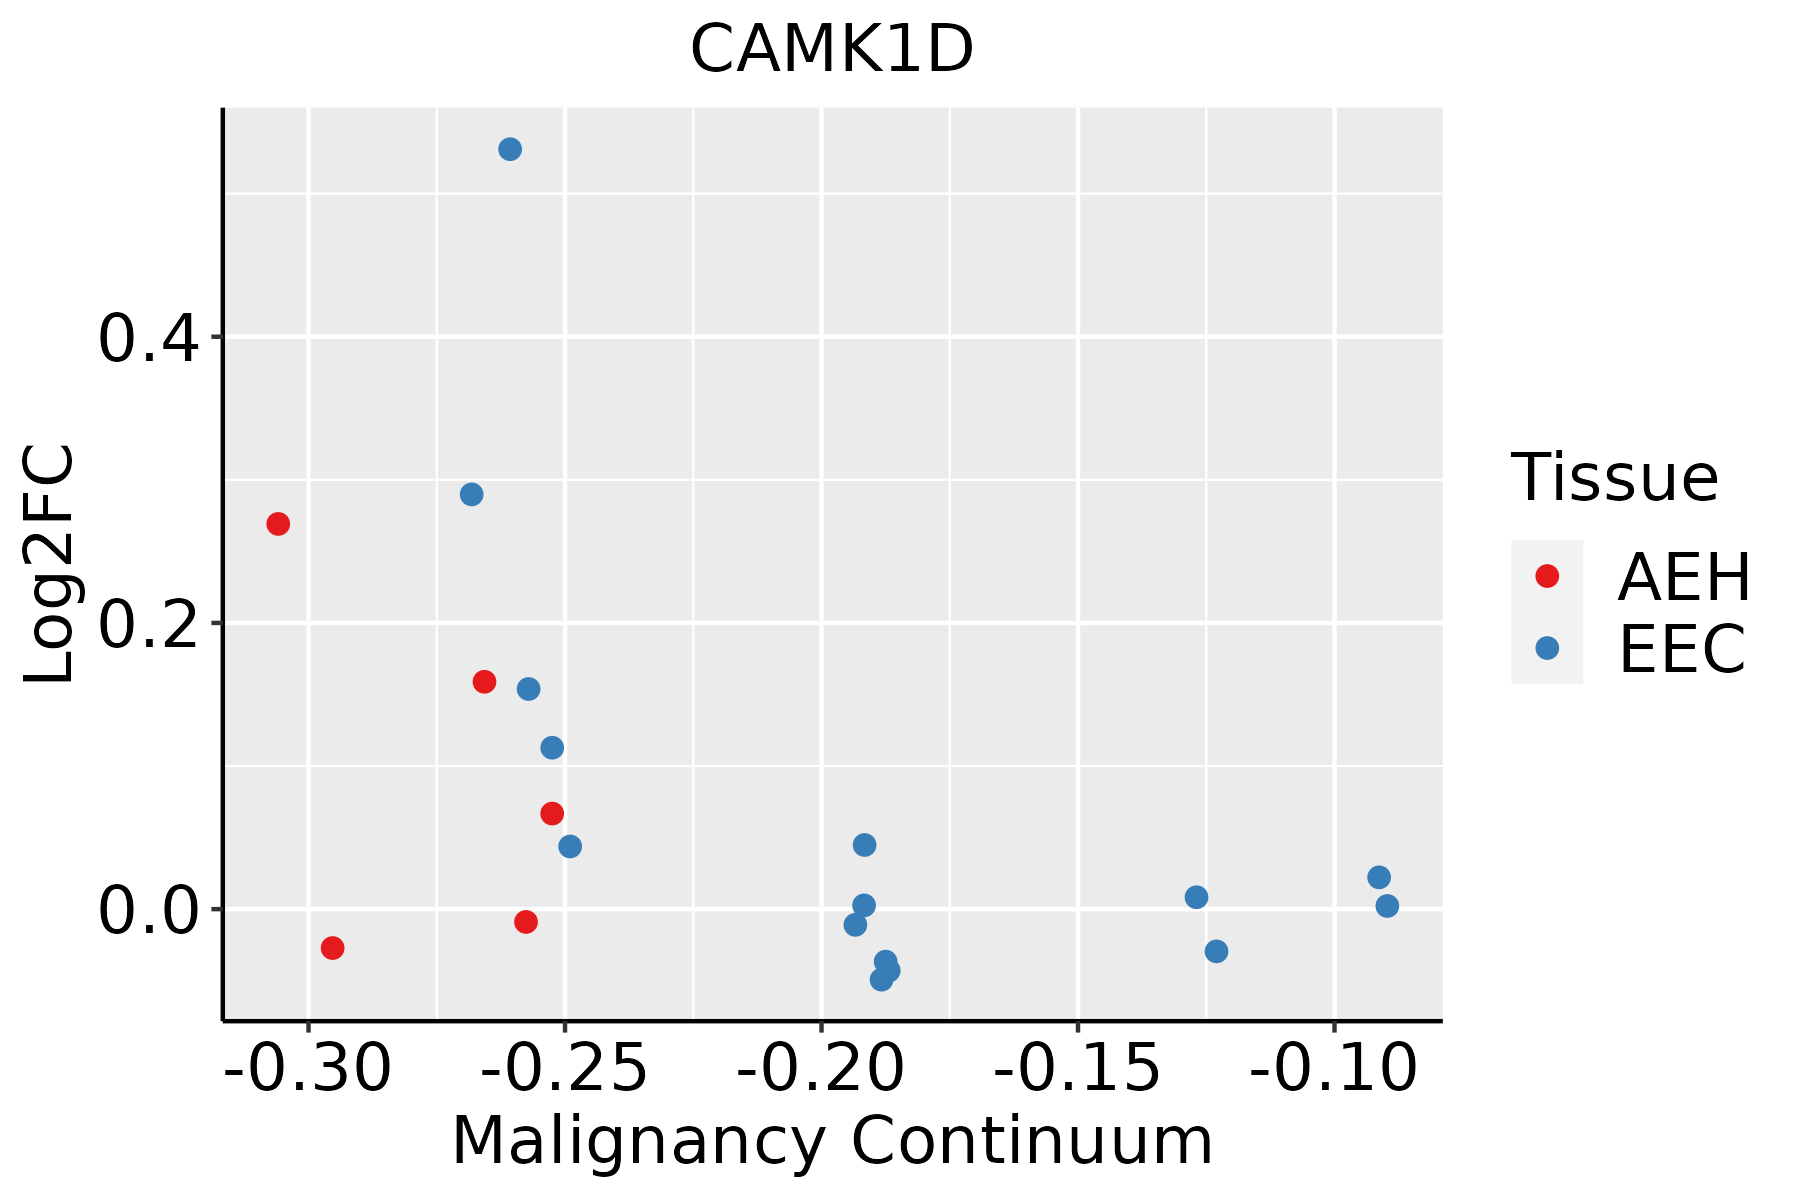 | AEH: Atypical endometrial hyperplasia |
| EEC: Endometrioid Cancer |
| Esophagus | 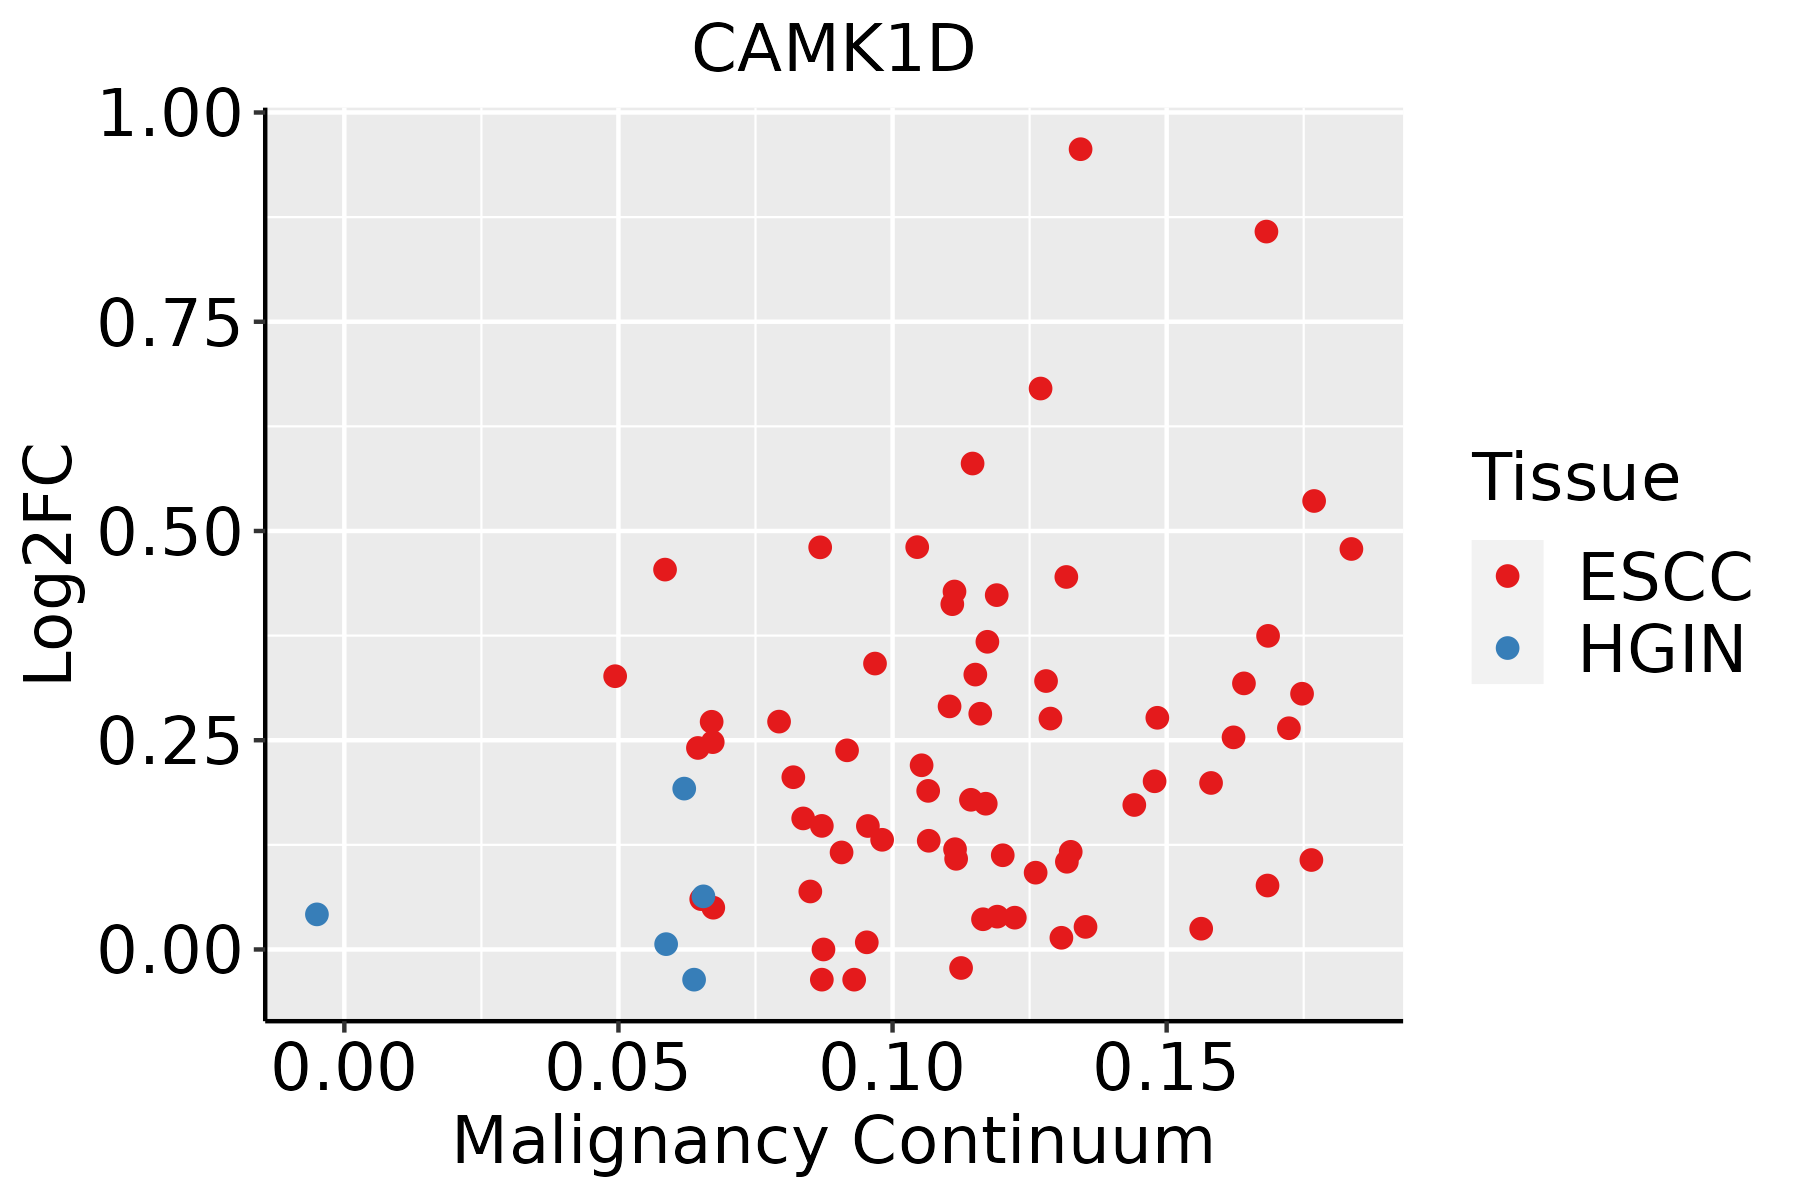 | ESCC: Esophageal squamous cell carcinoma |
| HGIN: High-grade intraepithelial neoplasias |
| LGIN: Low-grade intraepithelial neoplasias |
| Liver | 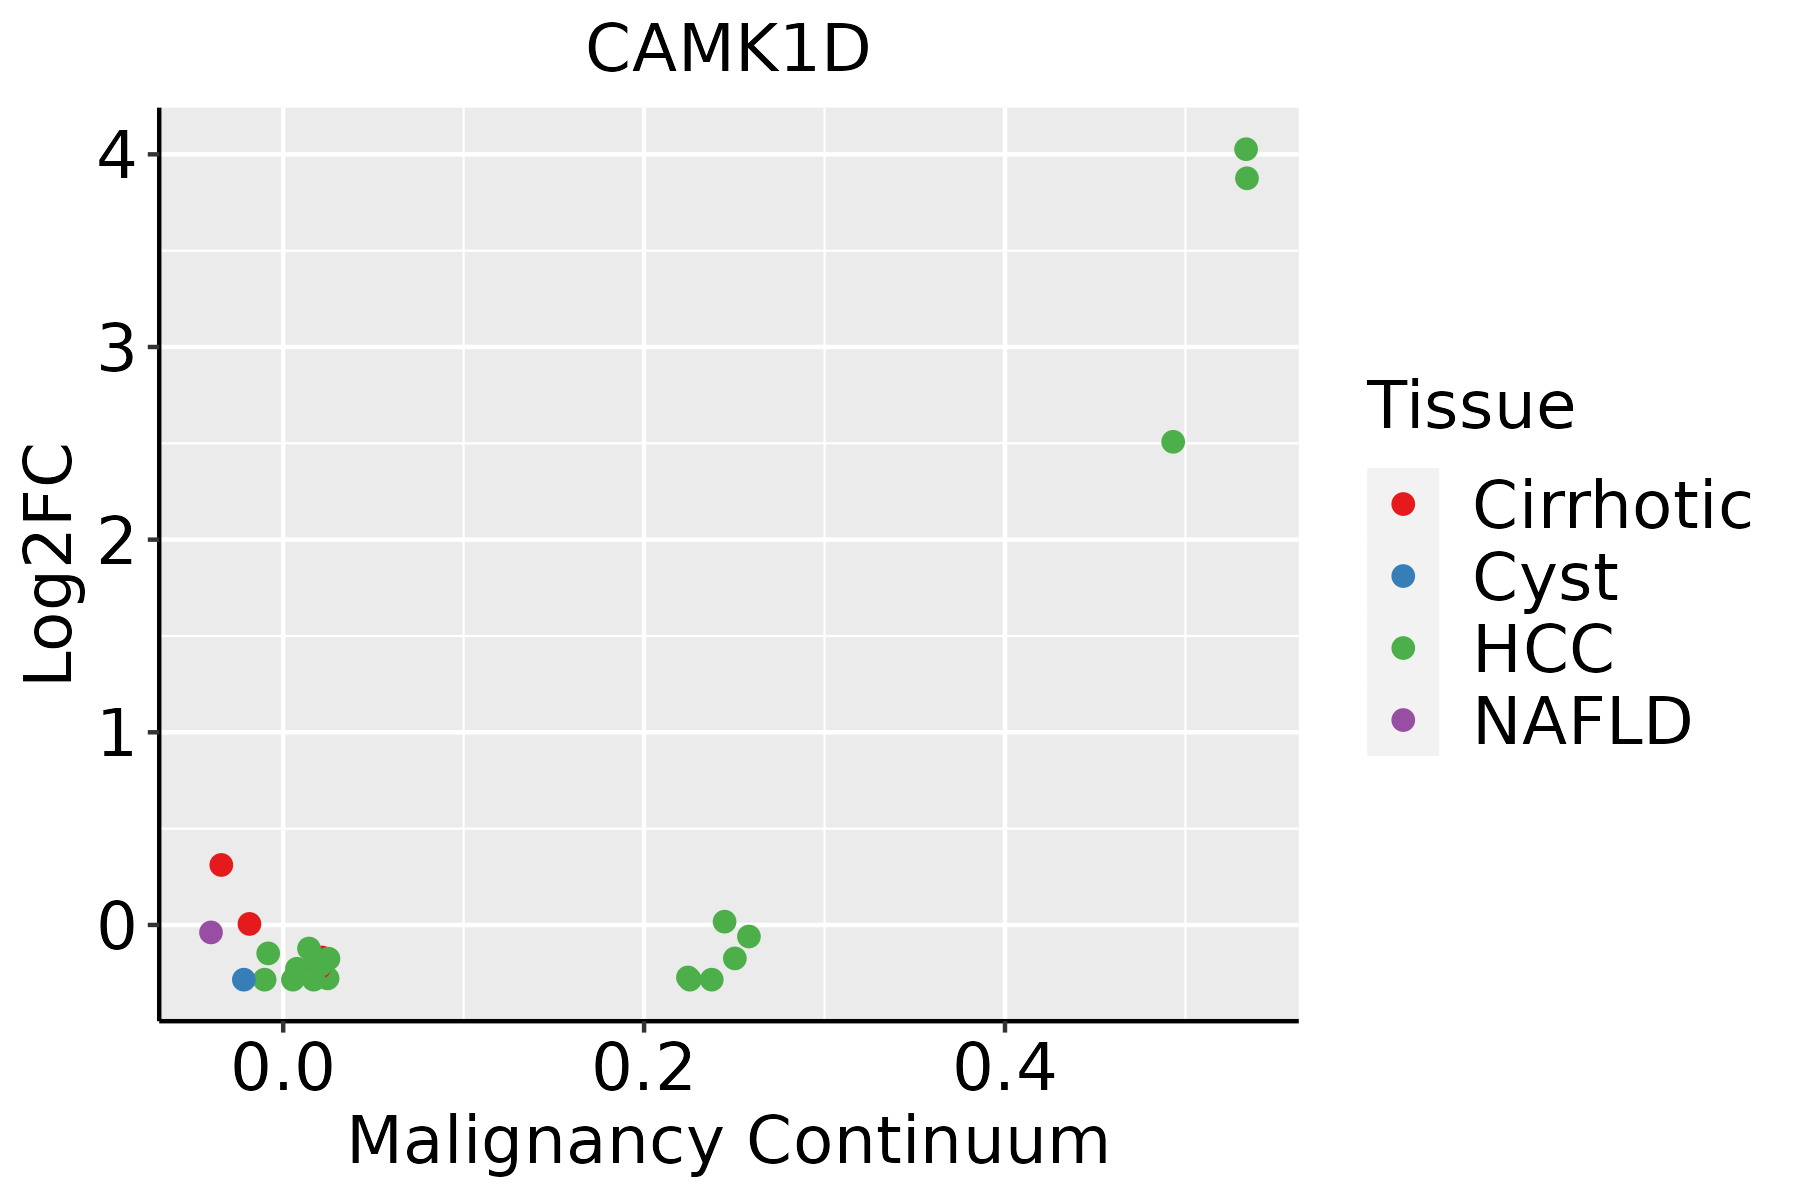 | HCC: Hepatocellular carcinoma |
| NAFLD: Non-alcoholic fatty liver disease |
| Lung | 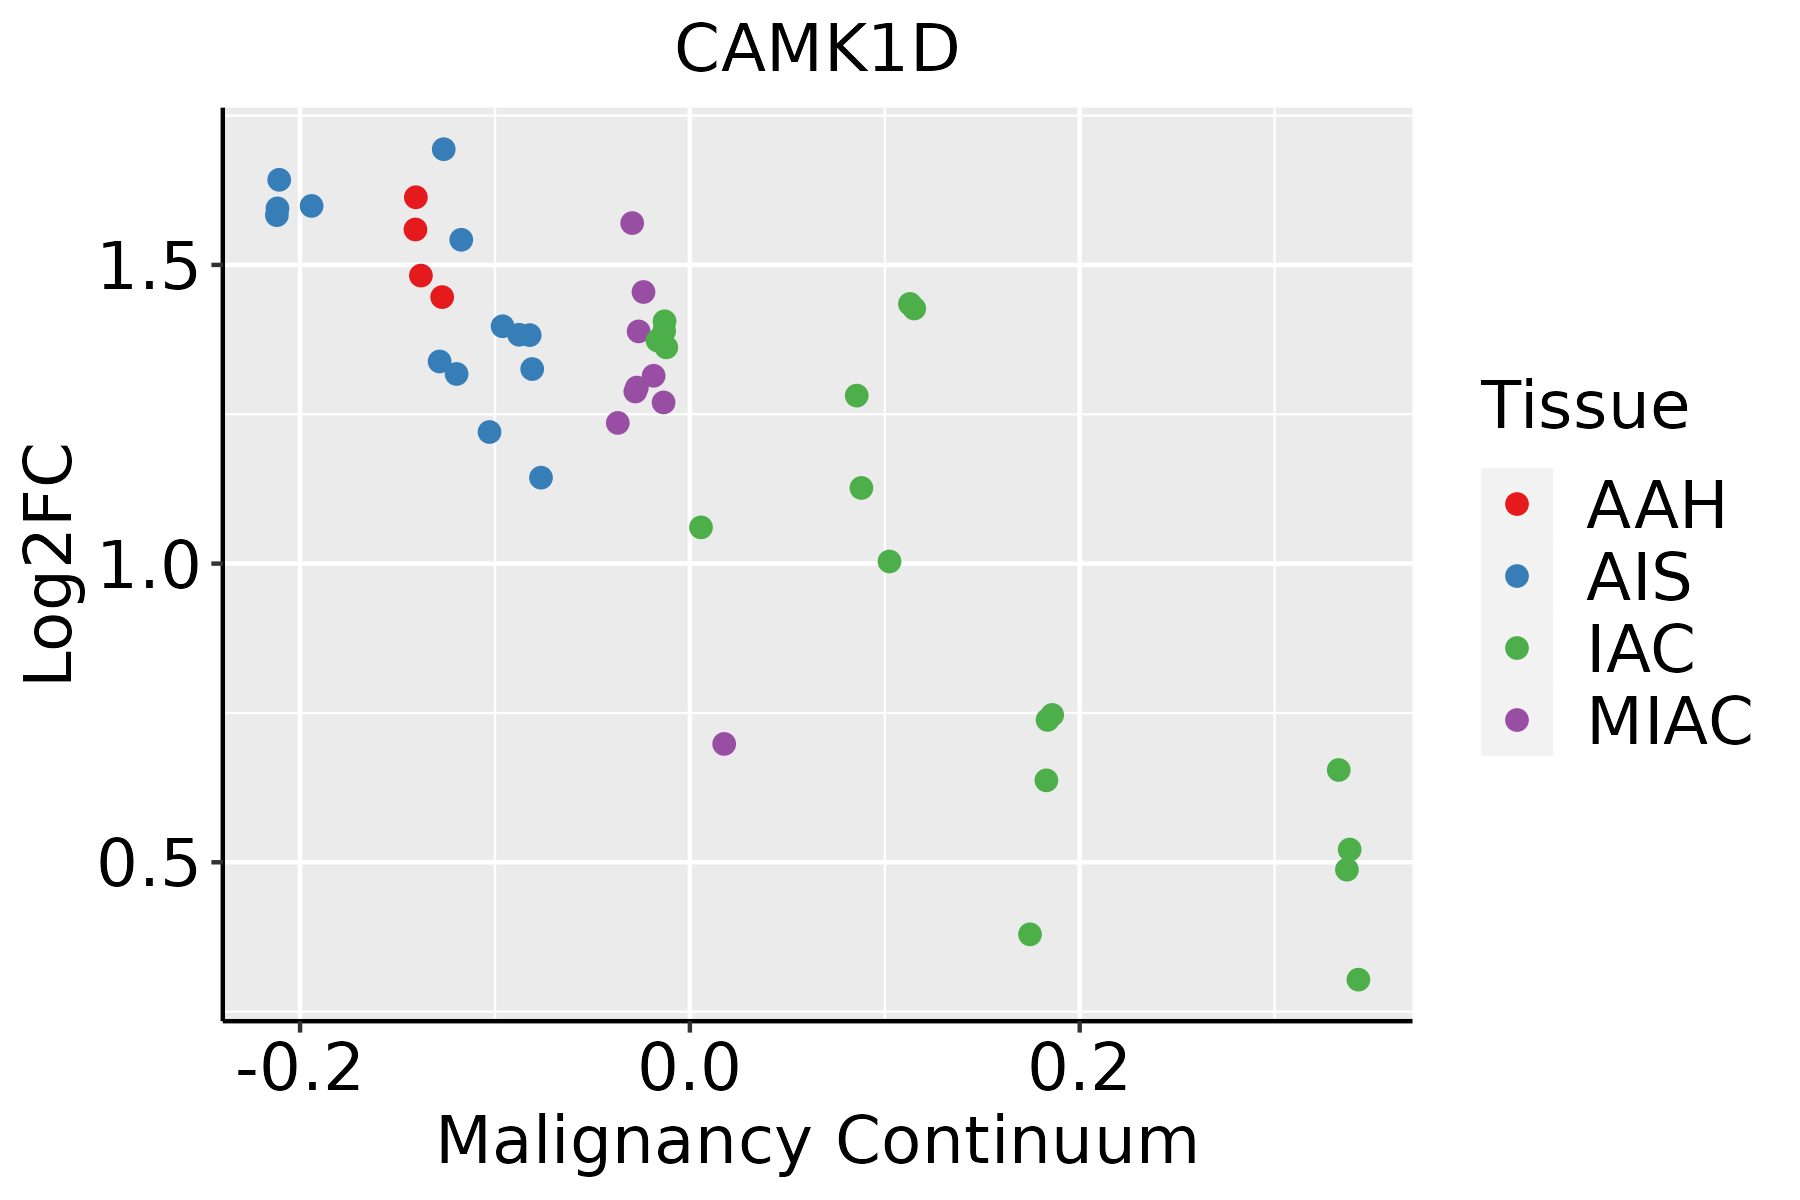 | AAH: Atypical adenomatous hyperplasia |
| AIS: Adenocarcinoma in situ |
| IAC: Invasive lung adenocarcinoma |
| MIA: Minimally invasive adenocarcinoma |
| Oral Cavity | 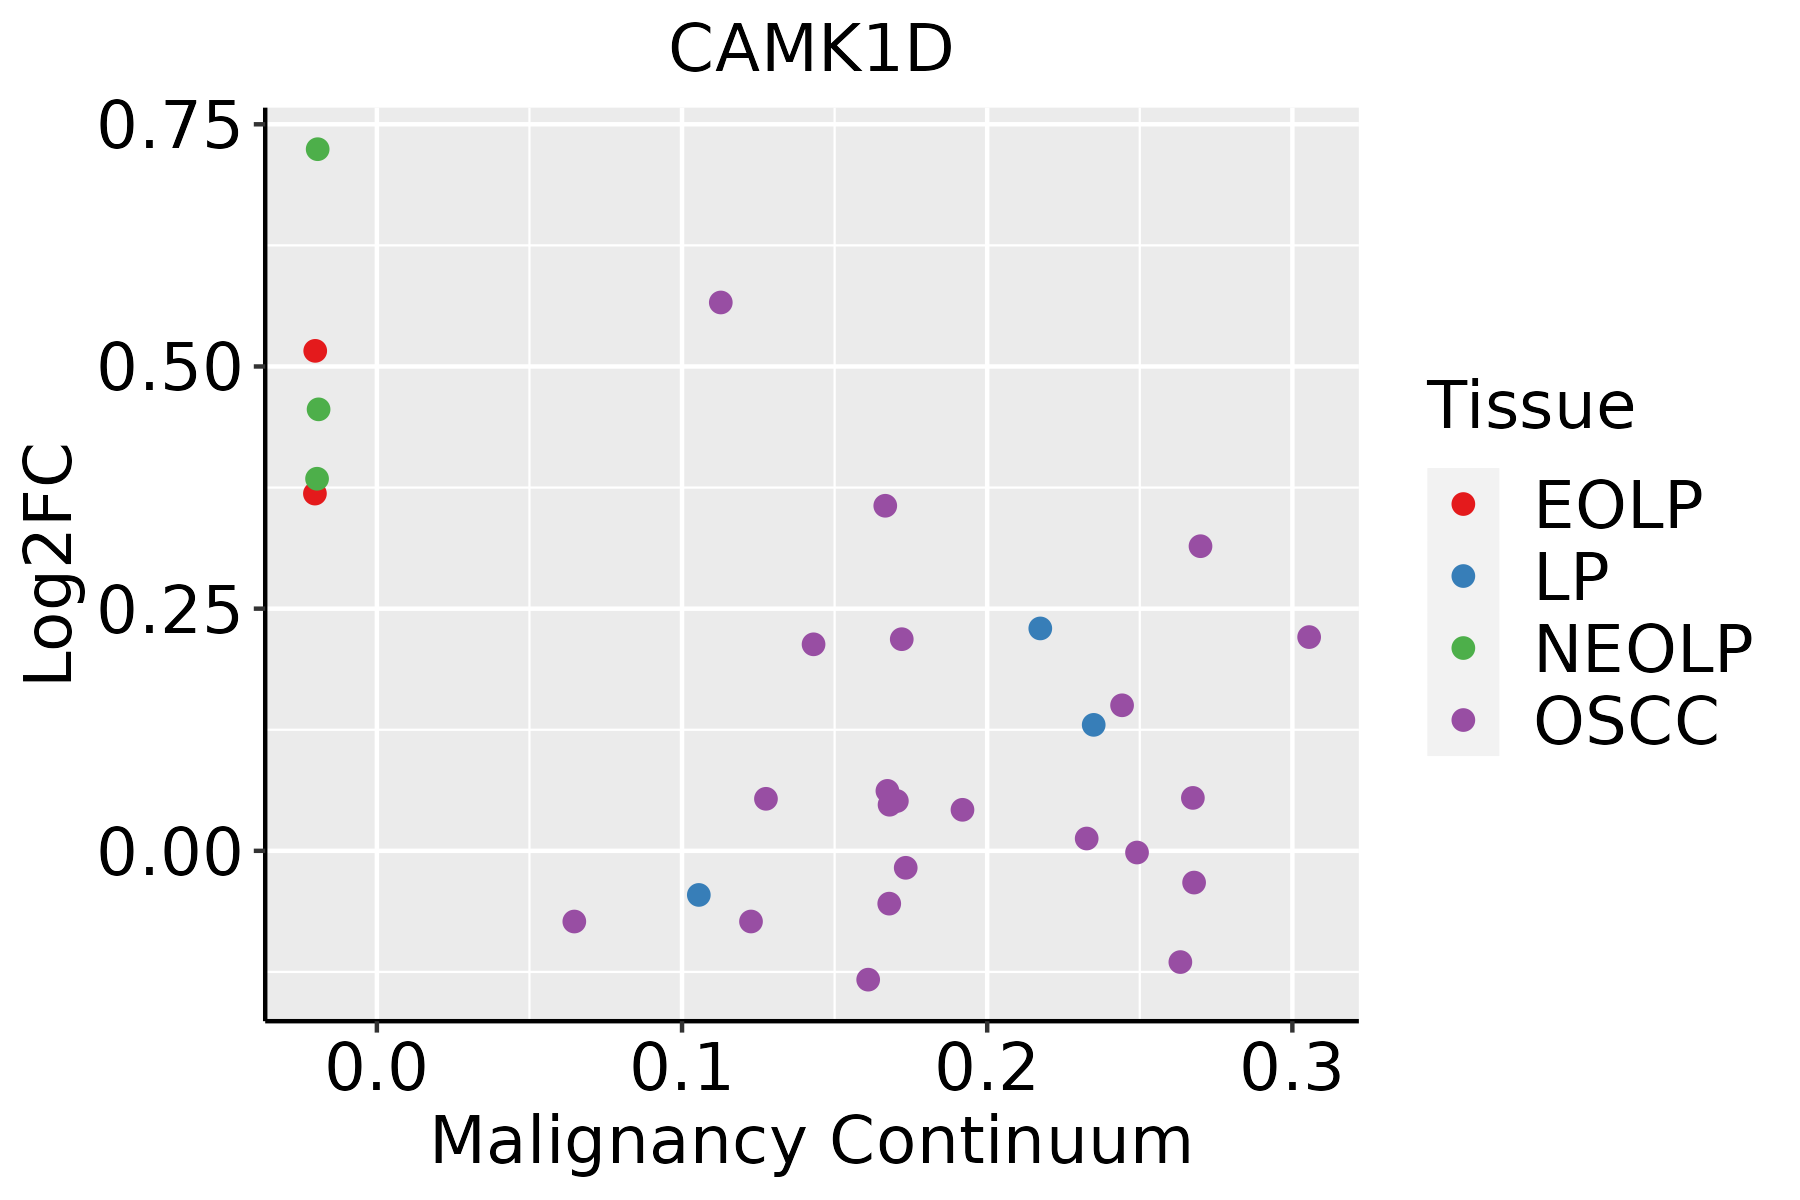 | EOLP: Erosive Oral lichen planus |
| LP: leukoplakia |
| NEOLP: Non-erosive oral lichen planus |
| OSCC: Oral squamous cell carcinoma |
| Skin | 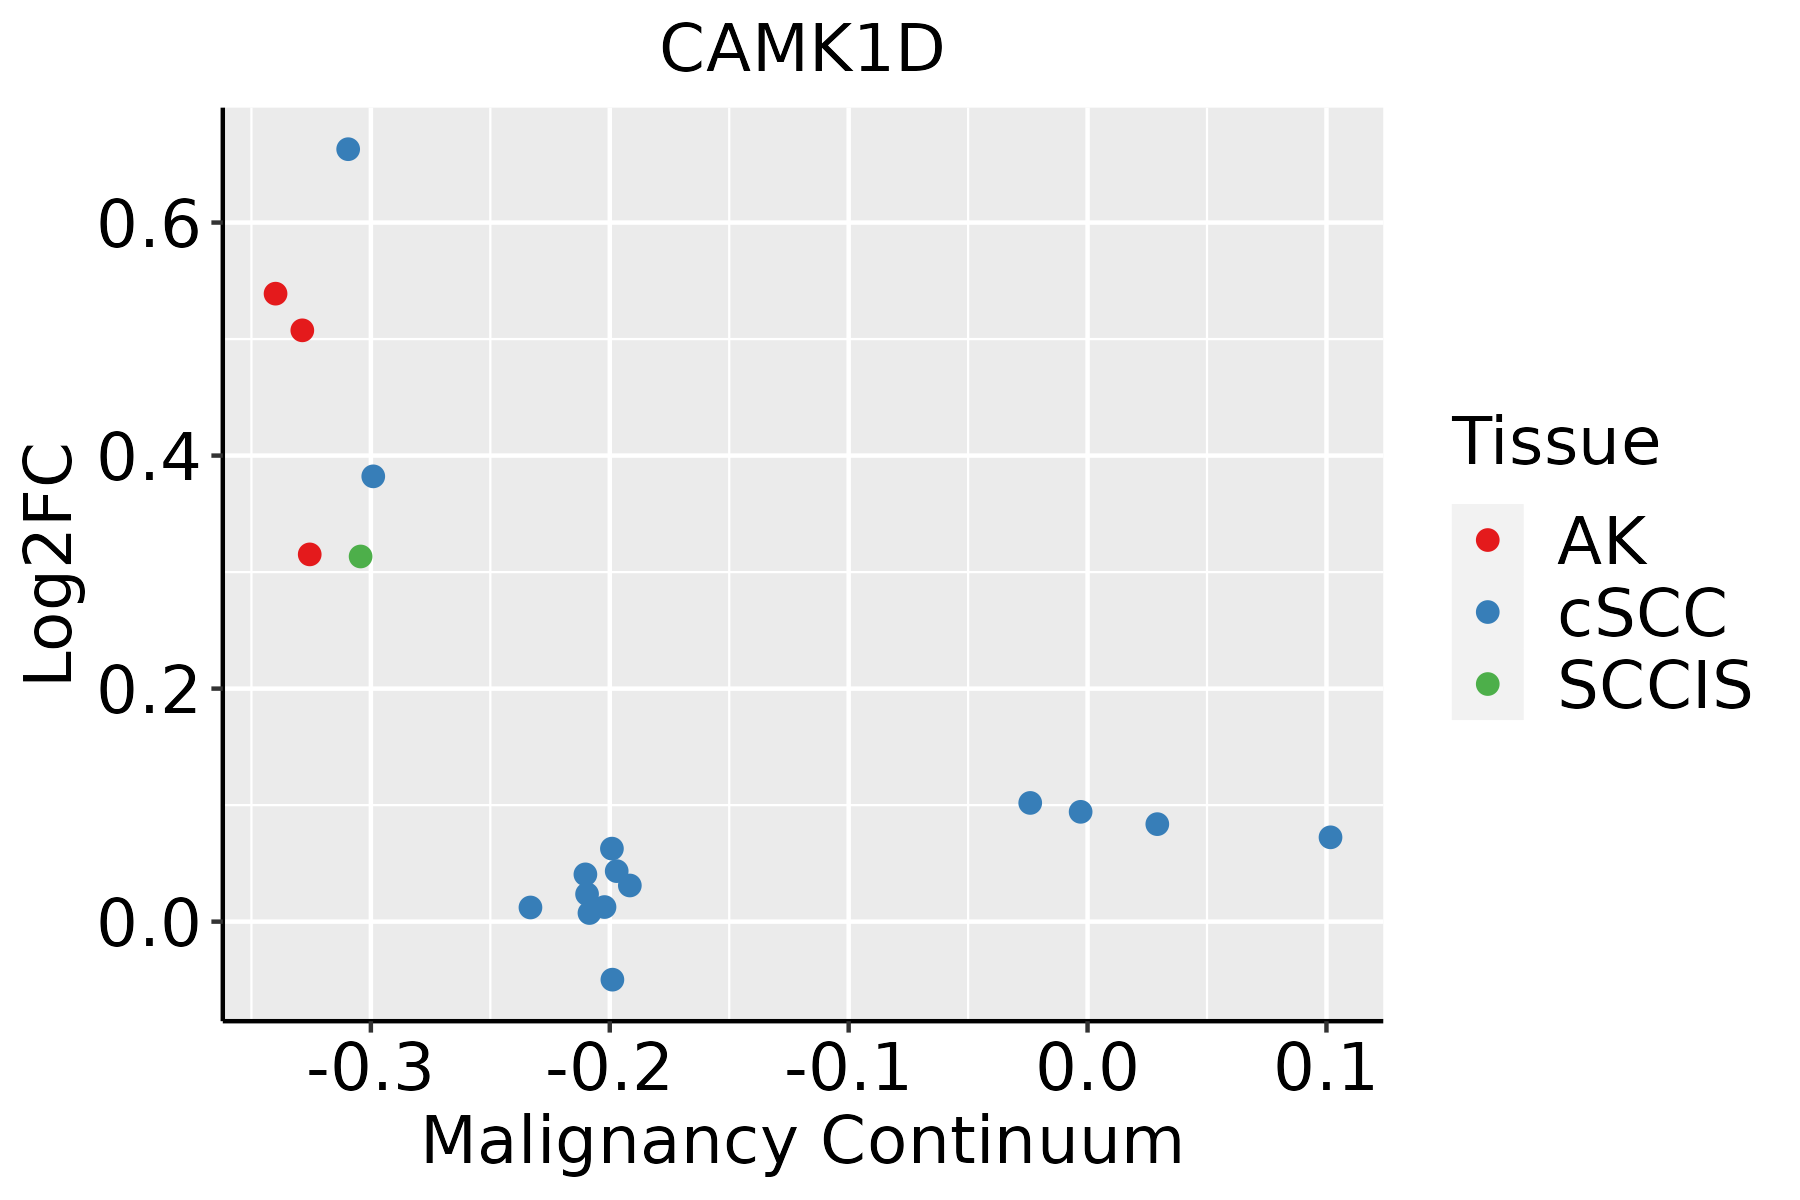 | AK: Actinic keratosis |
| cSCC: Cutaneous squamous cell carcinoma |
| SCCIS:squamous cell carcinoma in situ |
| Thyroid | 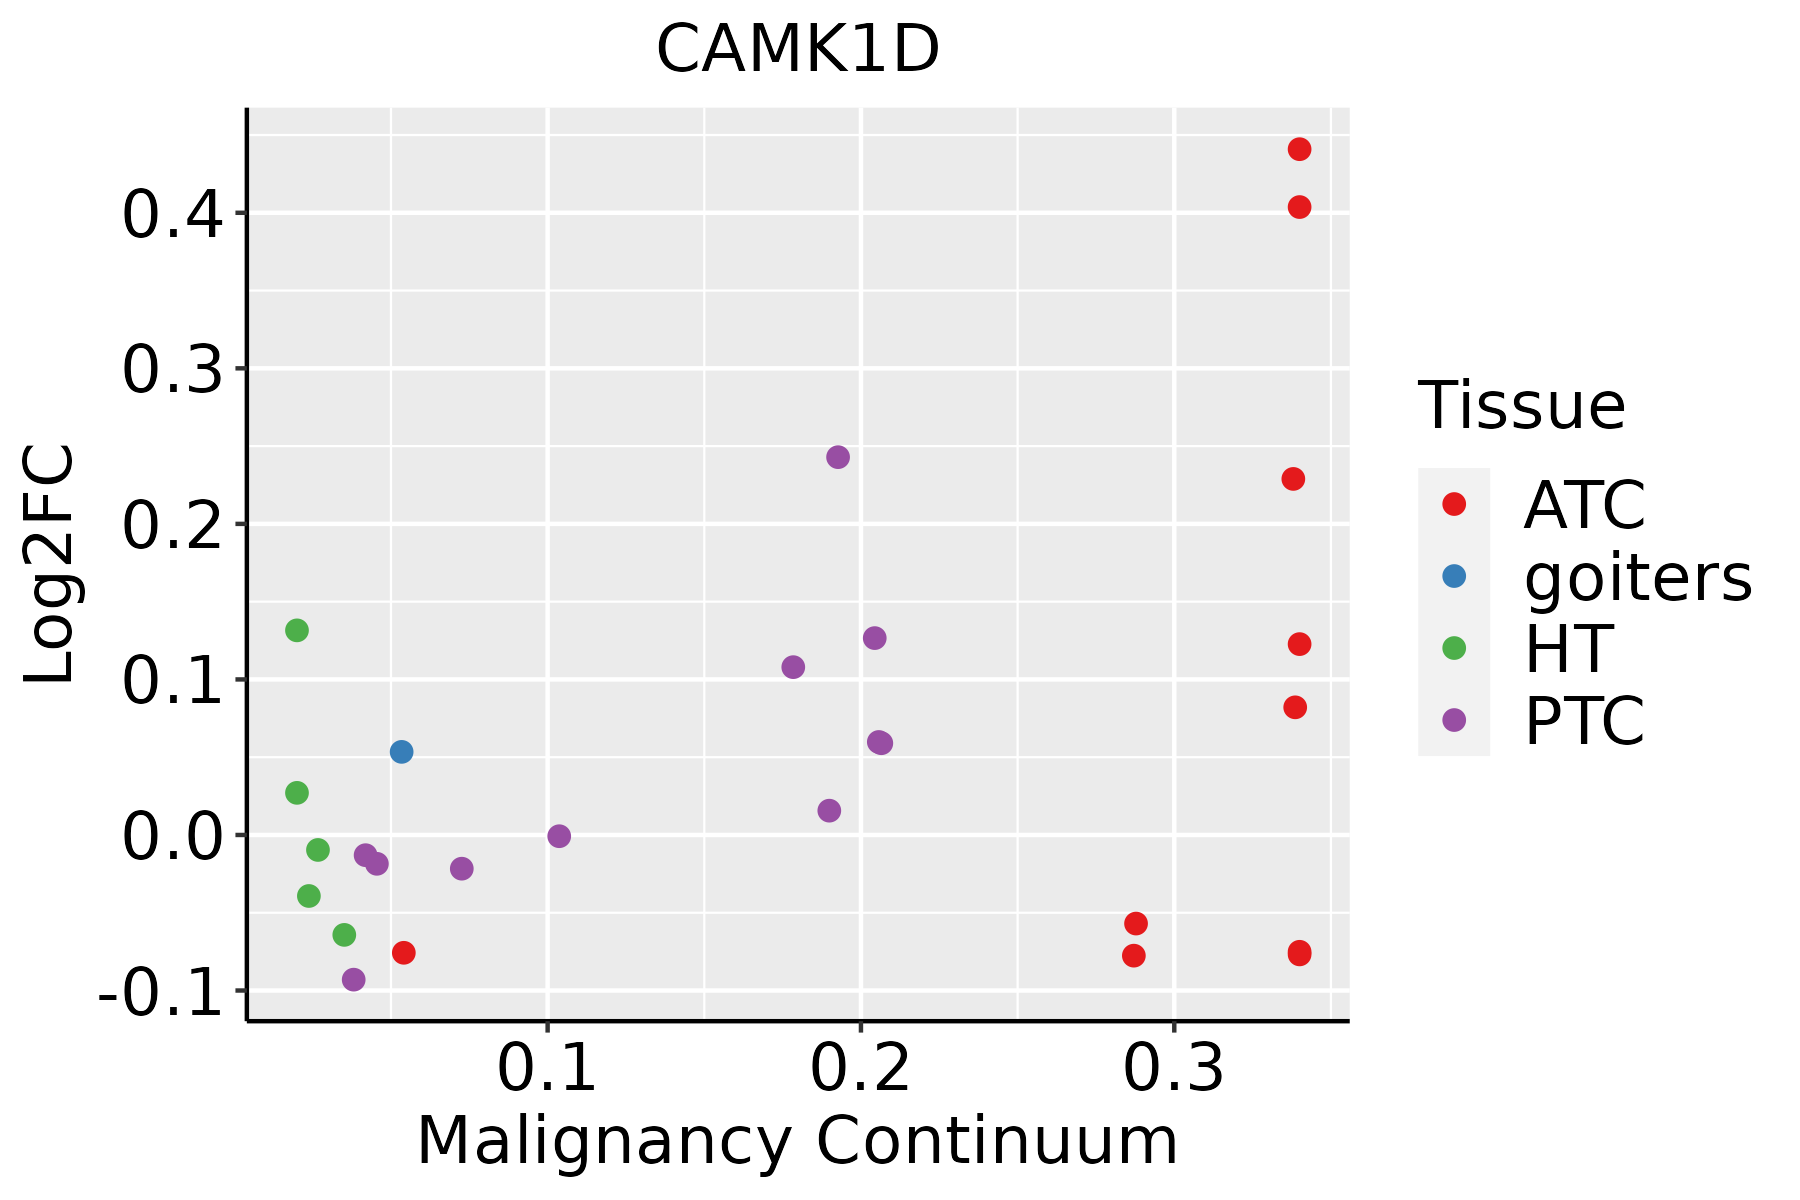 | ATC: Anaplastic thyroid cancer |
| HT: Hashimoto's thyroiditis |
| PTC: Papillary thyroid cancer |
| GO ID | Tissue | Disease Stage | Description | Gene Ratio | Bg Ratio | pvalue | p.adjust | Count |
| GO:00321035 | Cervix | CC | positive regulation of response to external stimulus | 95/2311 | 427/18723 | 5.44e-09 | 5.03e-07 | 95 |
| GO:00603267 | Cervix | CC | cell chemotaxis | 73/2311 | 310/18723 | 2.82e-08 | 1.96e-06 | 73 |
| GO:00975298 | Cervix | CC | myeloid leukocyte migration | 56/2311 | 220/18723 | 7.21e-08 | 4.15e-06 | 56 |
| GO:00305957 | Cervix | CC | leukocyte chemotaxis | 57/2311 | 230/18723 | 1.48e-07 | 7.07e-06 | 57 |
| GO:00716218 | Cervix | CC | granulocyte chemotaxis | 37/2311 | 125/18723 | 2.16e-07 | 9.56e-06 | 37 |
| GO:00163587 | Cervix | CC | dendrite development | 58/2311 | 243/18723 | 4.52e-07 | 1.76e-05 | 58 |
| GO:00509007 | Cervix | CC | leukocyte migration | 78/2311 | 369/18723 | 1.09e-06 | 3.80e-05 | 78 |
| GO:00975308 | Cervix | CC | granulocyte migration | 39/2311 | 148/18723 | 2.67e-06 | 7.87e-05 | 39 |
| GO:00026857 | Cervix | CC | regulation of leukocyte migration | 50/2311 | 210/18723 | 2.95e-06 | 8.31e-05 | 50 |
| GO:00026888 | Cervix | CC | regulation of leukocyte chemotaxis | 34/2311 | 122/18723 | 3.00e-06 | 8.38e-05 | 34 |
| GO:00305938 | Cervix | CC | neutrophil chemotaxis | 30/2311 | 103/18723 | 4.24e-06 | 1.09e-04 | 30 |
| GO:00109757 | Cervix | CC | regulation of neuron projection development | 88/2311 | 445/18723 | 4.26e-06 | 1.09e-04 | 88 |
| GO:00510904 | Cervix | CC | regulation of DNA-binding transcription factor activity | 87/2311 | 440/18723 | 4.85e-06 | 1.22e-04 | 87 |
| GO:00509203 | Cervix | CC | regulation of chemotaxis | 51/2311 | 223/18723 | 8.03e-06 | 1.86e-04 | 51 |
| GO:00313467 | Cervix | CC | positive regulation of cell projection organization | 72/2311 | 353/18723 | 1.04e-05 | 2.32e-04 | 72 |
| GO:00026878 | Cervix | CC | positive regulation of leukocyte migration | 35/2311 | 135/18723 | 1.25e-05 | 2.60e-04 | 35 |
| GO:19902666 | Cervix | CC | neutrophil migration | 32/2311 | 122/18723 | 2.25e-05 | 4.00e-04 | 32 |
| GO:00026906 | Cervix | CC | positive regulation of leukocyte chemotaxis | 26/2311 | 94/18723 | 4.85e-05 | 7.34e-04 | 26 |
| GO:00181057 | Cervix | CC | peptidyl-serine phosphorylation | 63/2311 | 315/18723 | 6.65e-05 | 9.47e-04 | 63 |
| GO:00457306 | Cervix | CC | respiratory burst | 14/2311 | 37/18723 | 6.97e-05 | 9.81e-04 | 14 |
| Pathway ID | Tissue | Disease Stage | Description | Gene Ratio | Bg Ratio | pvalue | p.adjust | qvalue | Count |
| hsa052148 | Cervix | CC | Glioma | 24/1267 | 75/8465 | 1.51e-04 | 9.20e-04 | 5.44e-04 | 24 |
| hsa049218 | Cervix | CC | Oxytocin signaling pathway | 34/1267 | 154/8465 | 1.12e-02 | 3.42e-02 | 2.02e-02 | 34 |
| hsa0521414 | Cervix | CC | Glioma | 24/1267 | 75/8465 | 1.51e-04 | 9.20e-04 | 5.44e-04 | 24 |
| hsa0492111 | Cervix | CC | Oxytocin signaling pathway | 34/1267 | 154/8465 | 1.12e-02 | 3.42e-02 | 2.02e-02 | 34 |
| hsa04925 | Colorectum | FAP | Aldosterone synthesis and secretion | 25/1404 | 98/8465 | 1.55e-02 | 4.99e-02 | 3.04e-02 | 25 |
| hsa049251 | Colorectum | FAP | Aldosterone synthesis and secretion | 25/1404 | 98/8465 | 1.55e-02 | 4.99e-02 | 3.04e-02 | 25 |
| hsa049252 | Colorectum | CRC | Aldosterone synthesis and secretion | 22/1091 | 98/8465 | 5.92e-03 | 3.00e-02 | 2.03e-02 | 22 |
| hsa049253 | Colorectum | CRC | Aldosterone synthesis and secretion | 22/1091 | 98/8465 | 5.92e-03 | 3.00e-02 | 2.03e-02 | 22 |
| hsa0521417 | Esophagus | ESCC | Glioma | 52/4205 | 75/8465 | 4.20e-04 | 1.45e-03 | 7.43e-04 | 52 |
| hsa0521418 | Esophagus | ESCC | Glioma | 52/4205 | 75/8465 | 4.20e-04 | 1.45e-03 | 7.43e-04 | 52 |
| hsa052142 | Liver | HCC | Glioma | 47/4020 | 75/8465 | 5.67e-03 | 1.62e-02 | 9.02e-03 | 47 |
| hsa0521411 | Liver | HCC | Glioma | 47/4020 | 75/8465 | 5.67e-03 | 1.62e-02 | 9.02e-03 | 47 |
| hsa04921 | Lung | IAC | Oxytocin signaling pathway | 33/1053 | 154/8465 | 1.09e-03 | 7.82e-03 | 5.19e-03 | 33 |
| hsa052146 | Lung | IAC | Glioma | 18/1053 | 75/8465 | 4.07e-03 | 1.94e-02 | 1.29e-02 | 18 |
| hsa049211 | Lung | IAC | Oxytocin signaling pathway | 33/1053 | 154/8465 | 1.09e-03 | 7.82e-03 | 5.19e-03 | 33 |
| hsa0521412 | Lung | IAC | Glioma | 18/1053 | 75/8465 | 4.07e-03 | 1.94e-02 | 1.29e-02 | 18 |
| hsa0521421 | Lung | AIS | Glioma | 17/961 | 75/8465 | 3.76e-03 | 2.00e-02 | 1.28e-02 | 17 |
| hsa052143 | Lung | AIS | Glioma | 17/961 | 75/8465 | 3.76e-03 | 2.00e-02 | 1.28e-02 | 17 |
| hsa049214 | Lung | AAH | Oxytocin signaling pathway | 17/348 | 154/8465 | 1.87e-04 | 8.70e-03 | 6.99e-03 | 17 |
| hsa049215 | Lung | AAH | Oxytocin signaling pathway | 17/348 | 154/8465 | 1.87e-04 | 8.70e-03 | 6.99e-03 | 17 |
| Hugo Symbol | Variant Class | Variant Classification | dbSNP RS | HGVSc | HGVSp | HGVSp Short | SWISSPROT | BIOTYPE | SIFT | PolyPhen | Tumor Sample Barcode | Tissue | Histology | Sex | Age | Stage | Therapy Types | Drugs | Outcome |
| CAMK1D | SNV | Missense_Mutation | novel | c.343N>G | p.Phe115Val | p.F115V | Q8IU85 | protein_coding | tolerated(0.51) | probably_damaging(0.999) | TCGA-A2-A04T-01 | Breast | breast invasive carcinoma | Female | <65 | I/II | Chemotherapy | cyclophosphamide | SD |
| CAMK1D | SNV | Missense_Mutation | novel | c.691N>C | p.Glu231Gln | p.E231Q | Q8IU85 | protein_coding | tolerated(0.12) | probably_damaging(0.922) | TCGA-A2-A0CO-01 | Breast | breast invasive carcinoma | Female | >=65 | I/II | Hormone Therapy | tamoxiphen | CR |
| CAMK1D | insertion | Frame_Shift_Ins | novel | c.194_195insGAAATGGAAA | p.Ser65ArgfsTer8 | p.S65Rfs*8 | Q8IU85 | protein_coding | | | TCGA-A2-A04Y-01 | Breast | breast invasive carcinoma | Female | <65 | I/II | Chemotherapy | cytoxan | SD |
| CAMK1D | insertion | Frame_Shift_Ins | novel | c.196_197insAATGTGAATTTTCTCT | p.Ile66LysfsTer9 | p.I66Kfs*9 | Q8IU85 | protein_coding | | | TCGA-A2-A04Y-01 | Breast | breast invasive carcinoma | Female | <65 | I/II | Chemotherapy | cytoxan | SD |
| CAMK1D | insertion | Nonsense_Mutation | novel | c.205_206insTGTGTGGCAAGTGGTACCGGGAGGTGGCCTAACCGTGTTGACCTCC | p.Glu69ValfsTer11 | p.E69Vfs*11 | Q8IU85 | protein_coding | | | TCGA-A8-A097-01 | Breast | breast invasive carcinoma | Female | >=65 | I/II | Hormone Therapy | tamoxiphen | SD |
| CAMK1D | insertion | Nonsense_Mutation | novel | c.201_202insTCCAGTGTTTGCAGAGCGCTCTGAAATTTCCTCTAGATGAAA | p.Glu67_Asn68insSerSerValCysArgAlaLeuTerAsnPheLeuTerMetLys | p.E67_N68insSSVCRAL*NFL*MK | Q8IU85 | protein_coding | | | TCGA-A8-A0A1-01 | Breast | breast invasive carcinoma | Female | >=65 | I/II | Hormone Therapy | tamoxiphen | SD |
| CAMK1D | SNV | Missense_Mutation | rs752176853 | c.442N>A | p.Glu148Lys | p.E148K | Q8IU85 | protein_coding | deleterious(0.03) | benign(0.255) | TCGA-FU-A3HZ-01 | Cervix | cervical & endocervical cancer | Female | <65 | I/II | Chemotherapy | cisplatin | CR |
| CAMK1D | SNV | Missense_Mutation | | c.830N>A | p.Pro277Gln | p.P277Q | Q8IU85 | protein_coding | deleterious(0) | probably_damaging(0.965) | TCGA-A6-3809-01 | Colorectum | colon adenocarcinoma | Female | >=65 | I/II | Unknown | Unknown | SD |
| CAMK1D | SNV | Missense_Mutation | rs754487170 | c.938N>T | p.Thr313Met | p.T313M | Q8IU85 | protein_coding | deleterious(0) | probably_damaging(0.97) | TCGA-A6-6653-01 | Colorectum | colon adenocarcinoma | Male | >=65 | I/II | Unknown | Unknown | SD |
| CAMK1D | SNV | Missense_Mutation | | c.707N>T | p.Ala236Val | p.A236V | Q8IU85 | protein_coding | deleterious(0) | probably_damaging(1) | TCGA-AA-3713-01 | Colorectum | colon adenocarcinoma | Male | >=65 | III/IV | Chemotherapy | 5-fluorouracil | PR |
| Entrez ID | Symbol | Category | Interaction Types | Drug Claim Name | Drug Name | PMIDs |
| 57118 | CAMK1D | KINASE, SERINE THREONINE KINASE, TRANSCRIPTION FACTOR, ENZYME, DRUGGABLE GENOME | | losartan | LOSARTAN | 25410890 |
| 57118 | CAMK1D | KINASE, SERINE THREONINE KINASE, TRANSCRIPTION FACTOR, ENZYME, DRUGGABLE GENOME | | ENTRECTINIB | ENTRECTINIB | |
| 57118 | CAMK1D | KINASE, SERINE THREONINE KINASE, TRANSCRIPTION FACTOR, ENZYME, DRUGGABLE GENOME | inhibitor | 178102336 | BOSUTINIB | |
| 57118 | CAMK1D | KINASE, SERINE THREONINE KINASE, TRANSCRIPTION FACTOR, ENZYME, DRUGGABLE GENOME | | TCMDC-125758 | CHEMBL546797 | |
| 57118 | CAMK1D | KINASE, SERINE THREONINE KINASE, TRANSCRIPTION FACTOR, ENZYME, DRUGGABLE GENOME | | ILORASERTIB | ILORASERTIB | |
| 57118 | CAMK1D | KINASE, SERINE THREONINE KINASE, TRANSCRIPTION FACTOR, ENZYME, DRUGGABLE GENOME | | RG-1530 | RG-1530 | |
| 57118 | CAMK1D | KINASE, SERINE THREONINE KINASE, TRANSCRIPTION FACTOR, ENZYME, DRUGGABLE GENOME | | TAE-684 | TAE-684 | |
| 57118 | CAMK1D | KINASE, SERINE THREONINE KINASE, TRANSCRIPTION FACTOR, ENZYME, DRUGGABLE GENOME | | 681640 | CHEMBL379975 | |
| 57118 | CAMK1D | KINASE, SERINE THREONINE KINASE, TRANSCRIPTION FACTOR, ENZYME, DRUGGABLE GENOME | | SOTRASTAURIN | SOTRASTAURIN | |


