
|
|||||
|
 | |
| |
| |
| |
| |
| |
|
Gene: CAMK1 |
Gene summary for CAMK1 |
| Gene information | Species | Human | Gene symbol | CAMK1 | Gene ID | 8536 |
| Gene name | calcium/calmodulin dependent protein kinase I | |
| Gene Alias | CAMKI | |
| Cytomap | 3p25.3 | |
| Gene Type | protein-coding | GO ID | GO:0000768 | UniProtAcc | B0YIY3 |
Top |
Malignant transformation analysis |
| Identification of the aberrant gene expression in precancerous and cancerous lesions by comparing the gene expression of stem-like cells in diseased tissues with normal stem cells |
| Entrez ID | Symbol | Replicates | Species | Organ | Tissue | Adj P-value | Log2FC | Malignancy |
| 8536 | CAMK1 | HCC1_Meng | Human | Liver | HCC | 4.83e-48 | 7.33e-02 | 0.0246 |
| 8536 | CAMK1 | Pt13.b | Human | Liver | HCC | 1.41e-13 | 3.10e-01 | 0.0251 |
| 8536 | CAMK1 | Pt14.b | Human | Liver | HCC | 3.96e-02 | 1.87e-01 | 0.018 |
| 8536 | CAMK1 | S014 | Human | Liver | HCC | 4.83e-28 | 1.02e+00 | 0.2254 |
| 8536 | CAMK1 | S015 | Human | Liver | HCC | 7.59e-23 | 9.75e-01 | 0.2375 |
| 8536 | CAMK1 | S016 | Human | Liver | HCC | 5.68e-33 | 1.02e+00 | 0.2243 |
| 8536 | CAMK1 | S027 | Human | Liver | HCC | 1.93e-15 | 1.07e+00 | 0.2446 |
| 8536 | CAMK1 | S028 | Human | Liver | HCC | 1.21e-28 | 1.31e+00 | 0.2503 |
| 8536 | CAMK1 | S029 | Human | Liver | HCC | 3.22e-28 | 1.47e+00 | 0.2581 |
| 8536 | CAMK1 | male-WTA | Human | Thyroid | PTC | 5.96e-08 | 1.16e-01 | 0.1037 |
| 8536 | CAMK1 | PTC01 | Human | Thyroid | PTC | 5.96e-08 | 1.92e-01 | 0.1899 |
| 8536 | CAMK1 | PTC04 | Human | Thyroid | PTC | 1.28e-08 | 2.51e-01 | 0.1927 |
| 8536 | CAMK1 | PTC05 | Human | Thyroid | PTC | 7.01e-07 | 3.67e-01 | 0.2065 |
| 8536 | CAMK1 | PTC06 | Human | Thyroid | PTC | 1.53e-17 | 4.65e-01 | 0.2057 |
| 8536 | CAMK1 | PTC07 | Human | Thyroid | PTC | 2.34e-18 | 3.57e-01 | 0.2044 |
| 8536 | CAMK1 | ATC11 | Human | Thyroid | ATC | 1.06e-03 | 5.26e-01 | 0.3386 |
| 8536 | CAMK1 | ATC13 | Human | Thyroid | ATC | 1.21e-24 | 4.92e-01 | 0.34 |
| 8536 | CAMK1 | ATC3 | Human | Thyroid | ATC | 5.09e-07 | 3.37e-01 | 0.338 |
| 8536 | CAMK1 | ATC5 | Human | Thyroid | ATC | 4.60e-30 | 5.24e-01 | 0.34 |
| Page: 1 |
| Tissue | Expression Dynamics | Abbreviation |
| Liver |  | HCC: Hepatocellular carcinoma |
| NAFLD: Non-alcoholic fatty liver disease | ||
| Thyroid | 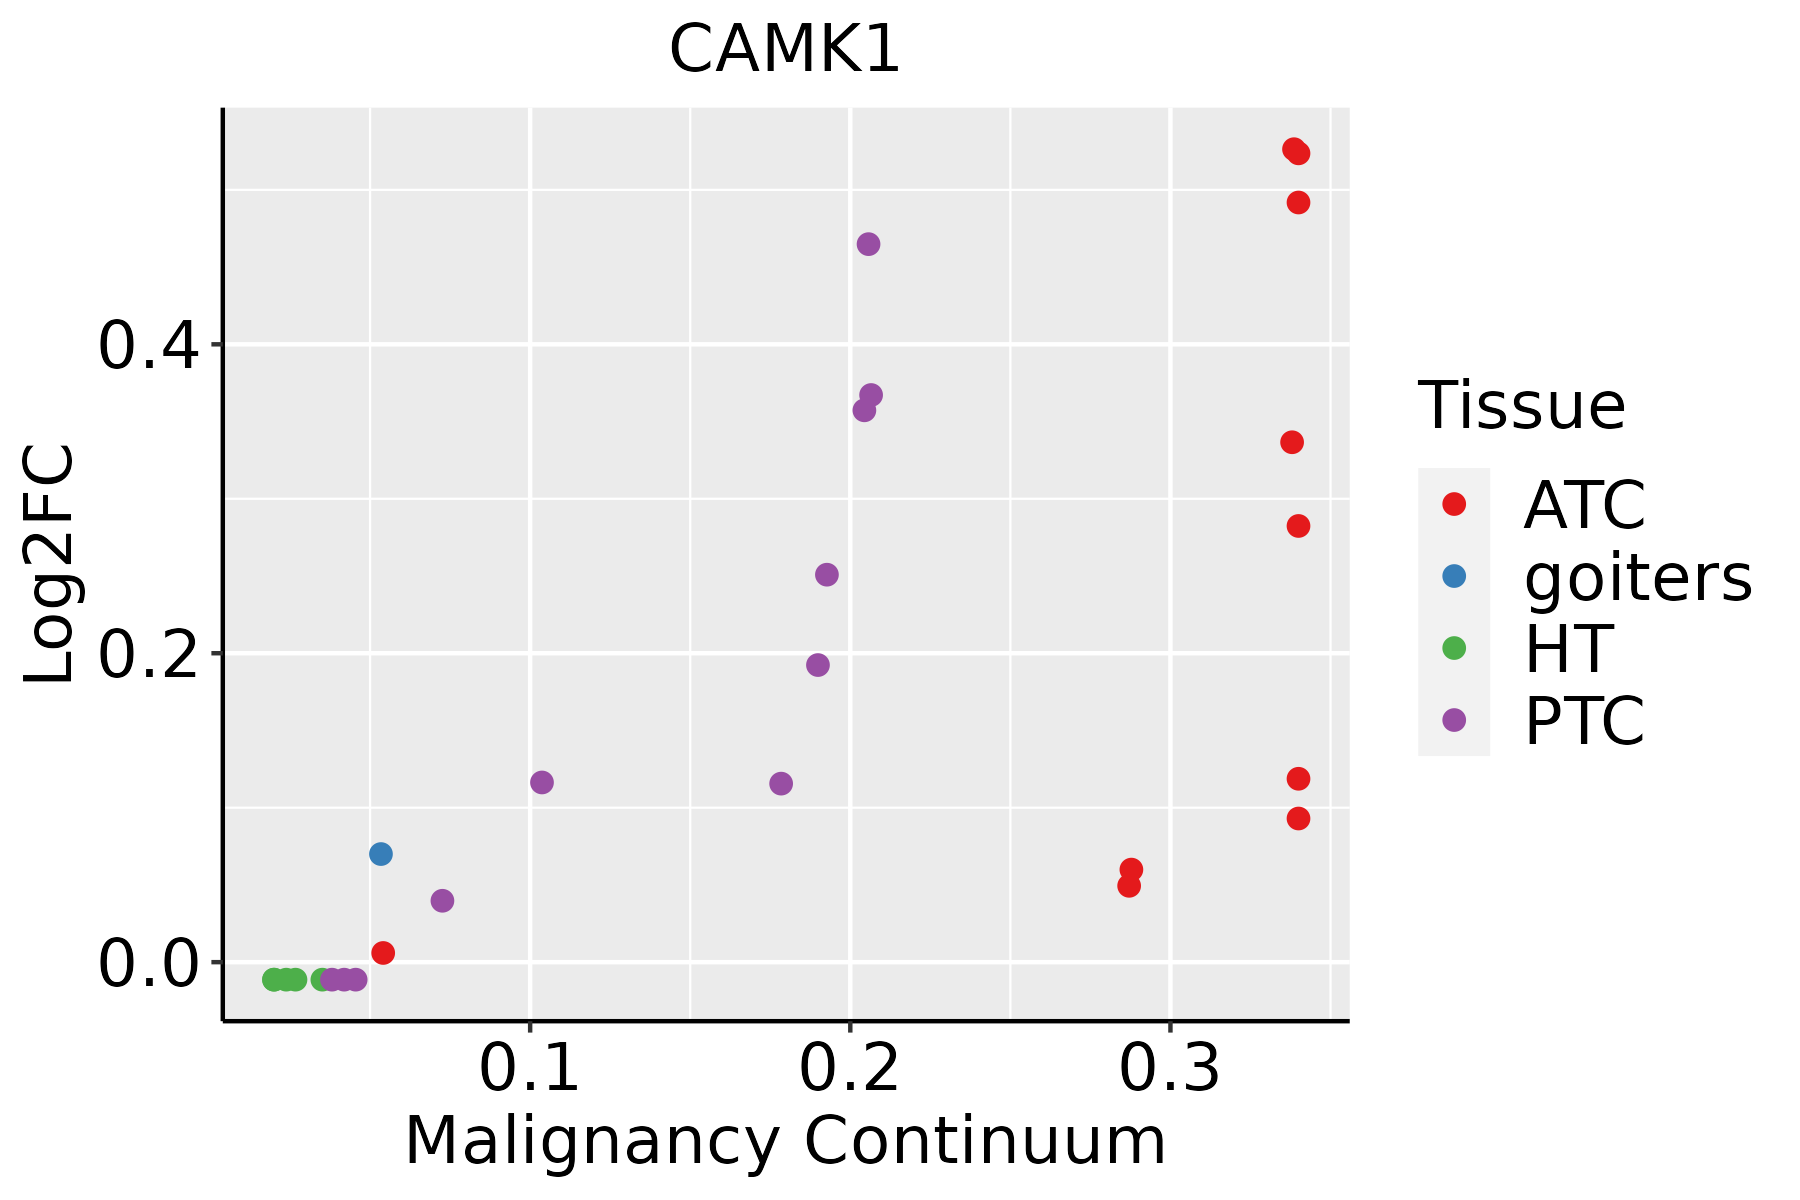 | ATC: Anaplastic thyroid cancer |
| HT: Hashimoto's thyroiditis | ||
| PTC: Papillary thyroid cancer |
| ∗log2FC in expression of this searched gene in stem-like cells from each diseased tissue sample relative to stem-like cells in normal samples in each tissue plotted against the malignancy continuum. Samples are colored based on if they are from different disease stage. |
Top |
Malignant transformation related pathway analysis |
| Find out the enriched GO biological processes and KEGG pathways involved in transition from healthy to precancer to cancer |
| Tissue | Disease Stage | Enriched GO biological Processes |
| Colorectum | AD |  |
| Colorectum | SER |  |
| Colorectum | MSS |  |
| Colorectum | MSI-H |  |
| Colorectum | FAP |  |
| ∗Top 15 enriched GO BP terms are showed in the bar plot of each disease state in each tissue. Each row represents a significant GO biological process which is colored according to the -log10(p.adjust). |
| Page: 1 2 3 4 5 6 7 8 9 |
| GO ID | Tissue | Disease Stage | Description | Gene Ratio | Bg Ratio | pvalue | p.adjust | Count |
| GO:00321035 | Cervix | CC | positive regulation of response to external stimulus | 95/2311 | 427/18723 | 5.44e-09 | 5.03e-07 | 95 |
| GO:00603267 | Cervix | CC | cell chemotaxis | 73/2311 | 310/18723 | 2.82e-08 | 1.96e-06 | 73 |
| GO:00975298 | Cervix | CC | myeloid leukocyte migration | 56/2311 | 220/18723 | 7.21e-08 | 4.15e-06 | 56 |
| GO:00305957 | Cervix | CC | leukocyte chemotaxis | 57/2311 | 230/18723 | 1.48e-07 | 7.07e-06 | 57 |
| GO:00716218 | Cervix | CC | granulocyte chemotaxis | 37/2311 | 125/18723 | 2.16e-07 | 9.56e-06 | 37 |
| GO:00163587 | Cervix | CC | dendrite development | 58/2311 | 243/18723 | 4.52e-07 | 1.76e-05 | 58 |
| GO:00509007 | Cervix | CC | leukocyte migration | 78/2311 | 369/18723 | 1.09e-06 | 3.80e-05 | 78 |
| GO:00975308 | Cervix | CC | granulocyte migration | 39/2311 | 148/18723 | 2.67e-06 | 7.87e-05 | 39 |
| GO:00026857 | Cervix | CC | regulation of leukocyte migration | 50/2311 | 210/18723 | 2.95e-06 | 8.31e-05 | 50 |
| GO:00026888 | Cervix | CC | regulation of leukocyte chemotaxis | 34/2311 | 122/18723 | 3.00e-06 | 8.38e-05 | 34 |
| GO:00305938 | Cervix | CC | neutrophil chemotaxis | 30/2311 | 103/18723 | 4.24e-06 | 1.09e-04 | 30 |
| GO:00109757 | Cervix | CC | regulation of neuron projection development | 88/2311 | 445/18723 | 4.26e-06 | 1.09e-04 | 88 |
| GO:00510904 | Cervix | CC | regulation of DNA-binding transcription factor activity | 87/2311 | 440/18723 | 4.85e-06 | 1.22e-04 | 87 |
| GO:00509203 | Cervix | CC | regulation of chemotaxis | 51/2311 | 223/18723 | 8.03e-06 | 1.86e-04 | 51 |
| GO:00313467 | Cervix | CC | positive regulation of cell projection organization | 72/2311 | 353/18723 | 1.04e-05 | 2.32e-04 | 72 |
| GO:00026878 | Cervix | CC | positive regulation of leukocyte migration | 35/2311 | 135/18723 | 1.25e-05 | 2.60e-04 | 35 |
| GO:19902666 | Cervix | CC | neutrophil migration | 32/2311 | 122/18723 | 2.25e-05 | 4.00e-04 | 32 |
| GO:00026906 | Cervix | CC | positive regulation of leukocyte chemotaxis | 26/2311 | 94/18723 | 4.85e-05 | 7.34e-04 | 26 |
| GO:00181057 | Cervix | CC | peptidyl-serine phosphorylation | 63/2311 | 315/18723 | 6.65e-05 | 9.47e-04 | 63 |
| GO:00457306 | Cervix | CC | respiratory burst | 14/2311 | 37/18723 | 6.97e-05 | 9.81e-04 | 14 |
| Page: 1 2 3 4 5 6 7 8 9 10 11 12 13 14 15 16 17 18 19 20 |
| Pathway ID | Tissue | Disease Stage | Description | Gene Ratio | Bg Ratio | pvalue | p.adjust | qvalue | Count |
| hsa052142 | Liver | HCC | Glioma | 47/4020 | 75/8465 | 5.67e-03 | 1.62e-02 | 9.02e-03 | 47 |
| hsa0521411 | Liver | HCC | Glioma | 47/4020 | 75/8465 | 5.67e-03 | 1.62e-02 | 9.02e-03 | 47 |
| Page: 1 |
Top |
Cell-cell communication analysis |
| Identification of potential cell-cell interactions between two cell types and their ligand-receptor pairs for different disease states |
| Ligand | Receptor | LRpair | Pathway | Tissue | Disease Stage |
| Page: 1 |
Top |
Single-cell gene regulatory network inference analysis |
| Find out the significant the regulons (TFs) and the target genes of each regulon across cell types for different disease states |
| TF | Cell Type | Tissue | Disease Stage | Target Gene | RSS | Regulon Activity |
| ∗The dot plots of a searched regulon are shown for all cell subpopulations in each disease state of each tissue based on the regulon specific score inferred using pySCENIC and by calculating the average expression. |
| Page: 1 |
Top |
Somatic mutation of malignant transformation related genes |
| Annotation of somatic variants for genes involved in malignant transformation |
| Hugo Symbol | Variant Class | Variant Classification | dbSNP RS | HGVSc | HGVSp | HGVSp Short | SWISSPROT | BIOTYPE | SIFT | PolyPhen | Tumor Sample Barcode | Tissue | Histology | Sex | Age | Stage | Therapy Types | Drugs | Outcome |
| CAMK1 | SNV | Missense_Mutation | c.433N>A | p.Glu145Lys | p.E145K | Q14012 | protein_coding | deleterious(0.03) | possibly_damaging(0.816) | TCGA-BH-A18H-01 | Breast | breast invasive carcinoma | Female | <65 | I/II | Chemotherapy | adriamycin | CR | |
| CAMK1 | SNV | Missense_Mutation | rs747682193 | c.730G>A | p.Asp244Asn | p.D244N | Q14012 | protein_coding | tolerated(0.06) | benign(0.034) | TCGA-2W-A8YY-01 | Cervix | cervical & endocervical cancer | Female | <65 | I/II | Chemotherapy | cisplatin | CR |
| CAMK1 | SNV | Missense_Mutation | rs781010077 | c.948G>A | p.Met316Ile | p.M316I | Q14012 | protein_coding | tolerated(0.15) | benign(0.034) | TCGA-IR-A3LA-01 | Cervix | cervical & endocervical cancer | Female | <65 | I/II | Chemotherapy | cisplatin | CR |
| CAMK1 | SNV | Missense_Mutation | c.737N>G | p.Ser246Cys | p.S246C | Q14012 | protein_coding | deleterious(0) | probably_damaging(1) | TCGA-JX-A3PZ-01 | Cervix | cervical & endocervical cancer | Female | <65 | I/II | Unknown | Unknown | PD | |
| CAMK1 | SNV | Missense_Mutation | c.501G>C | p.Lys167Asn | p.K167N | Q14012 | protein_coding | deleterious(0.02) | probably_damaging(0.999) | TCGA-Q1-A73O-01 | Cervix | cervical & endocervical cancer | Female | <65 | I/II | Chemotherapy | cisplatin | CR | |
| CAMK1 | SNV | Missense_Mutation | c.583T>C | p.Tyr195His | p.Y195H | Q14012 | protein_coding | deleterious(0.02) | probably_damaging(0.958) | TCGA-AA-3950-01 | Colorectum | colon adenocarcinoma | Female | >=65 | I/II | Unknown | Unknown | SD | |
| CAMK1 | SNV | Missense_Mutation | rs746723292 | c.317N>A | p.Arg106His | p.R106H | Q14012 | protein_coding | deleterious(0.03) | probably_damaging(0.973) | TCGA-AA-A00N-01 | Colorectum | colon adenocarcinoma | Male | >=65 | I/II | Unknown | Unknown | PD |
| CAMK1 | SNV | Missense_Mutation | c.486N>A | p.Asp162Glu | p.D162E | Q14012 | protein_coding | deleterious(0.01) | probably_damaging(0.978) | TCGA-AD-A5EJ-01 | Colorectum | colon adenocarcinoma | Female | >=65 | I/II | Unknown | Unknown | SD | |
| CAMK1 | SNV | Missense_Mutation | c.600N>G | p.Asp200Glu | p.D200E | Q14012 | protein_coding | deleterious(0) | possibly_damaging(0.828) | TCGA-DM-A1HB-01 | Colorectum | colon adenocarcinoma | Male | >=65 | III/IV | Unknown | Unknown | SD | |
| CAMK1 | SNV | Missense_Mutation | c.341N>T | p.Thr114Met | p.T114M | Q14012 | protein_coding | deleterious(0) | probably_damaging(0.998) | TCGA-G4-6304-01 | Colorectum | colon adenocarcinoma | Female | >=65 | I/II | Chemotherapy | fluorouracil | PD |
| Page: 1 2 3 4 |
Top |
Related drugs of malignant transformation related genes |
| Identification of chemicals and drugs interact with genes involved in malignant transfromation |
| (DGIdb 4.0) |
| Entrez ID | Symbol | Category | Interaction Types | Drug Claim Name | Drug Name | PMIDs |
| 8536 | CAMK1 | ENZYME, KINASE, SERINE THREONINE KINASE, DRUGGABLE GENOME | LINIFANIB | LINIFANIB | ||
| 8536 | CAMK1 | ENZYME, KINASE, SERINE THREONINE KINASE, DRUGGABLE GENOME | LAUROGUADINE | LAUROGUADINE | ||
| 8536 | CAMK1 | ENZYME, KINASE, SERINE THREONINE KINASE, DRUGGABLE GENOME | ILORASERTIB | ILORASERTIB |
| Page: 1 |

Copyright 2023-Present -The University of Texas Health Science Center at Houston |