
|
|||||
|
 | |
| |
| |
| |
| |
| |
|
Gene: CALN1 |
Gene summary for CALN1 |
| Gene information | Species | Human | Gene symbol | CALN1 | Gene ID | 83698 |
| Gene name | calneuron 1 | |
| Gene Alias | CABP8 | |
| Cytomap | 7q11.22 | |
| Gene Type | protein-coding | GO ID | GO:0005575 | UniProtAcc | A4D1Z1 |
Top |
Malignant transformation analysis |
| Identification of the aberrant gene expression in precancerous and cancerous lesions by comparing the gene expression of stem-like cells in diseased tissues with normal stem cells |
| Entrez ID | Symbol | Replicates | Species | Organ | Tissue | Adj P-value | Log2FC | Malignancy |
| 83698 | CALN1 | AEH-subject1 | Human | Endometrium | AEH | 1.81e-18 | 4.31e-01 | -0.3059 |
| 83698 | CALN1 | AEH-subject2 | Human | Endometrium | AEH | 2.55e-10 | 3.88e-01 | -0.2525 |
| 83698 | CALN1 | AEH-subject3 | Human | Endometrium | AEH | 2.63e-16 | 4.83e-01 | -0.2576 |
| 83698 | CALN1 | AEH-subject4 | Human | Endometrium | AEH | 1.49e-17 | 5.68e-01 | -0.2657 |
| 83698 | CALN1 | AEH-subject5 | Human | Endometrium | AEH | 8.30e-05 | 2.39e-01 | -0.2953 |
| 83698 | CALN1 | EEC-subject1 | Human | Endometrium | EEC | 1.10e-37 | 8.81e-01 | -0.2682 |
| 83698 | CALN1 | EEC-subject4 | Human | Endometrium | EEC | 2.03e-03 | 2.58e-01 | -0.2571 |
| 83698 | CALN1 | EEC-subject5 | Human | Endometrium | EEC | 2.23e-02 | 1.80e-01 | -0.249 |
| 83698 | CALN1 | HCC2 | Human | Liver | HCC | 1.89e-04 | 1.24e+00 | 0.5341 |
| 83698 | CALN1 | HCC5 | Human | Liver | HCC | 3.76e-06 | 8.64e-01 | 0.4932 |
| 83698 | CALN1 | S015 | Human | Liver | HCC | 3.75e-02 | 3.76e-01 | 0.2375 |
| Page: 1 |
| Tissue | Expression Dynamics | Abbreviation |
| Endometrium | 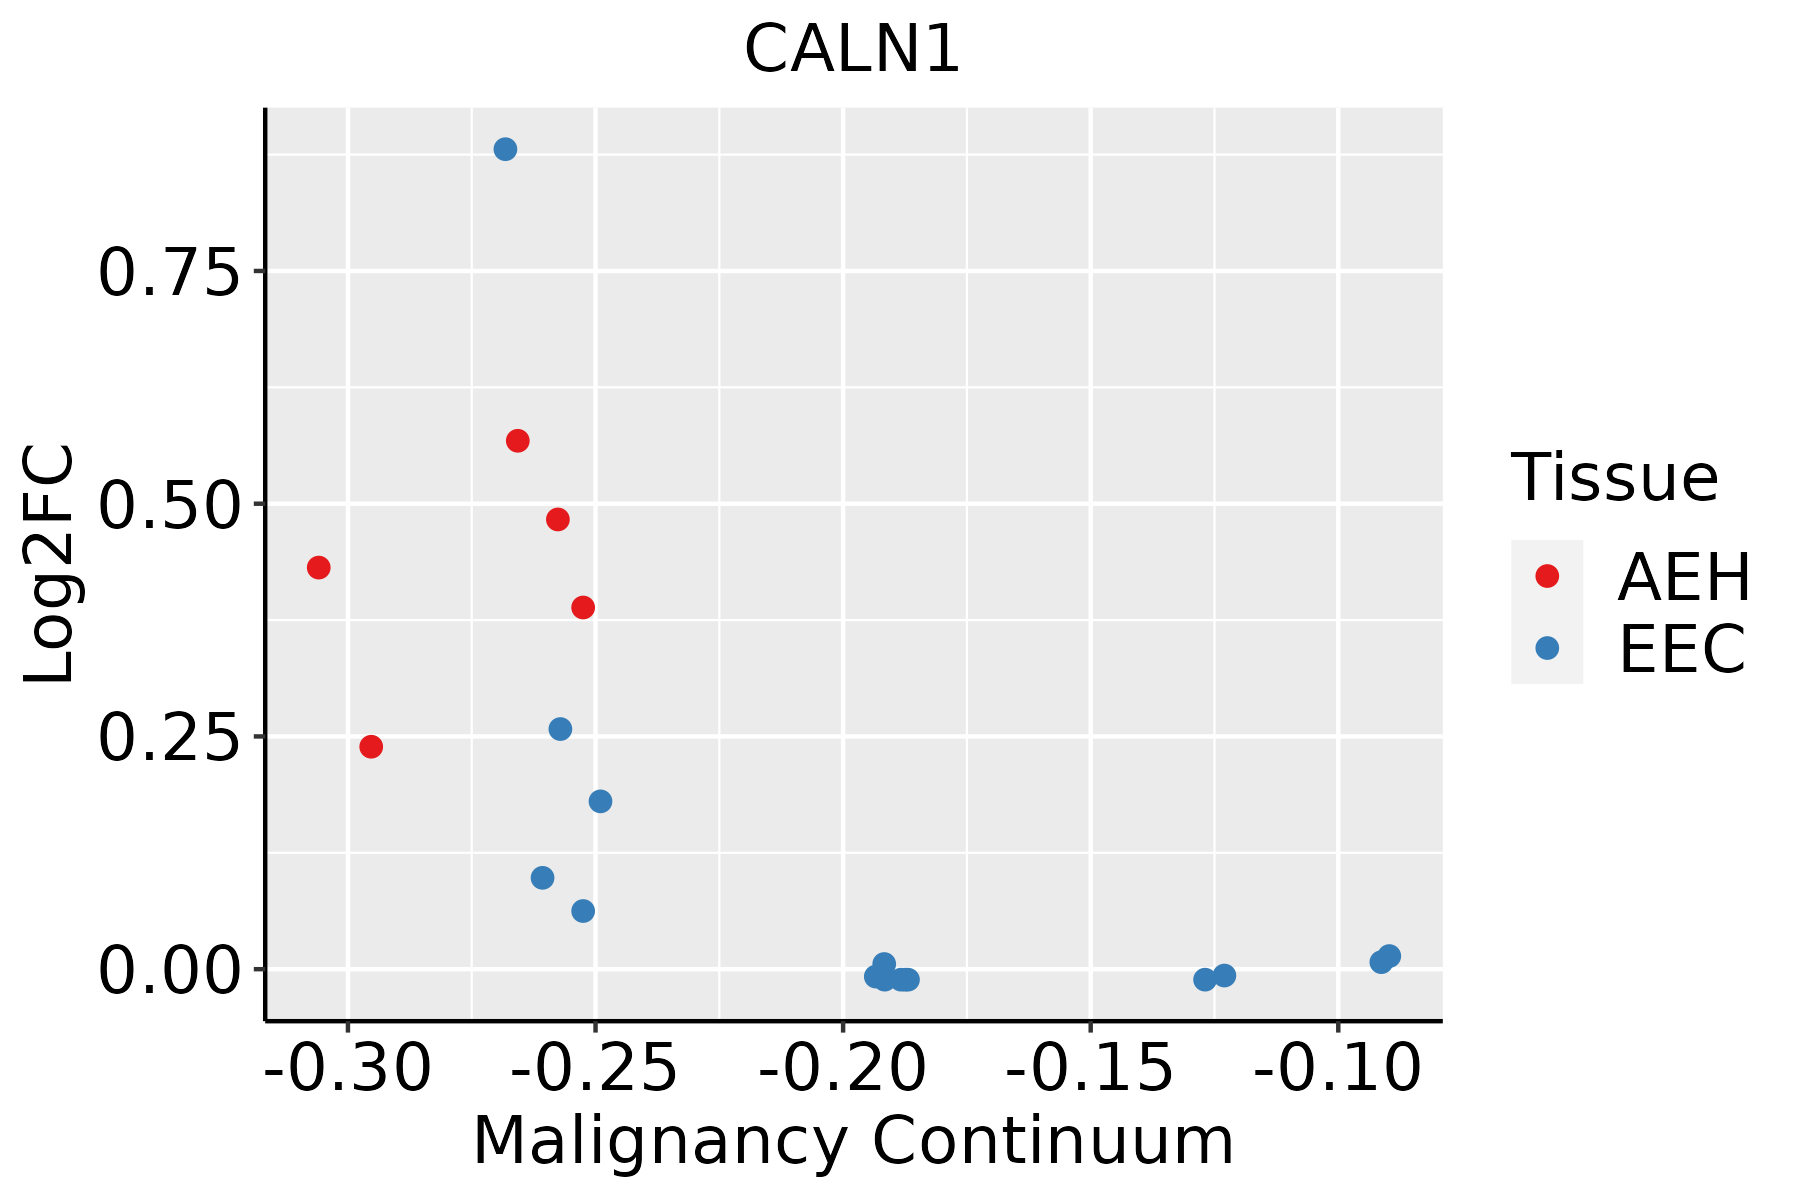 | AEH: Atypical endometrial hyperplasia |
| EEC: Endometrioid Cancer | ||
| Liver | 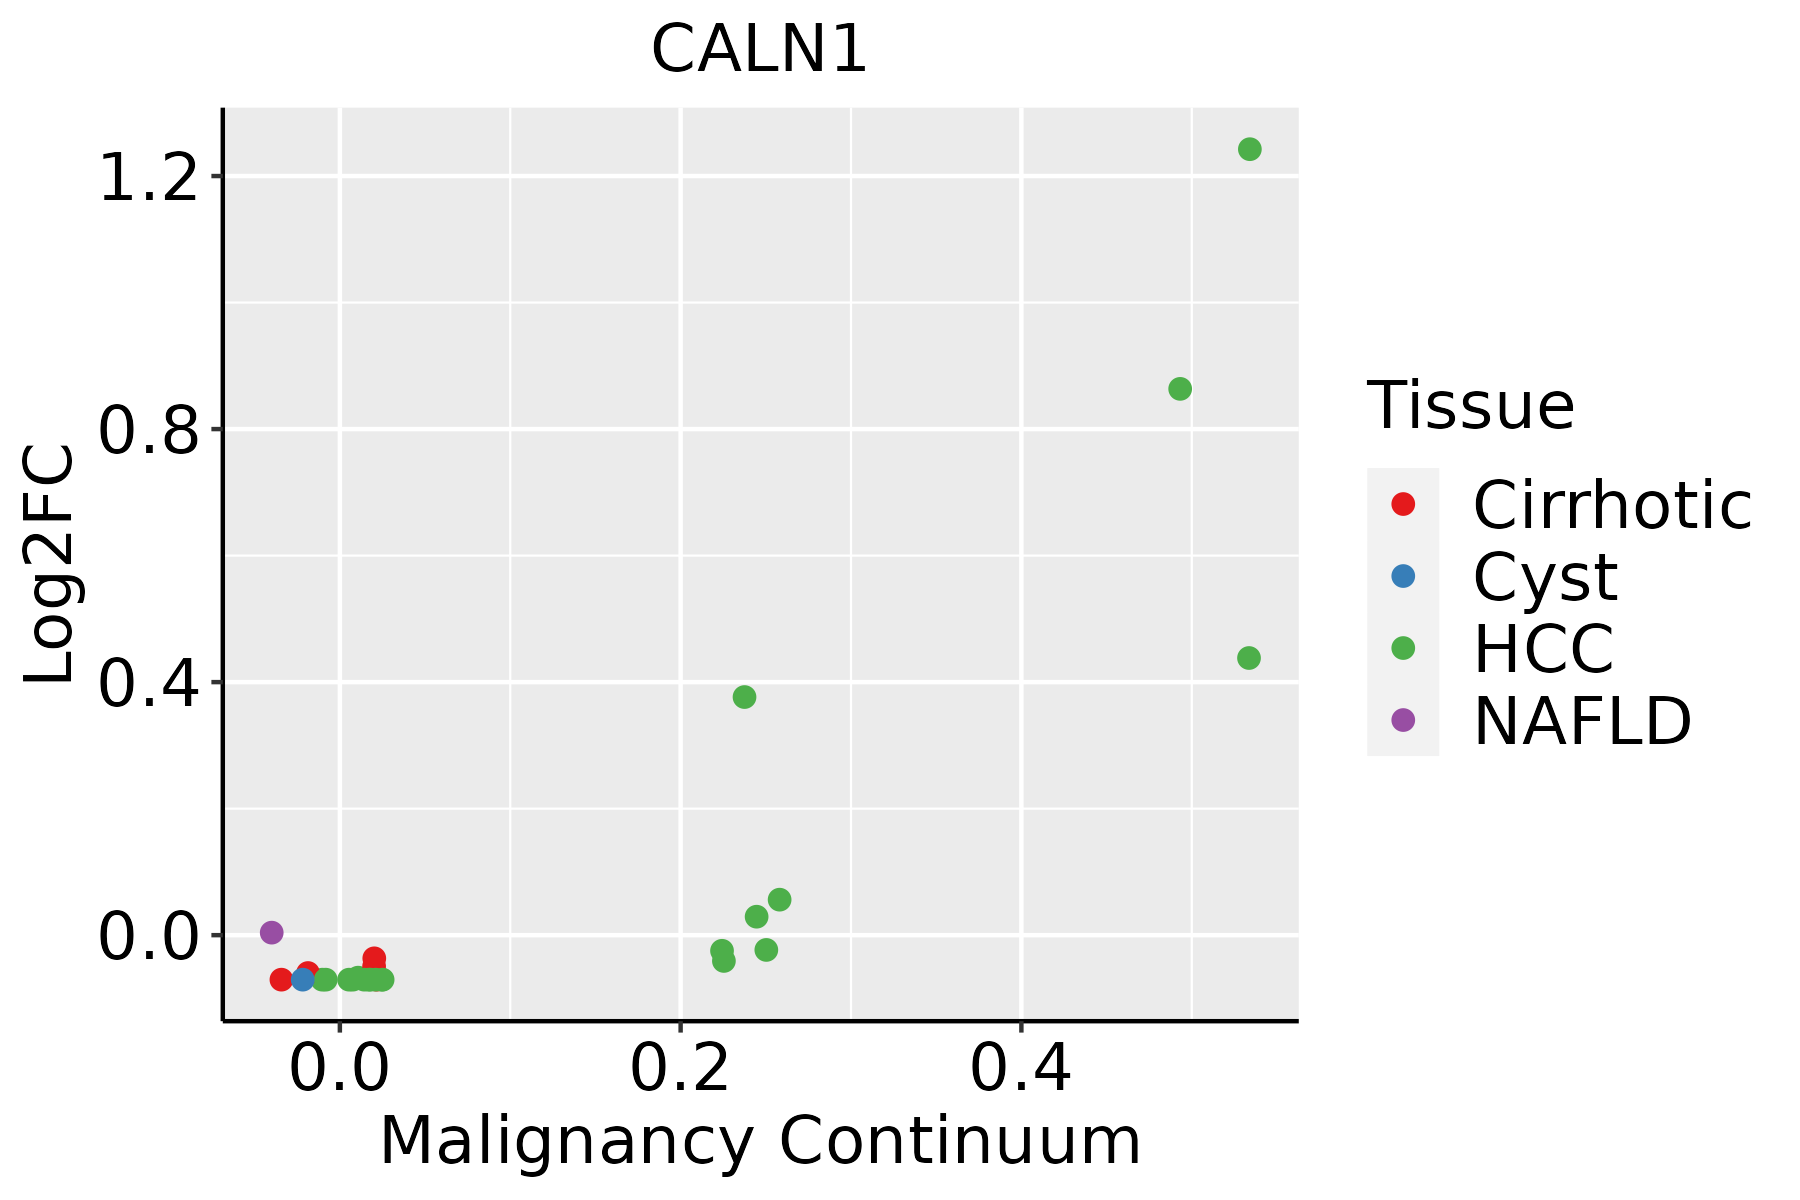 | HCC: Hepatocellular carcinoma |
| NAFLD: Non-alcoholic fatty liver disease |
| ∗log2FC in expression of this searched gene in stem-like cells from each diseased tissue sample relative to stem-like cells in normal samples in each tissue plotted against the malignancy continuum. Samples are colored based on if they are from different disease stage. |
Top |
Malignant transformation related pathway analysis |
| Find out the enriched GO biological processes and KEGG pathways involved in transition from healthy to precancer to cancer |
| Tissue | Disease Stage | Enriched GO biological Processes |
| Colorectum | AD |  |
| Colorectum | SER |  |
| Colorectum | MSS |  |
| Colorectum | MSI-H |  |
| Colorectum | FAP |  |
| ∗Top 15 enriched GO BP terms are showed in the bar plot of each disease state in each tissue. Each row represents a significant GO biological process which is colored according to the -log10(p.adjust). |
| Page: 1 2 3 4 5 6 7 8 9 |
| GO ID | Tissue | Disease Stage | Description | Gene Ratio | Bg Ratio | pvalue | p.adjust | Count |
| Page: 1 |
| Pathway ID | Tissue | Disease Stage | Description | Gene Ratio | Bg Ratio | pvalue | p.adjust | qvalue | Count |
| Page: 1 |
Top |
Cell-cell communication analysis |
| Identification of potential cell-cell interactions between two cell types and their ligand-receptor pairs for different disease states |
| Ligand | Receptor | LRpair | Pathway | Tissue | Disease Stage |
| Page: 1 |
Top |
Single-cell gene regulatory network inference analysis |
| Find out the significant the regulons (TFs) and the target genes of each regulon across cell types for different disease states |
| TF | Cell Type | Tissue | Disease Stage | Target Gene | RSS | Regulon Activity |
| ∗The dot plots of a searched regulon are shown for all cell subpopulations in each disease state of each tissue based on the regulon specific score inferred using pySCENIC and by calculating the average expression. |
| Page: 1 |
Top |
Somatic mutation of malignant transformation related genes |
| Annotation of somatic variants for genes involved in malignant transformation |
| Hugo Symbol | Variant Class | Variant Classification | dbSNP RS | HGVSc | HGVSp | HGVSp Short | SWISSPROT | BIOTYPE | SIFT | PolyPhen | Tumor Sample Barcode | Tissue | Histology | Sex | Age | Stage | Therapy Types | Drugs | Outcome |
| CALN1 | SNV | Missense_Mutation | c.727T>C | p.Phe243Leu | p.F243L | Q9BXU9 | protein_coding | deleterious(0) | probably_damaging(0.998) | TCGA-A8-A09Z-01 | Breast | breast invasive carcinoma | Female | >=65 | I/II | Unknown | Unknown | SD | |
| CALN1 | SNV | Missense_Mutation | rs770206451 | c.4N>T | p.Arg2Trp | p.R2W | Q9BXU9 | protein_coding | deleterious_low_confidence(0.02) | benign(0) | TCGA-E2-A15M-01 | Breast | breast invasive carcinoma | Female | >=65 | I/II | Hormone Therapy | arimidex | SD |
| CALN1 | SNV | Missense_Mutation | rs771972574 | c.374G>A | p.Arg125His | p.R125H | Q9BXU9 | protein_coding | tolerated(0.09) | probably_damaging(1) | TCGA-2W-A8YY-01 | Cervix | cervical & endocervical cancer | Female | <65 | I/II | Chemotherapy | cisplatin | CR |
| CALN1 | SNV | Missense_Mutation | c.712N>A | p.Ala238Thr | p.A238T | Q9BXU9 | protein_coding | deleterious(0) | probably_damaging(0.999) | TCGA-JW-A5VI-01 | Cervix | cervical & endocervical cancer | Female | <65 | I/II | Chemotherapy | topotecan | PD | |
| CALN1 | SNV | Missense_Mutation | rs762029880 | c.323N>A | p.Arg108His | p.R108H | Q9BXU9 | protein_coding | deleterious(0) | probably_damaging(1) | TCGA-VS-A9U6-01 | Cervix | cervical & endocervical cancer | Female | <65 | I/II | Chemotherapy | cisplatin | PD |
| CALN1 | SNV | Missense_Mutation | rs144352678 | c.691N>A | p.Val231Ile | p.V231I | Q9BXU9 | protein_coding | deleterious(0) | possibly_damaging(0.726) | TCGA-AA-A01Z-01 | Colorectum | colon adenocarcinoma | Male | >=65 | I/II | Unknown | Unknown | PD |
| CALN1 | SNV | Missense_Mutation | rs764569419 | c.458N>A | p.Arg153His | p.R153H | Q9BXU9 | protein_coding | deleterious(0.04) | benign(0.113) | TCGA-CM-6677-01 | Colorectum | colon adenocarcinoma | Female | >=65 | I/II | Unknown | Unknown | SD |
| CALN1 | SNV | Missense_Mutation | rs771972574 | c.374G>A | p.Arg125His | p.R125H | Q9BXU9 | protein_coding | tolerated(0.09) | probably_damaging(1) | TCGA-NH-A50U-01 | Colorectum | colon adenocarcinoma | Male | <65 | I/II | Ancillary | leucovorin | PD |
| CALN1 | SNV | Missense_Mutation | rs767526121 | c.148N>A | p.Ala50Thr | p.A50T | Q9BXU9 | protein_coding | tolerated(0.07) | possibly_damaging(0.572) | TCGA-AG-A016-01 | Colorectum | rectum adenocarcinoma | Male | <65 | III/IV | Chemotherapy | 5-fluorouracil | SD |
| CALN1 | insertion | Frame_Shift_Ins | novel | c.333dupG | p.Tyr112ValfsTer26 | p.Y112Vfs*26 | Q9BXU9 | protein_coding | TCGA-NH-A5IV-01 | Colorectum | colon adenocarcinoma | Female | >=65 | I/II | Unknown | Unknown | SD |
| Page: 1 2 3 4 5 6 7 |
Top |
Related drugs of malignant transformation related genes |
| Identification of chemicals and drugs interact with genes involved in malignant transfromation |
| (DGIdb 4.0) |
| Entrez ID | Symbol | Category | Interaction Types | Drug Claim Name | Drug Name | PMIDs |
| Page: 1 |

Copyright 2023-Present -The University of Texas Health Science Center at Houston |