
|
|||||
|
 | |
| |
| |
| |
| |
| |
|
Gene: CALML5 |
Gene summary for CALML5 |
| Gene information | Species | Human | Gene symbol | CALML5 | Gene ID | 51806 |
| Gene name | calmodulin like 5 | |
| Gene Alias | CLSP | |
| Cytomap | 10p15.1 | |
| Gene Type | protein-coding | GO ID | GO:0007154 | UniProtAcc | Q53H37 |
Top |
Malignant transformation analysis |
| Identification of the aberrant gene expression in precancerous and cancerous lesions by comparing the gene expression of stem-like cells in diseased tissues with normal stem cells |
| Entrez ID | Symbol | Replicates | Species | Organ | Tissue | Adj P-value | Log2FC | Malignancy |
| 51806 | CALML5 | GSM4909281 | Human | Breast | IDC | 1.28e-41 | 9.18e-01 | 0.21 |
| 51806 | CALML5 | GSM4909282 | Human | Breast | IDC | 2.67e-80 | 1.11e+00 | -0.0288 |
| 51806 | CALML5 | GSM4909285 | Human | Breast | IDC | 7.39e-122 | 1.60e+00 | 0.21 |
| 51806 | CALML5 | GSM4909286 | Human | Breast | IDC | 2.26e-12 | 2.55e-01 | 0.1081 |
| 51806 | CALML5 | GSM4909288 | Human | Breast | IDC | 7.62e-05 | 7.08e-01 | 0.0988 |
| 51806 | CALML5 | GSM4909290 | Human | Breast | IDC | 9.67e-130 | 1.97e+00 | 0.2096 |
| 51806 | CALML5 | GSM4909293 | Human | Breast | IDC | 9.05e-05 | -2.71e-01 | 0.1581 |
| 51806 | CALML5 | GSM4909294 | Human | Breast | IDC | 5.32e-83 | 1.44e+00 | 0.2022 |
| 51806 | CALML5 | GSM4909295 | Human | Breast | IDC | 1.02e-43 | 1.46e+00 | 0.0898 |
| 51806 | CALML5 | GSM4909296 | Human | Breast | IDC | 2.05e-38 | 1.01e+00 | 0.1524 |
| 51806 | CALML5 | GSM4909298 | Human | Breast | IDC | 7.21e-04 | -2.41e-01 | 0.1551 |
| 51806 | CALML5 | GSM4909301 | Human | Breast | IDC | 5.17e-07 | -2.72e-01 | 0.1577 |
| 51806 | CALML5 | GSM4909302 | Human | Breast | IDC | 5.69e-03 | -2.59e-01 | 0.1545 |
| 51806 | CALML5 | GSM4909304 | Human | Breast | IDC | 3.74e-05 | -2.92e-01 | 0.1636 |
| 51806 | CALML5 | GSM4909308 | Human | Breast | IDC | 1.02e-04 | -2.83e-01 | 0.158 |
| 51806 | CALML5 | GSM4909311 | Human | Breast | IDC | 1.78e-05 | -2.66e-01 | 0.1534 |
| 51806 | CALML5 | GSM4909312 | Human | Breast | IDC | 3.05e-04 | -2.79e-01 | 0.1552 |
| 51806 | CALML5 | GSM4909315 | Human | Breast | IDC | 3.74e-04 | -2.80e-01 | 0.21 |
| 51806 | CALML5 | GSM4909317 | Human | Breast | IDC | 1.69e-57 | 1.38e+00 | 0.1355 |
| 51806 | CALML5 | GSM4909318 | Human | Breast | IDC | 5.77e-34 | 1.65e+00 | 0.2031 |
| Page: 1 2 3 4 5 |
| Tissue | Expression Dynamics | Abbreviation |
| Breast | 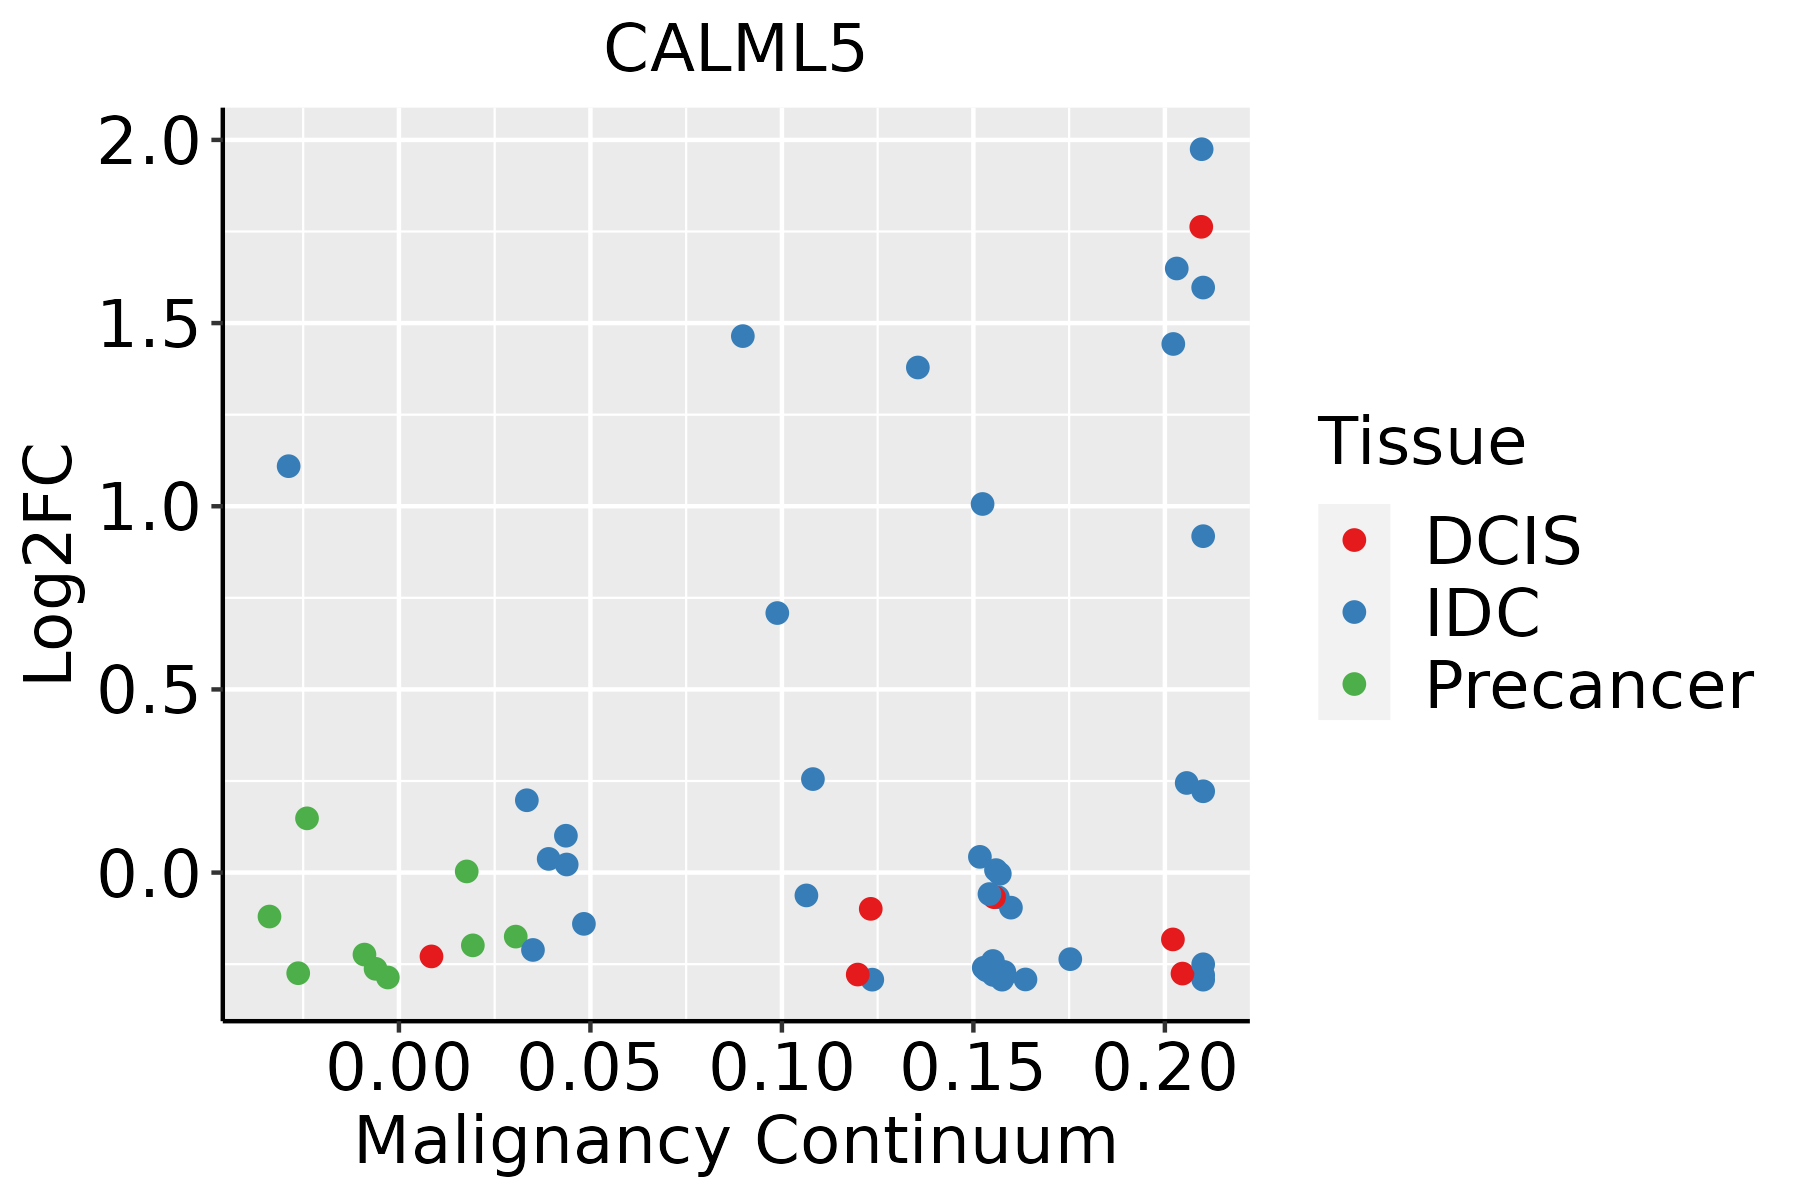 | IDC: Invasive ductal carcinoma |
| DCIS: Ductal carcinoma in situ | ||
| Precancer(BRCA1-mut): Precancerous lesion from BRCA1 mutation carriers | ||
| Cervix | 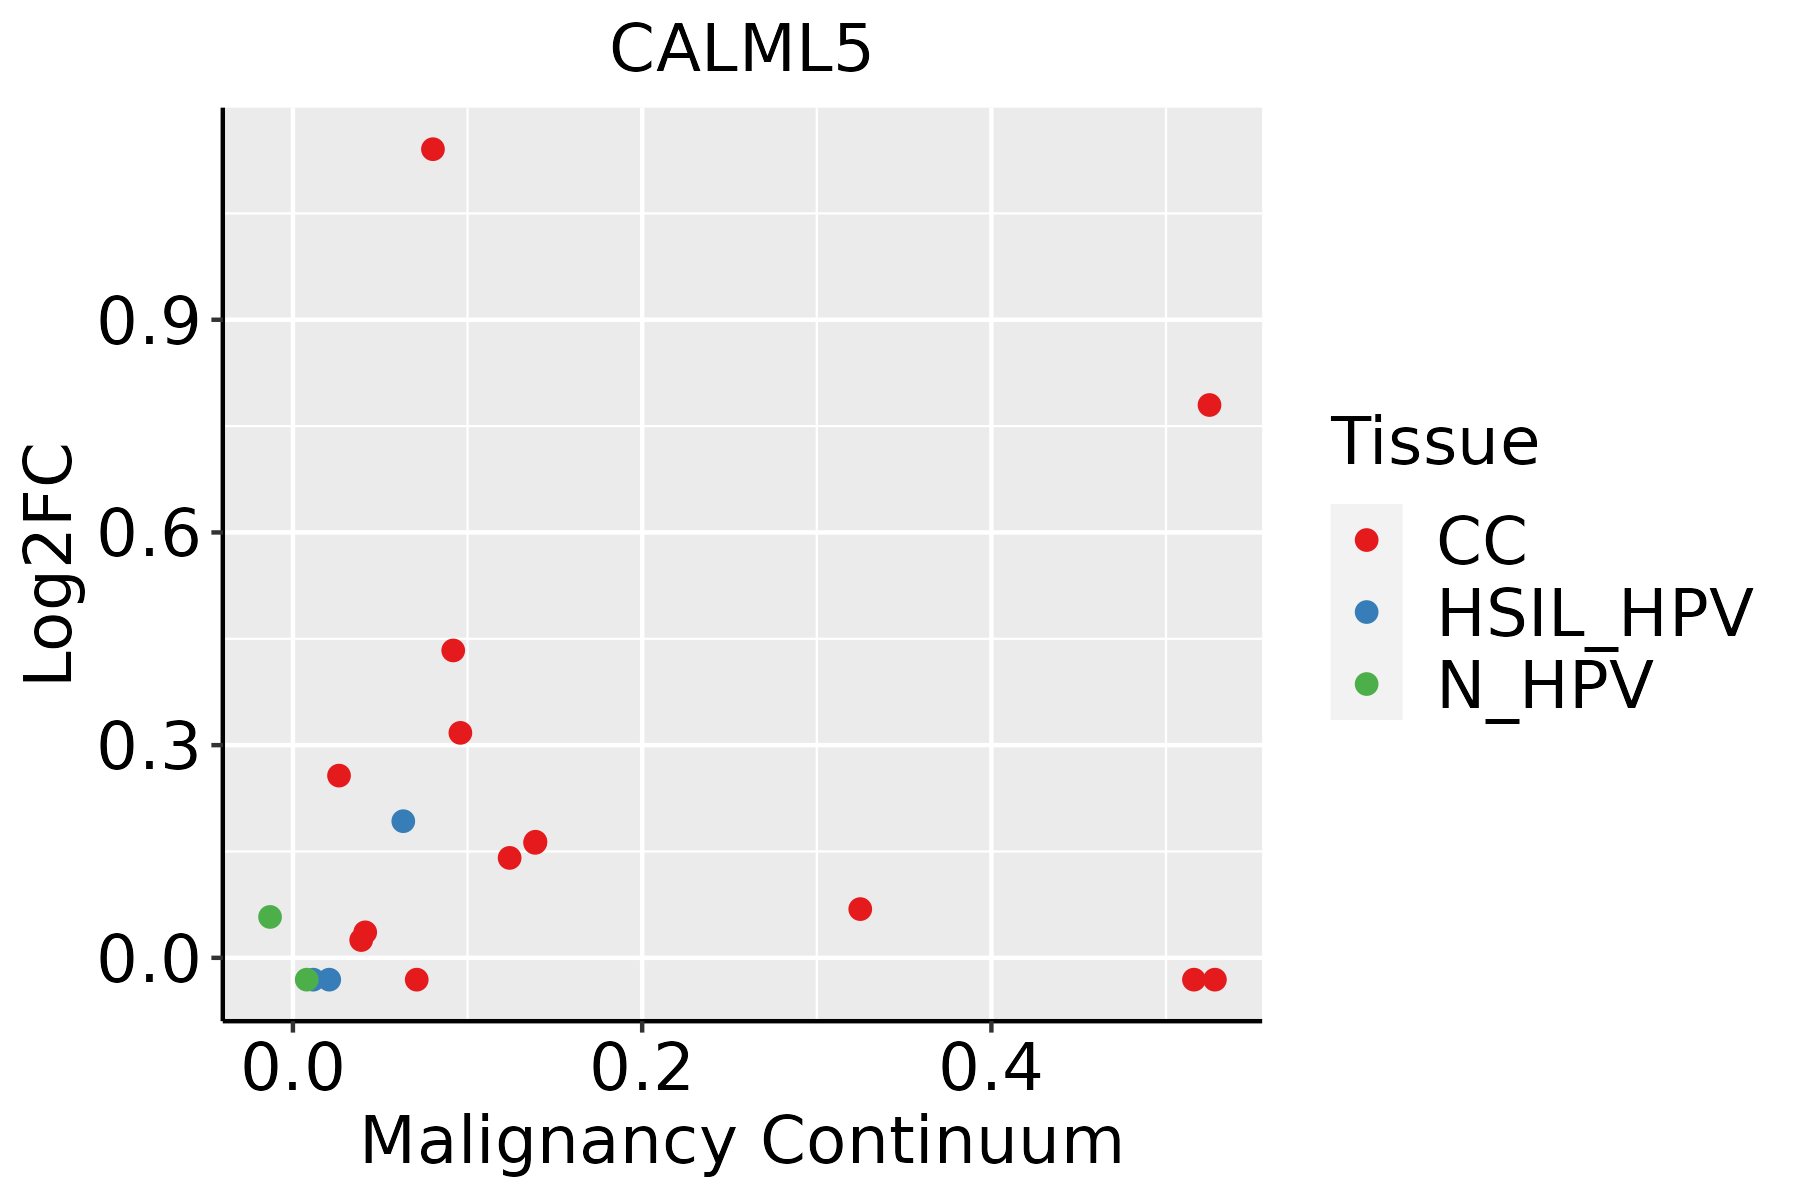 | CC: Cervix cancer |
| HSIL_HPV: HPV-infected high-grade squamous intraepithelial lesions | ||
| N_HPV: HPV-infected normal cervix | ||
| Esophagus | 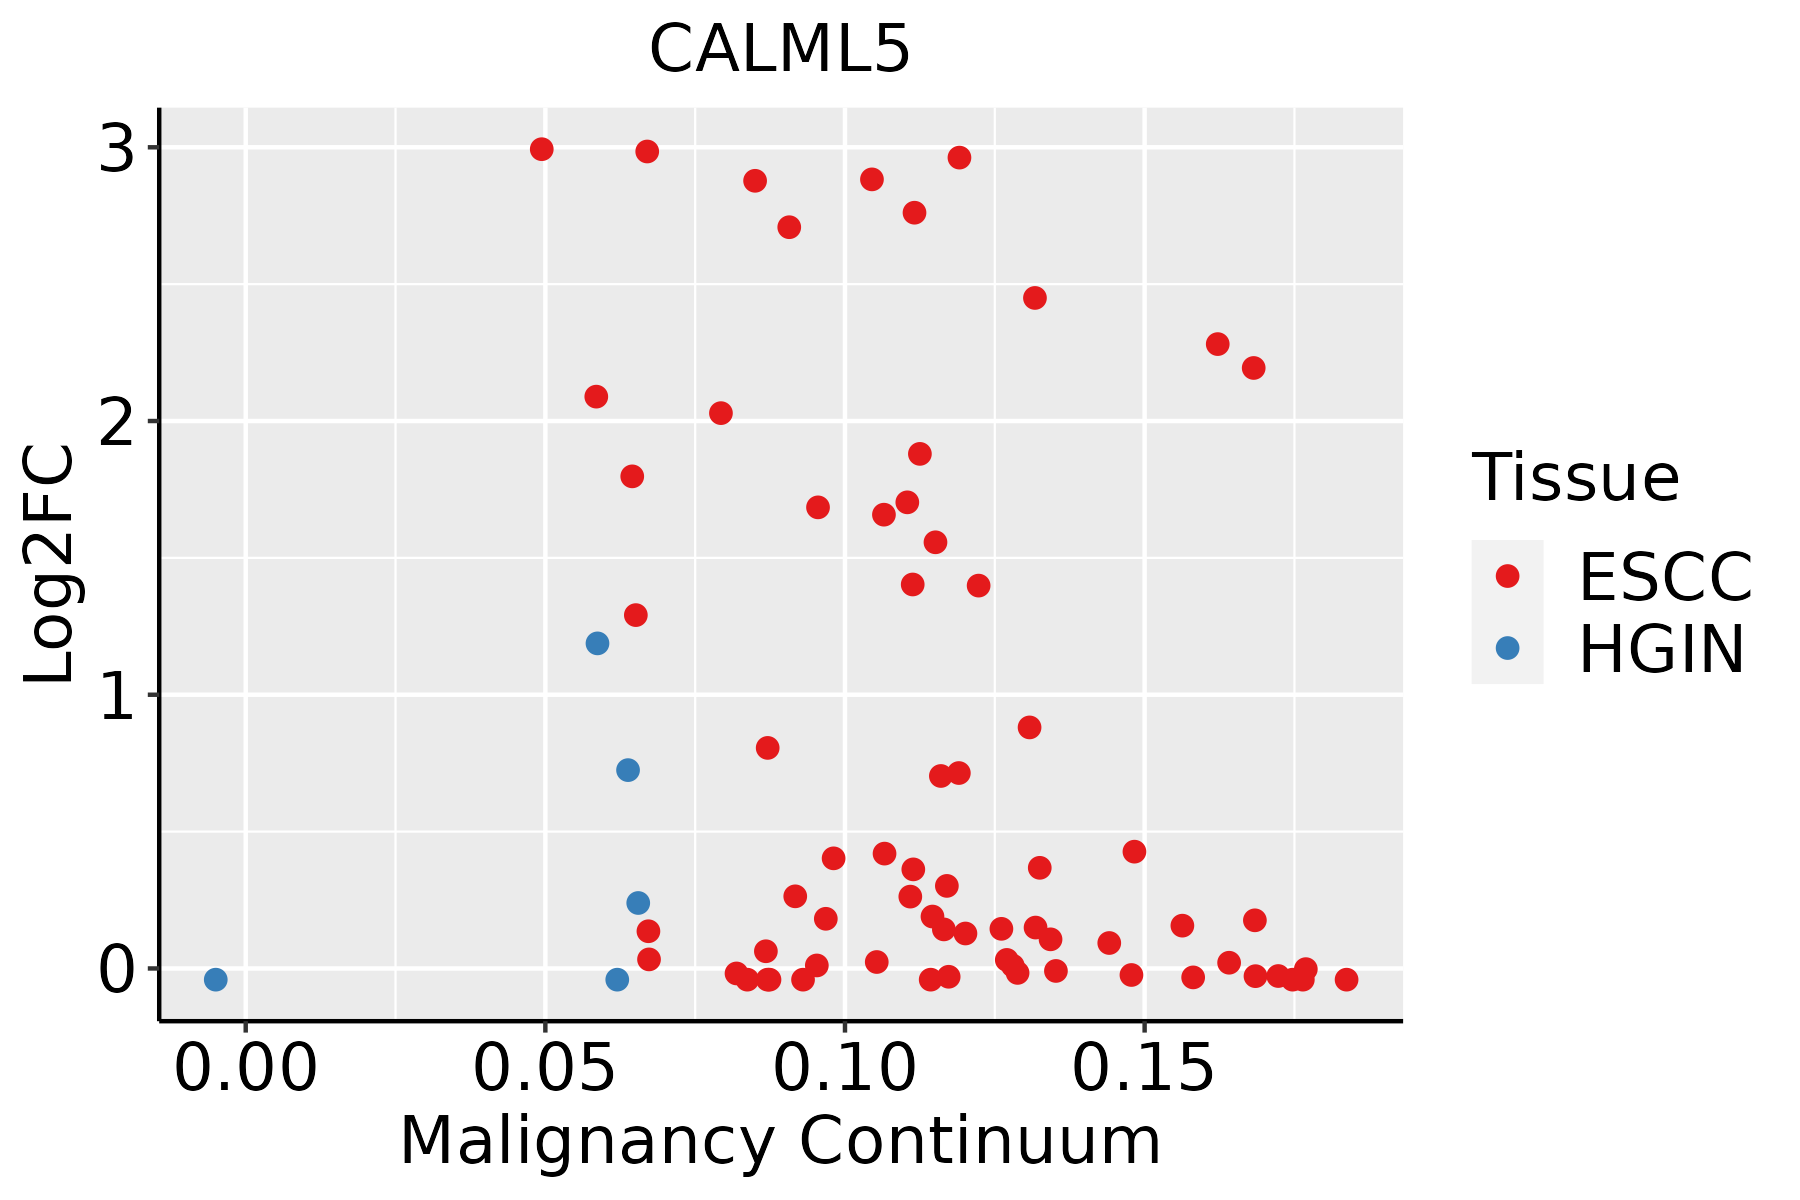 | ESCC: Esophageal squamous cell carcinoma |
| HGIN: High-grade intraepithelial neoplasias | ||
| LGIN: Low-grade intraepithelial neoplasias | ||
| Oral Cavity | 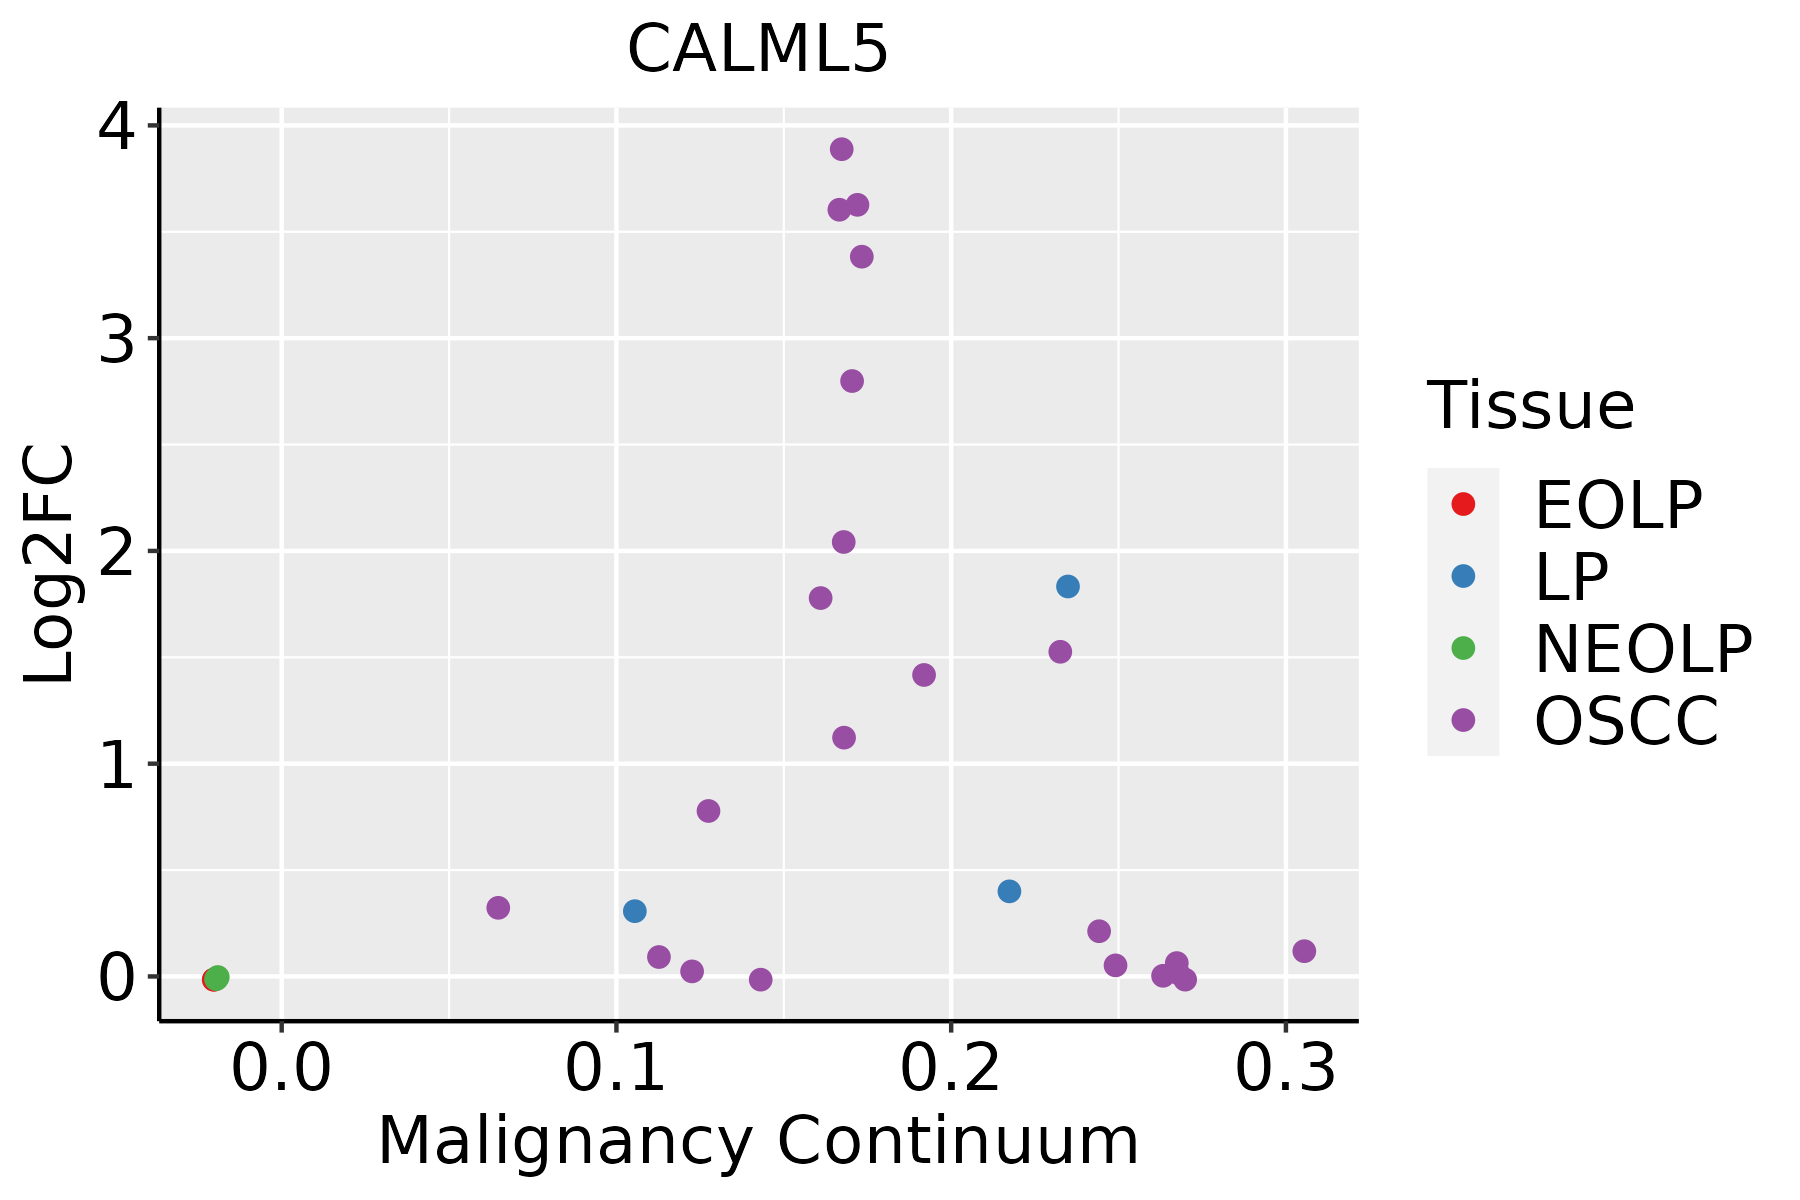 | EOLP: Erosive Oral lichen planus |
| LP: leukoplakia | ||
| NEOLP: Non-erosive oral lichen planus | ||
| OSCC: Oral squamous cell carcinoma | ||
| Skin | 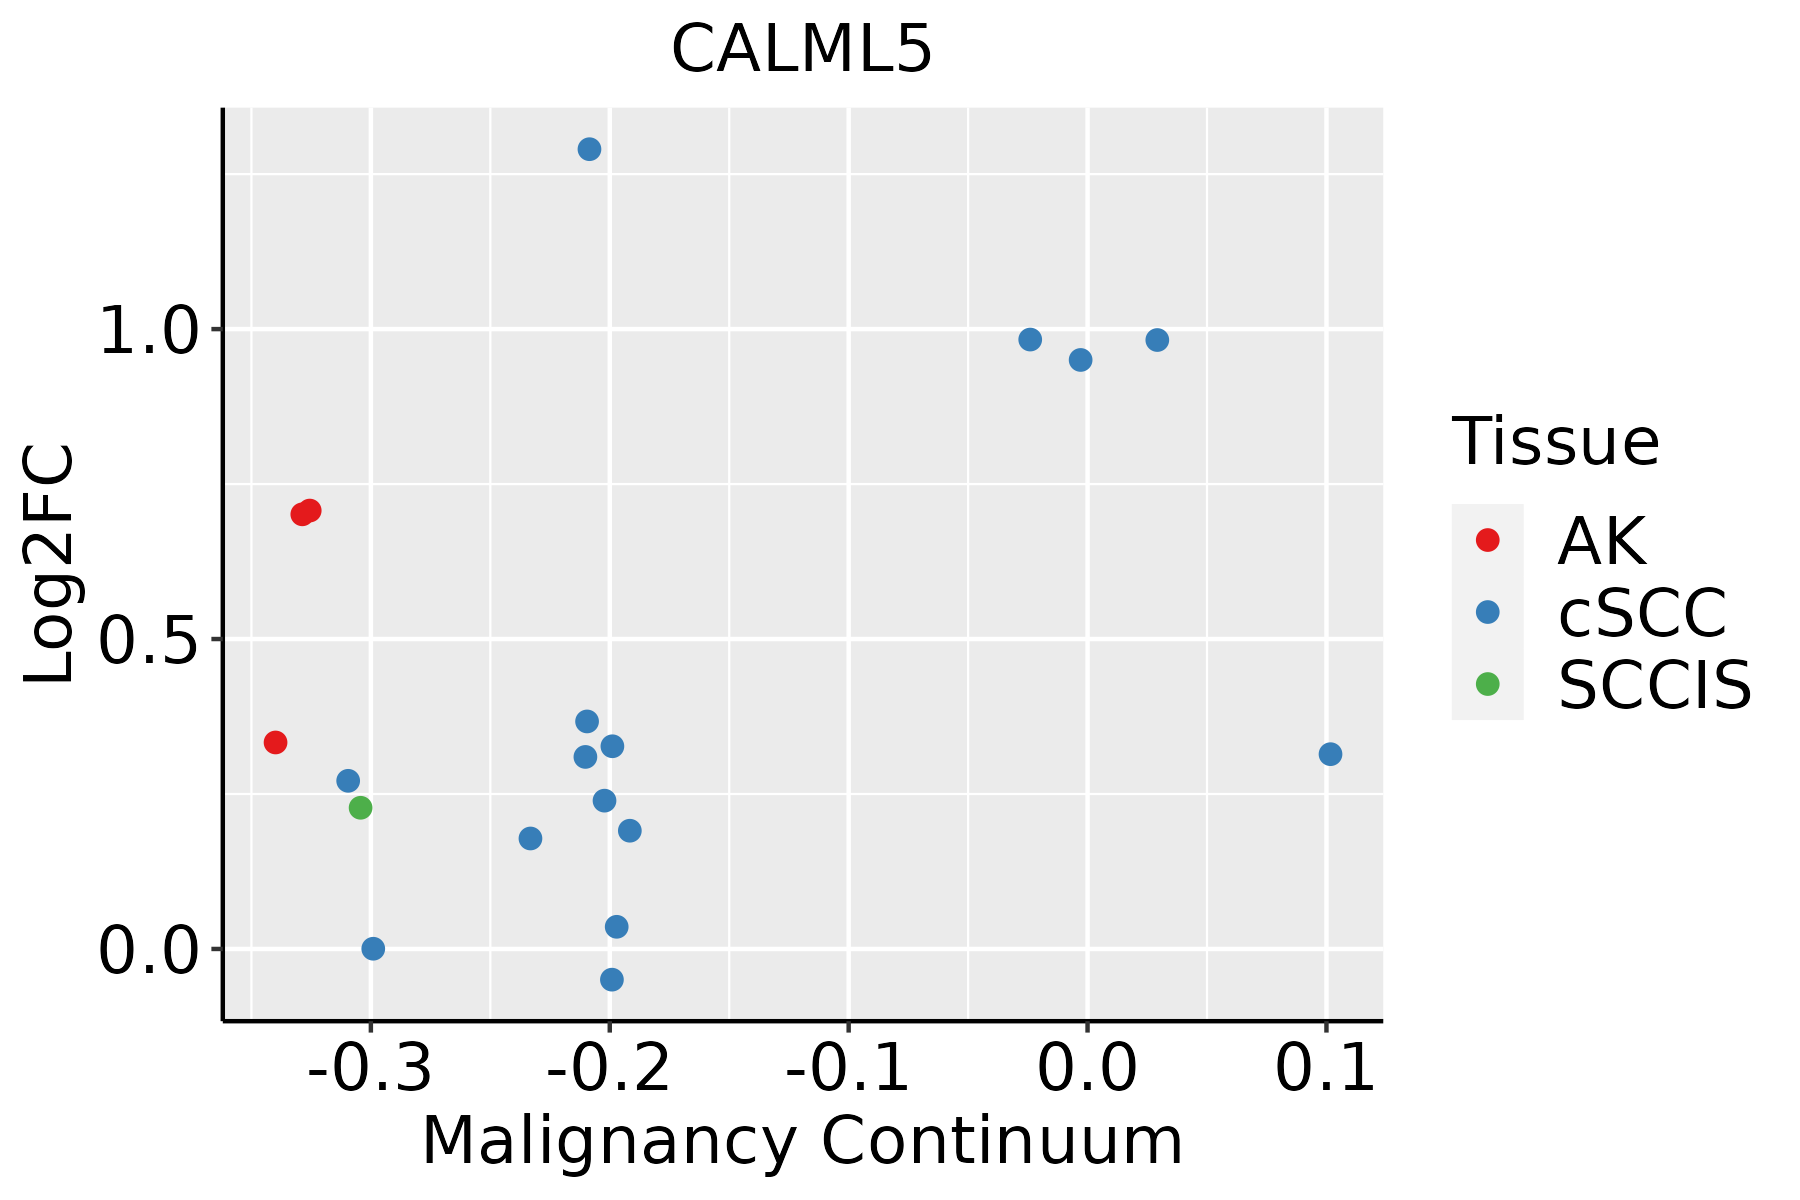 | AK: Actinic keratosis |
| cSCC: Cutaneous squamous cell carcinoma | ||
| SCCIS:squamous cell carcinoma in situ |
| ∗log2FC in expression of this searched gene in stem-like cells from each diseased tissue sample relative to stem-like cells in normal samples in each tissue plotted against the malignancy continuum. Samples are colored based on if they are from different disease stage. |
Top |
Malignant transformation related pathway analysis |
| Find out the enriched GO biological processes and KEGG pathways involved in transition from healthy to precancer to cancer |
| Tissue | Disease Stage | Enriched GO biological Processes |
| Colorectum | AD |  |
| Colorectum | SER |  |
| Colorectum | MSS |  |
| Colorectum | MSI-H |  |
| Colorectum | FAP |  |
| ∗Top 15 enriched GO BP terms are showed in the bar plot of each disease state in each tissue. Each row represents a significant GO biological process which is colored according to the -log10(p.adjust). |
| Page: 1 2 3 4 5 6 7 8 9 |
| GO ID | Tissue | Disease Stage | Description | Gene Ratio | Bg Ratio | pvalue | p.adjust | Count |
| GO:00085445 | Breast | Precancer | epidermis development | 35/1080 | 324/18723 | 2.71e-04 | 3.96e-03 | 35 |
| GO:000854412 | Breast | IDC | epidermis development | 41/1434 | 324/18723 | 1.03e-03 | 1.14e-02 | 41 |
| GO:000854422 | Breast | DCIS | epidermis development | 40/1390 | 324/18723 | 1.05e-03 | 1.16e-02 | 40 |
| GO:00085446 | Cervix | CC | epidermis development | 83/2311 | 324/18723 | 3.91e-11 | 8.54e-09 | 83 |
| GO:000854410 | Esophagus | ESCC | epidermis development | 193/8552 | 324/18723 | 2.87e-07 | 4.19e-06 | 193 |
| GO:00085449 | Oral cavity | OSCC | epidermis development | 171/7305 | 324/18723 | 2.89e-07 | 4.43e-06 | 171 |
| GO:000854416 | Oral cavity | LP | epidermis development | 112/4623 | 324/18723 | 3.81e-05 | 5.61e-04 | 112 |
| GO:000854417 | Skin | AK | epidermis development | 79/1910 | 324/18723 | 1.04e-13 | 3.25e-11 | 79 |
| GO:000854425 | Skin | cSCC | epidermis development | 131/4864 | 324/18723 | 7.38e-09 | 2.39e-07 | 131 |
| Page: 1 |
| Pathway ID | Tissue | Disease Stage | Description | Gene Ratio | Bg Ratio | pvalue | p.adjust | qvalue | Count |
| hsa0501218 | Breast | Precancer | Parkinson disease | 99/684 | 266/8465 | 3.58e-42 | 5.65e-40 | 4.33e-40 | 99 |
| hsa0501016 | Breast | Precancer | Alzheimer disease | 103/684 | 384/8465 | 1.03e-29 | 4.66e-28 | 3.57e-28 | 103 |
| hsa0502216 | Breast | Precancer | Pathways of neurodegeneration - multiple diseases | 112/684 | 476/8465 | 6.96e-27 | 2.44e-25 | 1.87e-25 | 112 |
| hsa0516718 | Breast | Precancer | Kaposi sarcoma-associated herpesvirus infection | 36/684 | 194/8465 | 1.68e-06 | 2.53e-05 | 1.94e-05 | 36 |
| hsa0491518 | Breast | Precancer | Estrogen signaling pathway | 28/684 | 138/8465 | 4.10e-06 | 5.39e-05 | 4.13e-05 | 28 |
| hsa0541818 | Breast | Precancer | Fluid shear stress and atherosclerosis | 28/684 | 139/8465 | 4.74e-06 | 6.00e-05 | 4.59e-05 | 28 |
| hsa0541718 | Breast | Precancer | Lipid and atherosclerosis | 37/684 | 215/8465 | 7.64e-06 | 9.29e-05 | 7.12e-05 | 37 |
| hsa042189 | Breast | Precancer | Cellular senescence | 29/684 | 156/8465 | 1.66e-05 | 1.69e-04 | 1.30e-04 | 29 |
| hsa05031 | Breast | Precancer | Amphetamine addiction | 14/684 | 69/8465 | 1.05e-03 | 7.35e-03 | 5.63e-03 | 14 |
| hsa0516316 | Breast | Precancer | Human cytomegalovirus infection | 32/684 | 225/8465 | 1.13e-03 | 7.57e-03 | 5.80e-03 | 32 |
| hsa0497114 | Breast | Precancer | Gastric acid secretion | 13/684 | 76/8465 | 7.35e-03 | 4.07e-02 | 3.12e-02 | 13 |
| hsa0501219 | Breast | Precancer | Parkinson disease | 99/684 | 266/8465 | 3.58e-42 | 5.65e-40 | 4.33e-40 | 99 |
| hsa0501017 | Breast | Precancer | Alzheimer disease | 103/684 | 384/8465 | 1.03e-29 | 4.66e-28 | 3.57e-28 | 103 |
| hsa0502217 | Breast | Precancer | Pathways of neurodegeneration - multiple diseases | 112/684 | 476/8465 | 6.96e-27 | 2.44e-25 | 1.87e-25 | 112 |
| hsa0516719 | Breast | Precancer | Kaposi sarcoma-associated herpesvirus infection | 36/684 | 194/8465 | 1.68e-06 | 2.53e-05 | 1.94e-05 | 36 |
| hsa0491519 | Breast | Precancer | Estrogen signaling pathway | 28/684 | 138/8465 | 4.10e-06 | 5.39e-05 | 4.13e-05 | 28 |
| hsa0541819 | Breast | Precancer | Fluid shear stress and atherosclerosis | 28/684 | 139/8465 | 4.74e-06 | 6.00e-05 | 4.59e-05 | 28 |
| hsa0541719 | Breast | Precancer | Lipid and atherosclerosis | 37/684 | 215/8465 | 7.64e-06 | 9.29e-05 | 7.12e-05 | 37 |
| hsa0421814 | Breast | Precancer | Cellular senescence | 29/684 | 156/8465 | 1.66e-05 | 1.69e-04 | 1.30e-04 | 29 |
| hsa050311 | Breast | Precancer | Amphetamine addiction | 14/684 | 69/8465 | 1.05e-03 | 7.35e-03 | 5.63e-03 | 14 |
| Page: 1 2 3 4 5 6 7 8 9 10 11 |
Top |
Cell-cell communication analysis |
| Identification of potential cell-cell interactions between two cell types and their ligand-receptor pairs for different disease states |
| Ligand | Receptor | LRpair | Pathway | Tissue | Disease Stage |
| Page: 1 |
Top |
Single-cell gene regulatory network inference analysis |
| Find out the significant the regulons (TFs) and the target genes of each regulon across cell types for different disease states |
| TF | Cell Type | Tissue | Disease Stage | Target Gene | RSS | Regulon Activity |
| ∗The dot plots of a searched regulon are shown for all cell subpopulations in each disease state of each tissue based on the regulon specific score inferred using pySCENIC and by calculating the average expression. |
| Page: 1 |
Top |
Somatic mutation of malignant transformation related genes |
| Annotation of somatic variants for genes involved in malignant transformation |
| Hugo Symbol | Variant Class | Variant Classification | dbSNP RS | HGVSc | HGVSp | HGVSp Short | SWISSPROT | BIOTYPE | SIFT | PolyPhen | Tumor Sample Barcode | Tissue | Histology | Sex | Age | Stage | Therapy Types | Drugs | Outcome |
| CALML5 | SNV | Missense_Mutation | rs760863630 | c.103N>A | p.Ala35Thr | p.A35T | Q9NZT1 | protein_coding | tolerated(1) | benign(0.06) | TCGA-C8-A274-01 | Breast | breast invasive carcinoma | Female | <65 | I/II | Hormone Therapy | tamoxiphen | SD |
| CALML5 | SNV | Missense_Mutation | c.119N>T | p.Thr40Met | p.T40M | Q9NZT1 | protein_coding | deleterious(0.02) | benign(0) | TCGA-C8-A278-01 | Breast | breast invasive carcinoma | Female | <65 | III/IV | Hormone Therapy | tamoxiphen | SD | |
| CALML5 | SNV | Missense_Mutation | c.187N>A | p.Glu63Lys | p.E63K | Q9NZT1 | protein_coding | tolerated(0.07) | benign(0.025) | TCGA-AA-3510-01 | Colorectum | colon adenocarcinoma | Male | >=65 | I/II | Unknown | Unknown | SD | |
| CALML5 | SNV | Missense_Mutation | c.271G>A | p.Asp91Asn | p.D91N | Q9NZT1 | protein_coding | deleterious(0) | probably_damaging(0.996) | TCGA-AA-3877-01 | Colorectum | colon adenocarcinoma | Female | >=65 | I/II | Unknown | Unknown | SD | |
| CALML5 | SNV | Missense_Mutation | c.187N>A | p.Glu63Lys | p.E63K | Q9NZT1 | protein_coding | tolerated(0.07) | benign(0.025) | TCGA-EI-6917-01 | Colorectum | rectum adenocarcinoma | Male | <65 | III/IV | Chemotherapy | 5fluorouracil+oxaciplatina+l-folinian | SD | |
| CALML5 | SNV | Missense_Mutation | rs760863630 | c.103N>A | p.Ala35Thr | p.A35T | Q9NZT1 | protein_coding | tolerated(1) | benign(0.06) | TCGA-AP-A0LM-01 | Endometrium | uterine corpus endometrioid carcinoma | Female | <65 | III/IV | Chemotherapy | cisplatin | SD |
| CALML5 | SNV | Missense_Mutation | rs201275265 | c.70N>A | p.Gly24Arg | p.G24R | Q9NZT1 | protein_coding | deleterious(0.03) | possibly_damaging(0.674) | TCGA-AX-A06D-01 | Endometrium | uterine corpus endometrioid carcinoma | Female | >=65 | III/IV | Chemotherapy | carboplatin | PD |
| CALML5 | SNV | Missense_Mutation | rs199855788 | c.215C>T | p.Ala72Val | p.A72V | Q9NZT1 | protein_coding | tolerated(0.19) | benign(0.012) | TCGA-AX-A2HC-01 | Endometrium | uterine corpus endometrioid carcinoma | Female | <65 | III/IV | Chemotherapy | paclitaxel | PD |
| CALML5 | SNV | Missense_Mutation | novel | c.114G>T | p.Lys38Asn | p.K38N | Q9NZT1 | protein_coding | deleterious(0.01) | possibly_damaging(0.551) | TCGA-AX-A2HC-01 | Endometrium | uterine corpus endometrioid carcinoma | Female | <65 | III/IV | Chemotherapy | paclitaxel | PD |
| CALML5 | SNV | Missense_Mutation | c.271G>A | p.Asp91Asn | p.D91N | Q9NZT1 | protein_coding | deleterious(0) | probably_damaging(0.996) | TCGA-B5-A11N-01 | Endometrium | uterine corpus endometrioid carcinoma | Female | >=65 | I/II | Unknown | Unknown | SD |
| Page: 1 2 |
Top |
Related drugs of malignant transformation related genes |
| Identification of chemicals and drugs interact with genes involved in malignant transfromation |
| (DGIdb 4.0) |
| Entrez ID | Symbol | Category | Interaction Types | Drug Claim Name | Drug Name | PMIDs |
| Page: 1 |

Copyright 2023-Present -The University of Texas Health Science Center at Houston |