
|
|||||
|
 | |
| |
| |
| |
| |
| |
|
Gene: CALML4 |
Gene summary for CALML4 |
| Gene information | Species | Human | Gene symbol | CALML4 | Gene ID | 91860 |
| Gene name | calmodulin like 4 | |
| Gene Alias | NY-BR-20 | |
| Cytomap | 15q23 | |
| Gene Type | protein-coding | GO ID | GO:0008150 | UniProtAcc | Q96GE6 |
Top |
Malignant transformation analysis |
| Identification of the aberrant gene expression in precancerous and cancerous lesions by comparing the gene expression of stem-like cells in diseased tissues with normal stem cells |
| Entrez ID | Symbol | Replicates | Species | Organ | Tissue | Adj P-value | Log2FC | Malignancy |
| 91860 | CALML4 | LZE7T | Human | Esophagus | ESCC | 9.32e-08 | 4.09e-01 | 0.0667 |
| 91860 | CALML4 | P28T-E | Human | Esophagus | ESCC | 3.99e-04 | 1.33e-01 | 0.1149 |
| 91860 | CALML4 | P30T-E | Human | Esophagus | ESCC | 3.85e-06 | 2.75e-01 | 0.137 |
| 91860 | CALML4 | P42T-E | Human | Esophagus | ESCC | 2.93e-03 | 1.79e-01 | 0.1175 |
| 91860 | CALML4 | P52T-E | Human | Esophagus | ESCC | 1.42e-02 | 8.50e-02 | 0.1555 |
| 91860 | CALML4 | P82T-E | Human | Esophagus | ESCC | 2.06e-06 | 8.90e-01 | 0.1072 |
| 91860 | CALML4 | P94T-E | Human | Esophagus | ESCC | 2.33e-17 | 1.53e+00 | 0.0879 |
| 91860 | CALML4 | P104T-E | Human | Esophagus | ESCC | 1.40e-05 | 4.47e-01 | 0.0931 |
| 91860 | CALML4 | P128T-E | Human | Esophagus | ESCC | 9.55e-03 | 1.52e-01 | 0.1241 |
| 91860 | CALML4 | P130T-E | Human | Esophagus | ESCC | 2.61e-05 | 1.12e-01 | 0.1676 |
| 91860 | CALML4 | Pat01-B | Human | Stomach | GC | 9.82e-51 | 8.59e-01 | 0.5754 |
| 91860 | CALML4 | Pat02-B | Human | Stomach | GC | 4.02e-43 | 6.67e-01 | 0.0368 |
| 91860 | CALML4 | Pat03-B | Human | Stomach | GC | 7.97e-53 | 9.10e-01 | 0.3693 |
| 91860 | CALML4 | Pat04-B | Human | Stomach | GC | 4.77e-37 | 7.33e-01 | -0.1483 |
| 91860 | CALML4 | Pat05-B | Human | Stomach | GC | 5.89e-16 | 4.26e-01 | -0.0353 |
| 91860 | CALML4 | Pat06-B | Human | Stomach | GC | 9.90e-23 | 3.91e-01 | -0.1961 |
| 91860 | CALML4 | Pat07-B | Human | Stomach | GC | 2.21e-09 | 4.08e-01 | 0.0935 |
| 91860 | CALML4 | Pat08-B | Human | Stomach | GC | 1.97e-19 | 6.97e-01 | 0.0182 |
| 91860 | CALML4 | Pat09-B | Human | Stomach | GC | 3.16e-11 | 2.92e-01 | -0.0359 |
| 91860 | CALML4 | Pat10-B | Human | Stomach | GC | 1.01e-08 | 3.93e-01 | 0.084 |
| Page: 1 2 |
| Tissue | Expression Dynamics | Abbreviation |
| Esophagus | 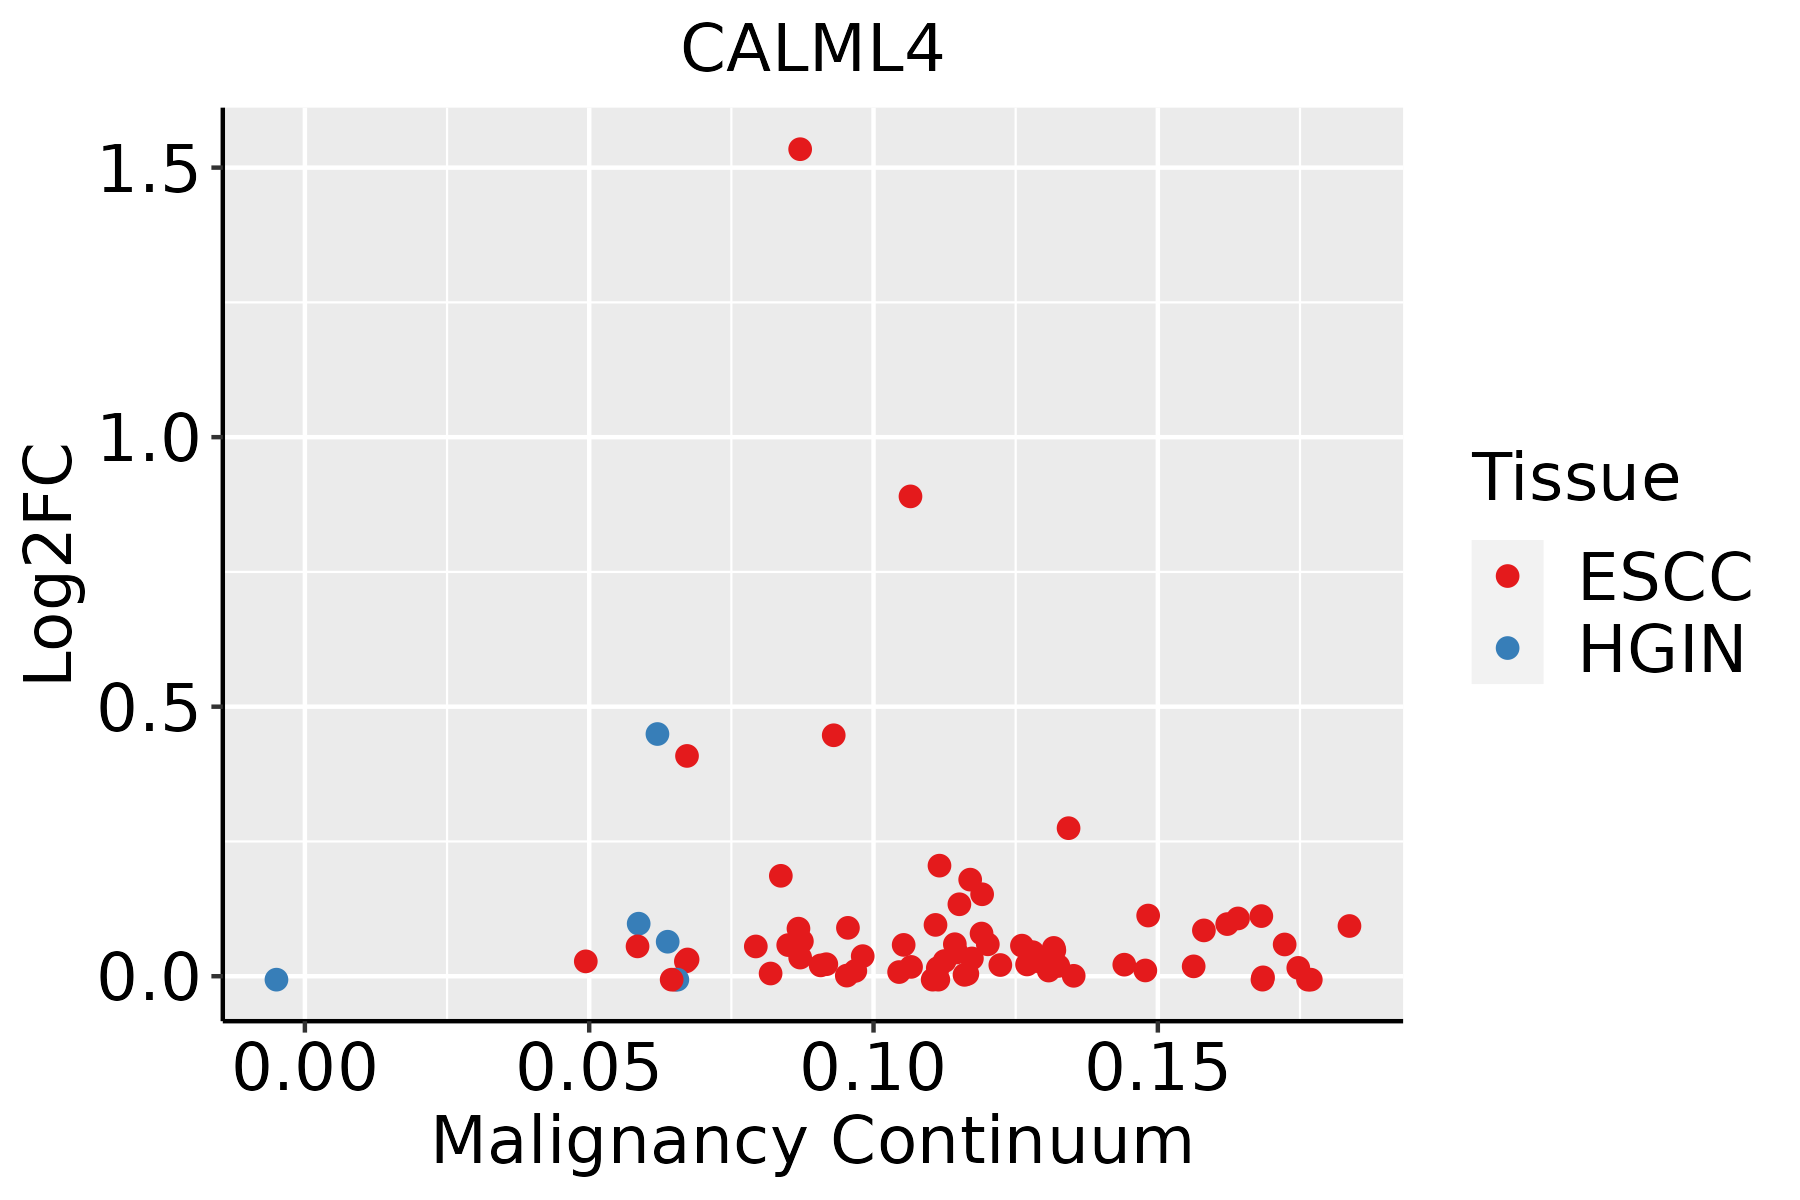 | ESCC: Esophageal squamous cell carcinoma |
| HGIN: High-grade intraepithelial neoplasias | ||
| LGIN: Low-grade intraepithelial neoplasias | ||
| GC | 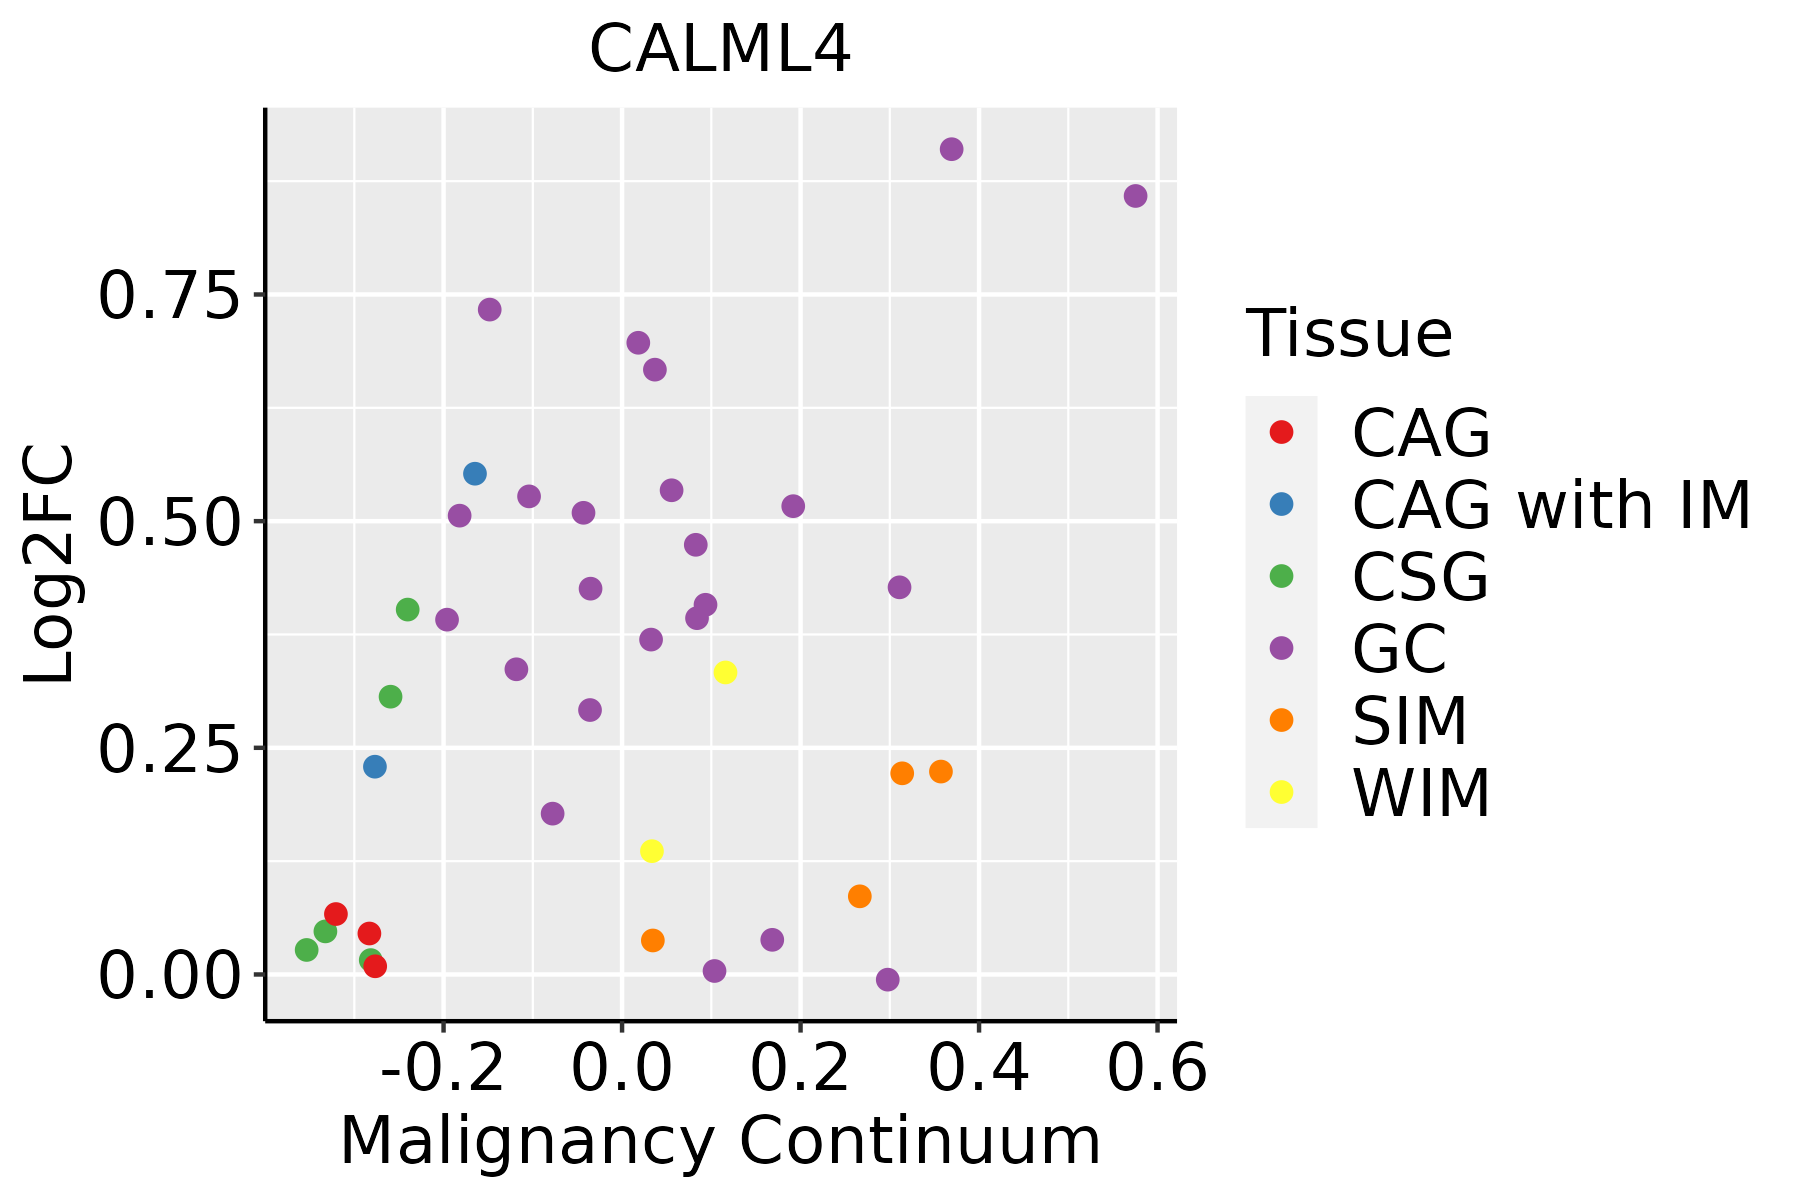 | CAG: Chronic atrophic gastritis |
| CAG with IM: Chronic atrophic gastritis with intestinal metaplasia | ||
| CSG: Chronic superficial gastritis | ||
| GC: Gastric cancer | ||
| SIM: Severe intestinal metaplasia | ||
| WIM: Wild intestinal metaplasia |
| ∗log2FC in expression of this searched gene in stem-like cells from each diseased tissue sample relative to stem-like cells in normal samples in each tissue plotted against the malignancy continuum. Samples are colored based on if they are from different disease stage. |
Top |
Malignant transformation related pathway analysis |
| Find out the enriched GO biological processes and KEGG pathways involved in transition from healthy to precancer to cancer |
| Tissue | Disease Stage | Enriched GO biological Processes |
| Colorectum | AD |  |
| Colorectum | SER |  |
| Colorectum | MSS |  |
| Colorectum | MSI-H |  |
| Colorectum | FAP |  |
| ∗Top 15 enriched GO BP terms are showed in the bar plot of each disease state in each tissue. Each row represents a significant GO biological process which is colored according to the -log10(p.adjust). |
| Page: 1 2 3 4 5 6 7 8 9 |
| GO ID | Tissue | Disease Stage | Description | Gene Ratio | Bg Ratio | pvalue | p.adjust | Count |
| Page: 1 |
| Pathway ID | Tissue | Disease Stage | Description | Gene Ratio | Bg Ratio | pvalue | p.adjust | qvalue | Count |
| hsa05012211 | Esophagus | ESCC | Parkinson disease | 201/4205 | 266/8465 | 1.56e-18 | 8.72e-17 | 4.46e-17 | 201 |
| hsa05022210 | Esophagus | ESCC | Pathways of neurodegeneration - multiple diseases | 318/4205 | 476/8465 | 6.10e-15 | 2.04e-13 | 1.05e-13 | 318 |
| hsa05010210 | Esophagus | ESCC | Alzheimer disease | 263/4205 | 384/8465 | 1.80e-14 | 5.47e-13 | 2.80e-13 | 263 |
| hsa05418211 | Esophagus | ESCC | Fluid shear stress and atherosclerosis | 109/4205 | 139/8465 | 2.00e-12 | 3.72e-11 | 1.90e-11 | 109 |
| hsa0421829 | Esophagus | ESCC | Cellular senescence | 119/4205 | 156/8465 | 5.89e-12 | 9.40e-11 | 4.81e-11 | 119 |
| hsa05170210 | Esophagus | ESCC | Human immunodeficiency virus 1 infection | 147/4205 | 212/8465 | 3.37e-09 | 3.53e-08 | 1.81e-08 | 147 |
| hsa05167211 | Esophagus | ESCC | Kaposi sarcoma-associated herpesvirus infection | 136/4205 | 194/8465 | 4.28e-09 | 4.22e-08 | 2.16e-08 | 136 |
| hsa05417211 | Esophagus | ESCC | Lipid and atherosclerosis | 143/4205 | 215/8465 | 3.30e-07 | 2.45e-06 | 1.26e-06 | 143 |
| hsa05163210 | Esophagus | ESCC | Human cytomegalovirus infection | 148/4205 | 225/8465 | 5.73e-07 | 4.00e-06 | 2.05e-06 | 148 |
| hsa046259 | Esophagus | ESCC | C-type lectin receptor signaling pathway | 73/4205 | 104/8465 | 1.57e-05 | 7.98e-05 | 4.09e-05 | 73 |
| hsa0472225 | Esophagus | ESCC | Neurotrophin signaling pathway | 80/4205 | 119/8465 | 7.33e-05 | 3.07e-04 | 1.57e-04 | 80 |
| hsa049109 | Esophagus | ESCC | Insulin signaling pathway | 89/4205 | 137/8465 | 1.97e-04 | 7.32e-04 | 3.75e-04 | 89 |
| hsa0521417 | Esophagus | ESCC | Glioma | 52/4205 | 75/8465 | 4.20e-04 | 1.45e-03 | 7.43e-04 | 52 |
| hsa051527 | Esophagus | ESCC | Tuberculosis | 111/4205 | 180/8465 | 7.14e-04 | 2.32e-03 | 1.19e-03 | 111 |
| hsa051339 | Esophagus | ESCC | Pertussis | 48/4205 | 76/8465 | 1.21e-02 | 2.77e-02 | 1.42e-02 | 48 |
| hsa0492214 | Esophagus | ESCC | Glucagon signaling pathway | 64/4205 | 107/8465 | 2.18e-02 | 4.80e-02 | 2.46e-02 | 64 |
| hsa041146 | Esophagus | ESCC | Oocyte meiosis | 77/4205 | 131/8465 | 2.19e-02 | 4.80e-02 | 2.46e-02 | 77 |
| hsa05012310 | Esophagus | ESCC | Parkinson disease | 201/4205 | 266/8465 | 1.56e-18 | 8.72e-17 | 4.46e-17 | 201 |
| hsa0502238 | Esophagus | ESCC | Pathways of neurodegeneration - multiple diseases | 318/4205 | 476/8465 | 6.10e-15 | 2.04e-13 | 1.05e-13 | 318 |
| hsa0501038 | Esophagus | ESCC | Alzheimer disease | 263/4205 | 384/8465 | 1.80e-14 | 5.47e-13 | 2.80e-13 | 263 |
| Page: 1 2 3 4 5 6 7 |
Top |
Cell-cell communication analysis |
| Identification of potential cell-cell interactions between two cell types and their ligand-receptor pairs for different disease states |
| Ligand | Receptor | LRpair | Pathway | Tissue | Disease Stage |
| Page: 1 |
Top |
Single-cell gene regulatory network inference analysis |
| Find out the significant the regulons (TFs) and the target genes of each regulon across cell types for different disease states |
| TF | Cell Type | Tissue | Disease Stage | Target Gene | RSS | Regulon Activity |
| ∗The dot plots of a searched regulon are shown for all cell subpopulations in each disease state of each tissue based on the regulon specific score inferred using pySCENIC and by calculating the average expression. |
| Page: 1 |
Top |
Somatic mutation of malignant transformation related genes |
| Annotation of somatic variants for genes involved in malignant transformation |
| Hugo Symbol | Variant Class | Variant Classification | dbSNP RS | HGVSc | HGVSp | HGVSp Short | SWISSPROT | BIOTYPE | SIFT | PolyPhen | Tumor Sample Barcode | Tissue | Histology | Sex | Age | Stage | Therapy Types | Drugs | Outcome |
| CALML4 | SNV | Missense_Mutation | c.74N>A | p.Gly25Glu | p.G25E | Q96GE6 | protein_coding | tolerated_low_confidence(0.29) | benign(0.001) | TCGA-FU-A3HZ-01 | Cervix | cervical & endocervical cancer | Female | <65 | I/II | Chemotherapy | cisplatin | CR | |
| CALML4 | SNV | Missense_Mutation | novel | c.456N>C | p.Lys152Asn | p.K152N | Q96GE6 | protein_coding | tolerated(0.06) | probably_damaging(0.993) | TCGA-AY-4070-01 | Colorectum | colon adenocarcinoma | Female | <65 | III/IV | Chemotherapy | 5-fu | PD |
| CALML4 | SNV | Missense_Mutation | c.122N>A | p.Gly41Asp | p.G41D | Q96GE6 | protein_coding | tolerated(0.1) | benign(0) | TCGA-AY-6197-01 | Colorectum | colon adenocarcinoma | Male | <65 | I/II | Unknown | Unknown | SD | |
| CALML4 | SNV | Missense_Mutation | rs750544784 | c.223N>A | p.Asp75Asn | p.D75N | Q96GE6 | protein_coding | deleterious(0) | probably_damaging(0.986) | TCGA-AP-A059-01 | Endometrium | uterine corpus endometrioid carcinoma | Female | >=65 | I/II | Unknown | Unknown | SD |
| CALML4 | SNV | Missense_Mutation | novel | c.16N>G | p.Leu6Val | p.L6V | Q96GE6 | protein_coding | deleterious_low_confidence(0) | possibly_damaging(0.714) | TCGA-AP-A1DV-01 | Endometrium | uterine corpus endometrioid carcinoma | Female | <65 | I/II | Unknown | Unknown | SD |
| CALML4 | SNV | Missense_Mutation | novel | c.329C>T | p.Ser110Phe | p.S110F | Q96GE6 | protein_coding | deleterious(0.04) | possibly_damaging(0.546) | TCGA-AX-A1CE-01 | Endometrium | uterine corpus endometrioid carcinoma | Female | <65 | I/II | Unspecific | Paclitaxel | SD |
| CALML4 | SNV | Missense_Mutation | rs750544784 | c.223N>A | p.Asp75Asn | p.D75N | Q96GE6 | protein_coding | deleterious(0) | probably_damaging(0.986) | TCGA-B5-A1MR-01 | Endometrium | uterine corpus endometrioid carcinoma | Female | >=65 | III/IV | Unknown | Unknown | SD |
| CALML4 | SNV | Missense_Mutation | novel | c.388N>A | p.Leu130Ile | p.L130I | Q96GE6 | protein_coding | tolerated(0.08) | probably_damaging(0.942) | TCGA-BK-A6W3-01 | Endometrium | uterine corpus endometrioid carcinoma | Female | <65 | I/II | Unknown | Unknown | SD |
| CALML4 | SNV | Missense_Mutation | rs777156448 | c.353N>C | p.Met118Thr | p.M118T | Q96GE6 | protein_coding | tolerated(0.2) | benign(0.001) | TCGA-D1-A175-01 | Endometrium | uterine corpus endometrioid carcinoma | Female | <65 | I/II | Chemotherapy | paclitaxel | SD |
| CALML4 | SNV | Missense_Mutation | c.502N>A | p.Leu168Ile | p.L168I | Q96GE6 | protein_coding | deleterious(0.05) | benign(0.39) | TCGA-D1-A17Q-01 | Endometrium | uterine corpus endometrioid carcinoma | Female | <65 | I/II | Unknown | Unknown | SD |
| Page: 1 2 |
Top |
Related drugs of malignant transformation related genes |
| Identification of chemicals and drugs interact with genes involved in malignant transfromation |
| (DGIdb 4.0) |
| Entrez ID | Symbol | Category | Interaction Types | Drug Claim Name | Drug Name | PMIDs |
| Page: 1 |

Copyright 2023-Present -The University of Texas Health Science Center at Houston |