| Tissue | Expression Dynamics | Abbreviation |
| Breast |  | IDC: Invasive ductal carcinoma |
| DCIS: Ductal carcinoma in situ |
| Precancer(BRCA1-mut): Precancerous lesion from BRCA1 mutation carriers |
| Cervix | 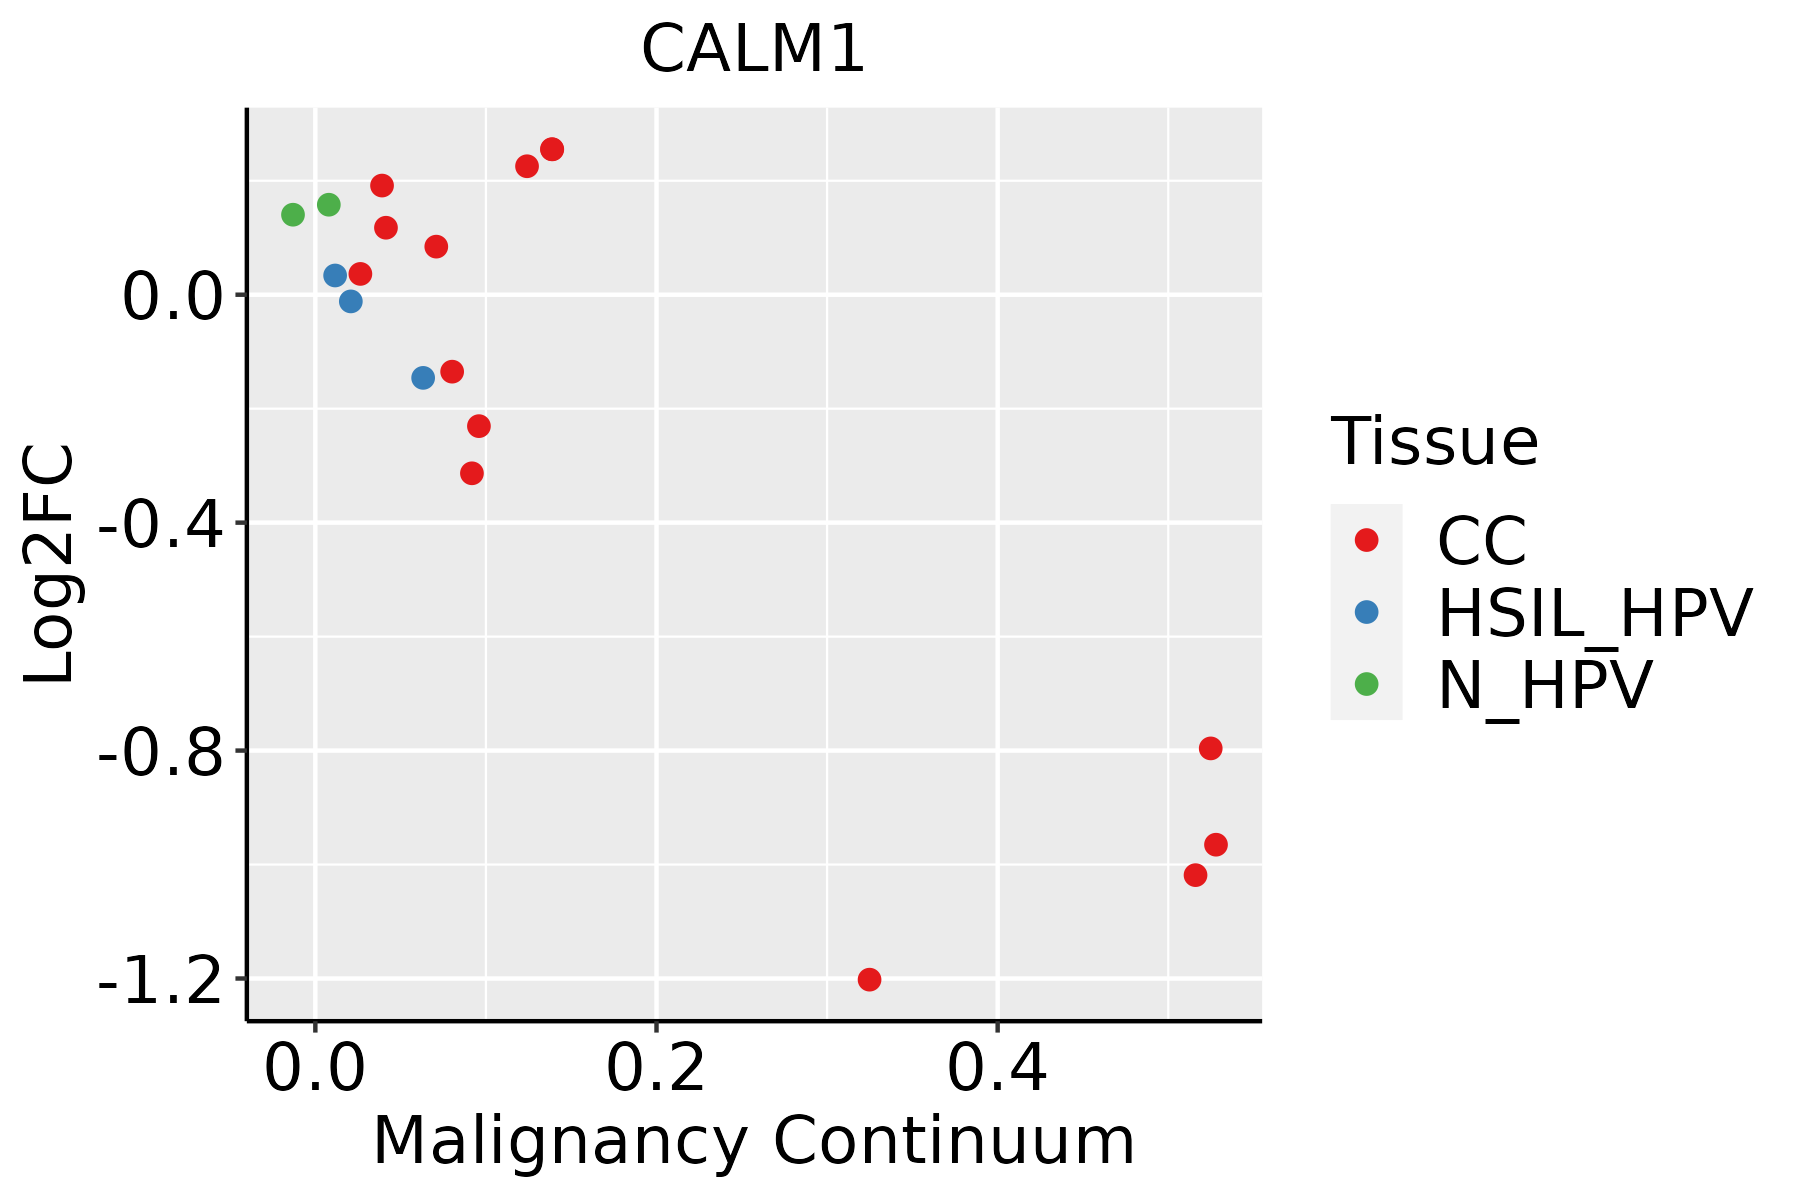 | CC: Cervix cancer |
| HSIL_HPV: HPV-infected high-grade squamous intraepithelial lesions |
| N_HPV: HPV-infected normal cervix |
| Colorectum (GSE201348) |  | FAP: Familial adenomatous polyposis |
| CRC: Colorectal cancer |
| Colorectum (HTA11) |  | AD: Adenomas |
| SER: Sessile serrated lesions |
| MSI-H: Microsatellite-high colorectal cancer |
| MSS: Microsatellite stable colorectal cancer |
| Endometrium |  | AEH: Atypical endometrial hyperplasia |
| EEC: Endometrioid Cancer |
| Esophagus | 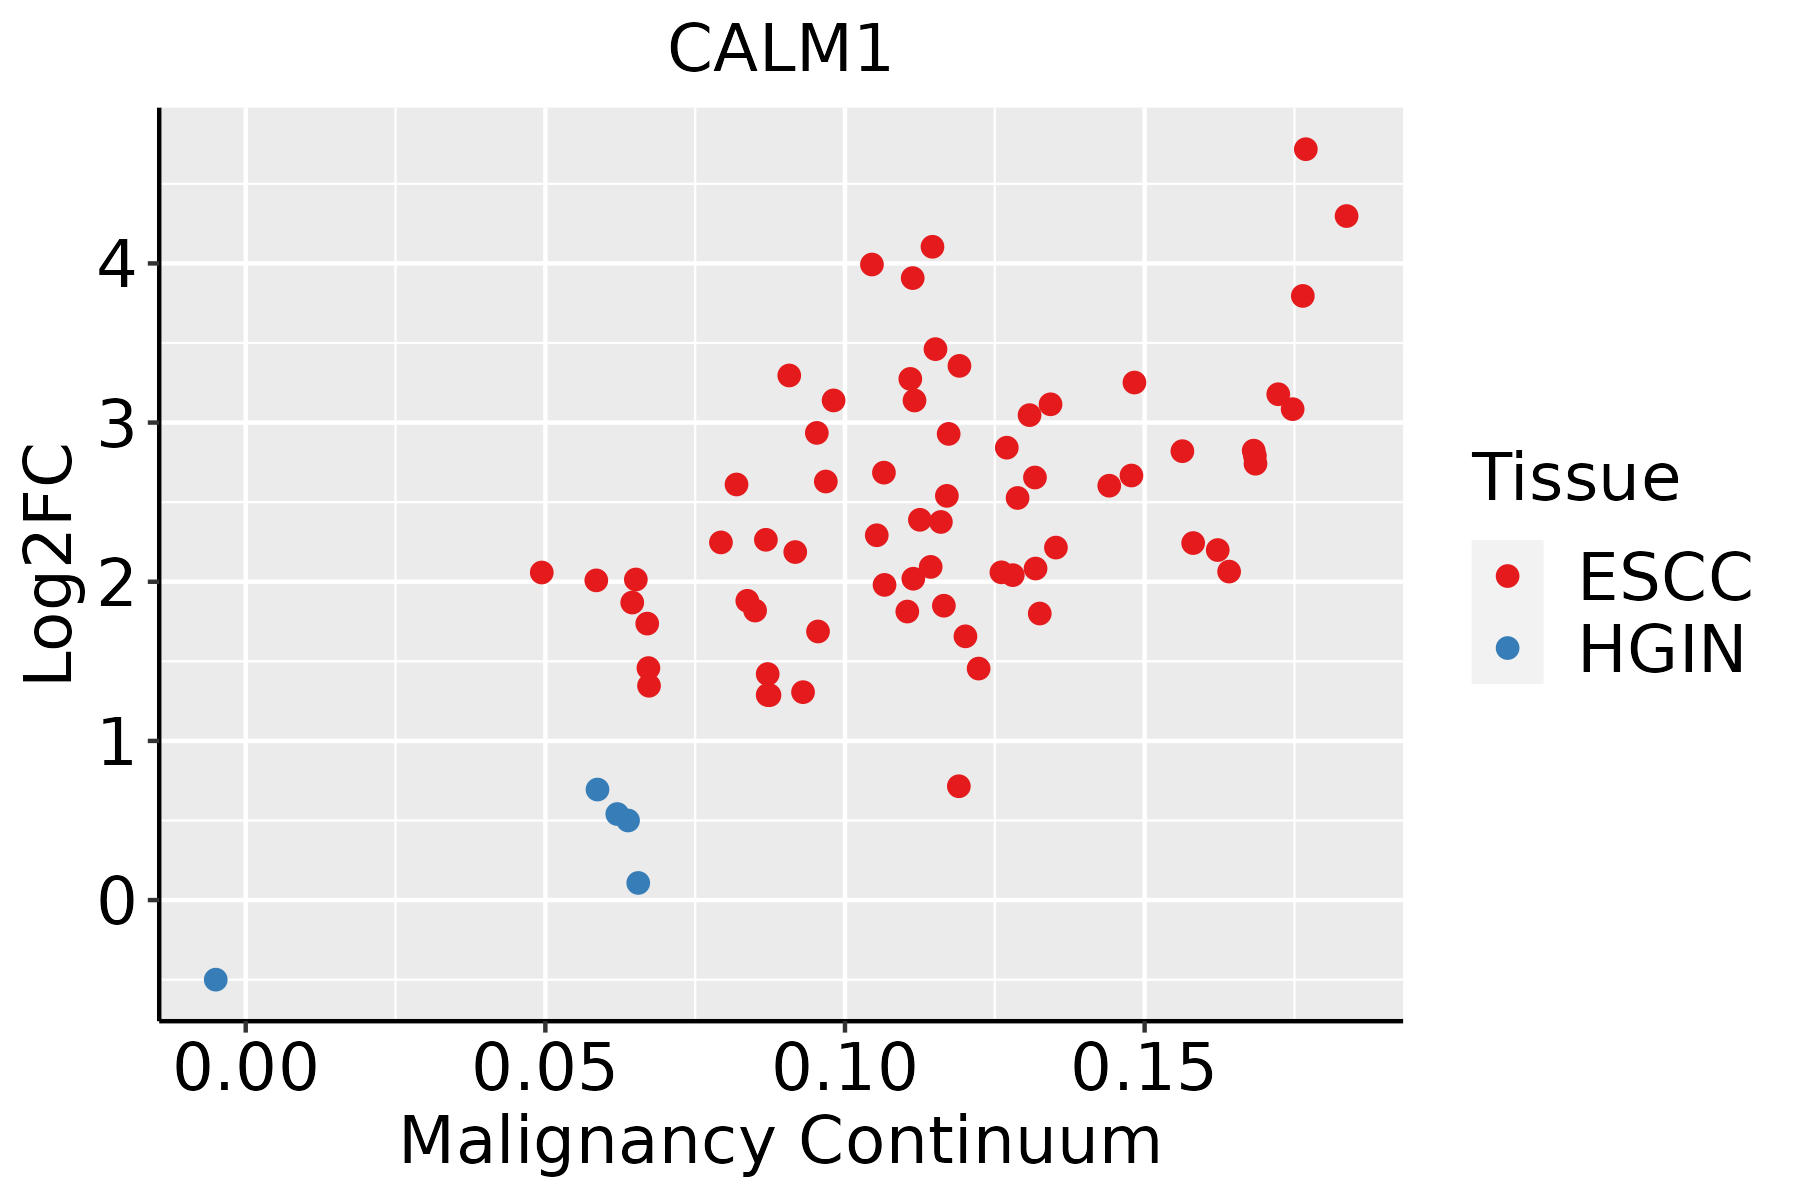 | ESCC: Esophageal squamous cell carcinoma |
| HGIN: High-grade intraepithelial neoplasias |
| LGIN: Low-grade intraepithelial neoplasias |
| Liver |  | HCC: Hepatocellular carcinoma |
| NAFLD: Non-alcoholic fatty liver disease |
| Oral Cavity | 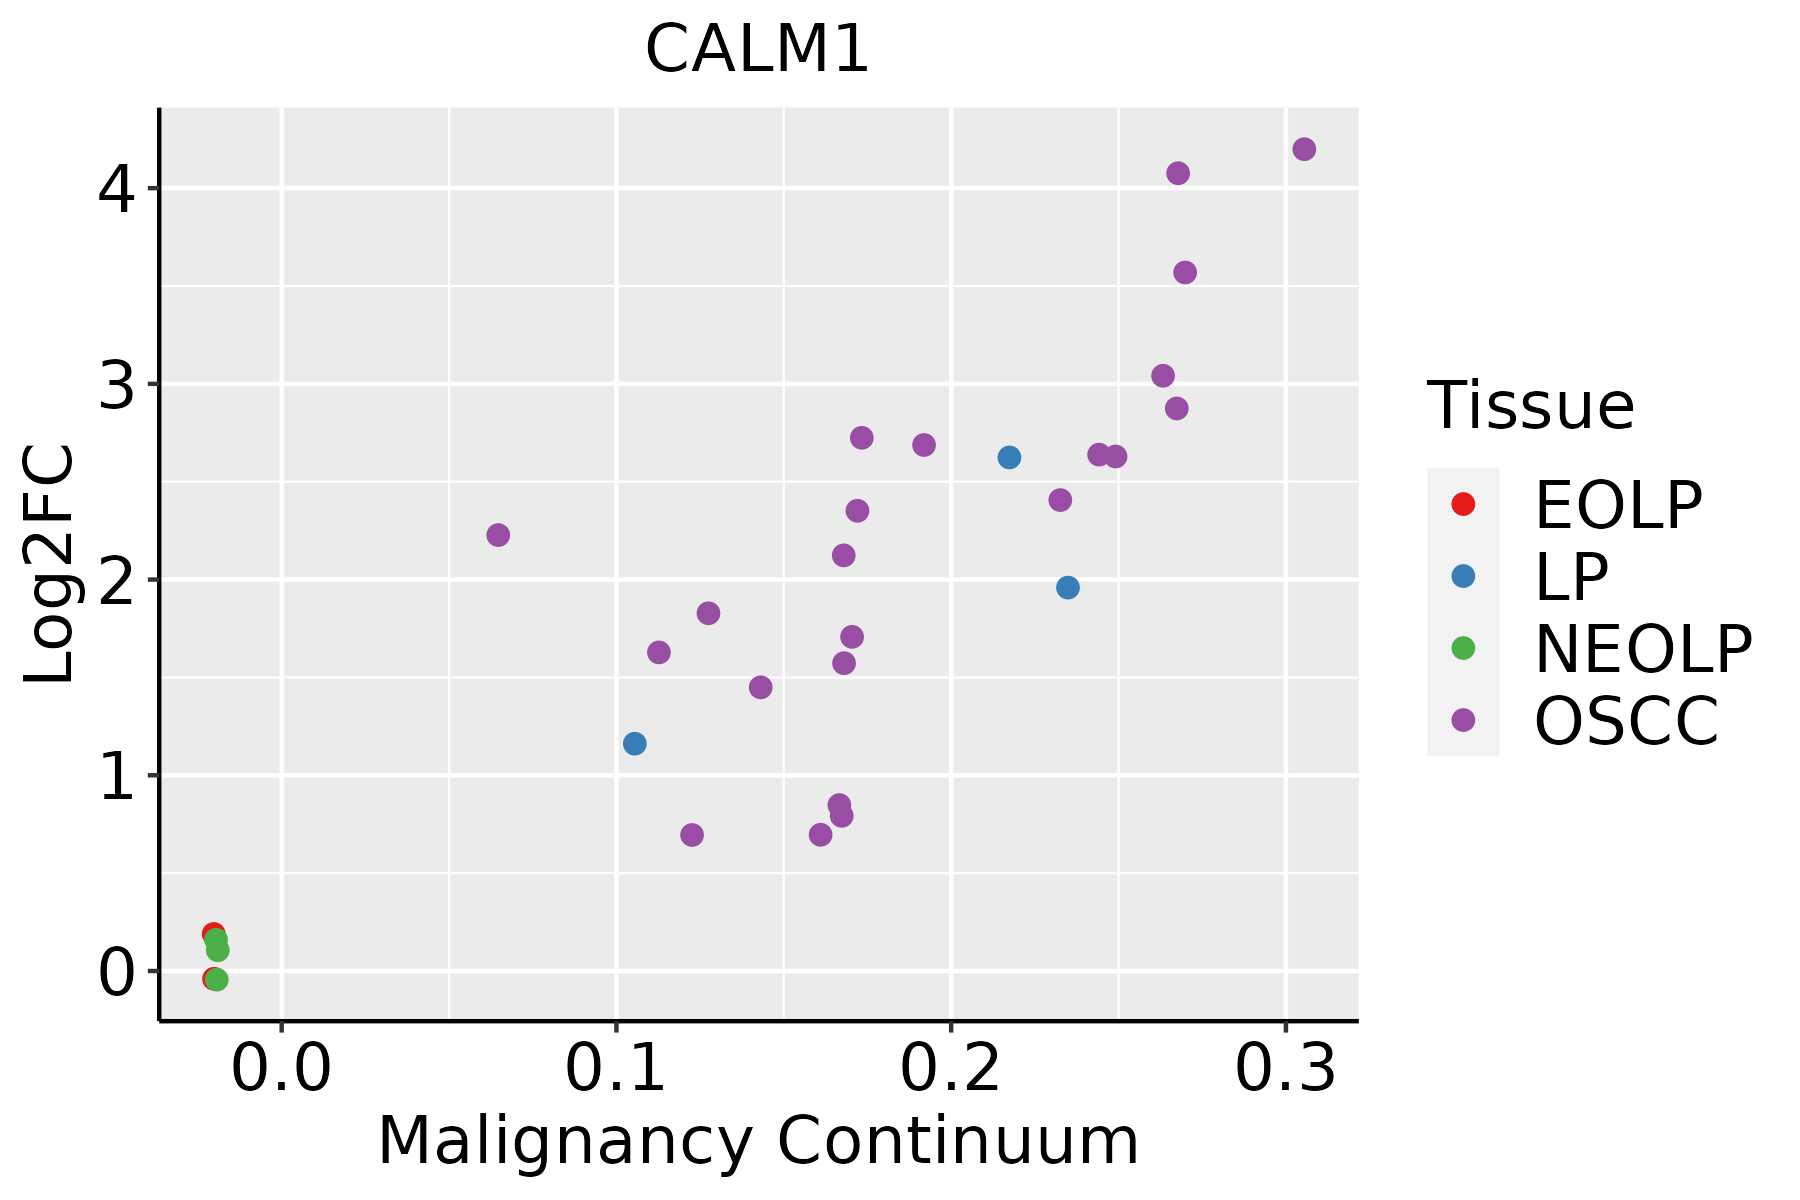 | EOLP: Erosive Oral lichen planus |
| LP: leukoplakia |
| NEOLP: Non-erosive oral lichen planus |
| OSCC: Oral squamous cell carcinoma |
| Prostate | 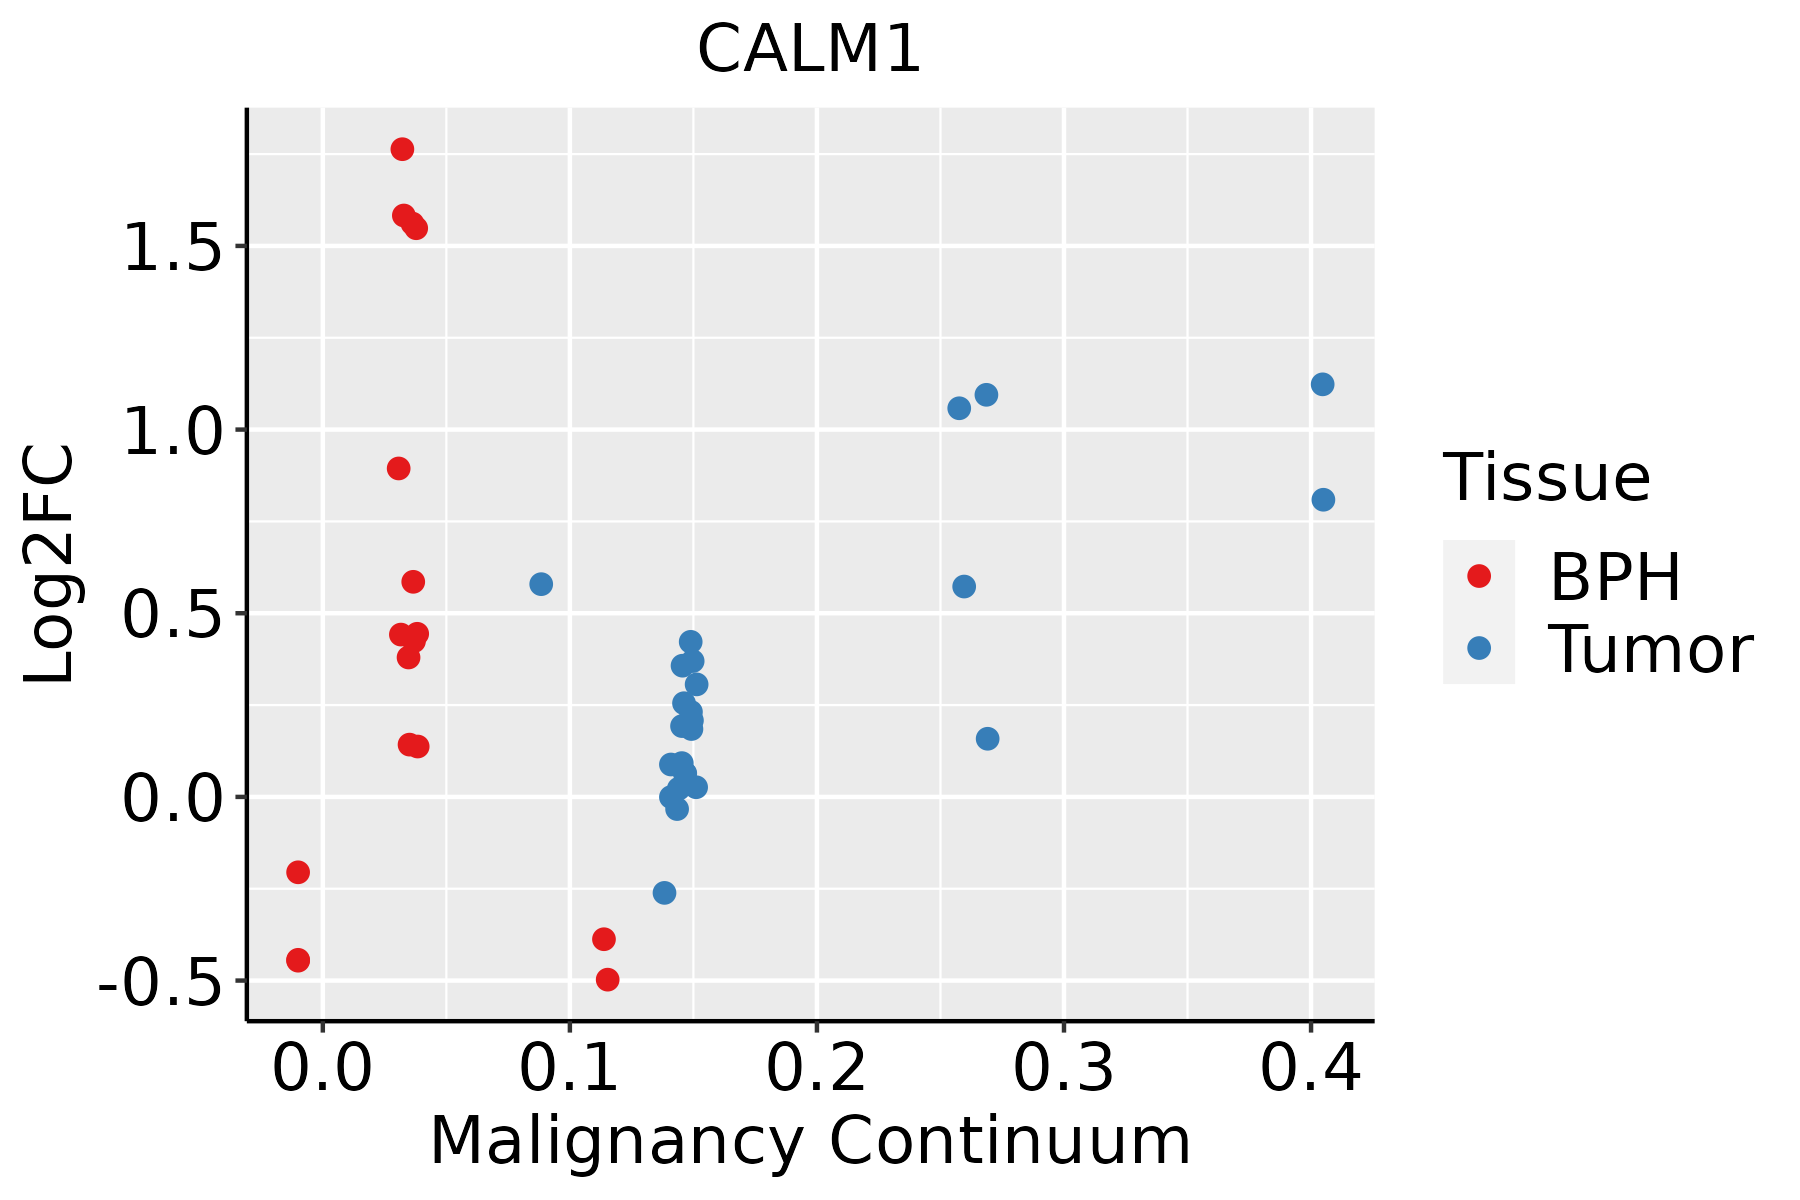 | BPH: Benign Prostatic Hyperplasia |
| Skin |  | AK: Actinic keratosis |
| cSCC: Cutaneous squamous cell carcinoma |
| SCCIS:squamous cell carcinoma in situ |
| Thyroid |  | ATC: Anaplastic thyroid cancer |
| HT: Hashimoto's thyroiditis |
| PTC: Papillary thyroid cancer |
| GO ID | Tissue | Disease Stage | Description | Gene Ratio | Bg Ratio | pvalue | p.adjust | Count |
| GO:00485459 | Breast | Precancer | response to steroid hormone | 53/1080 | 339/18723 | 3.07e-11 | 3.66e-09 | 53 |
| GO:00217629 | Breast | Precancer | substantia nigra development | 15/1080 | 44/18723 | 1.12e-08 | 7.98e-07 | 15 |
| GO:00319608 | Breast | Precancer | response to corticosteroid | 30/1080 | 167/18723 | 2.50e-08 | 1.65e-06 | 30 |
| GO:00309018 | Breast | Precancer | midbrain development | 20/1080 | 90/18723 | 1.50e-07 | 7.93e-06 | 20 |
| GO:00513848 | Breast | Precancer | response to glucocorticoid | 26/1080 | 148/18723 | 3.32e-07 | 1.57e-05 | 26 |
| GO:00100389 | Breast | Precancer | response to metal ion | 47/1080 | 373/18723 | 3.88e-07 | 1.79e-05 | 47 |
| GO:00488578 | Breast | Precancer | neural nucleus development | 16/1080 | 64/18723 | 4.76e-07 | 2.11e-05 | 16 |
| GO:00511019 | Breast | Precancer | regulation of DNA binding | 22/1080 | 118/18723 | 9.28e-07 | 3.71e-05 | 22 |
| GO:00433887 | Breast | Precancer | positive regulation of DNA binding | 14/1080 | 56/18723 | 2.46e-06 | 8.35e-05 | 14 |
| GO:00510989 | Breast | Precancer | regulation of binding | 44/1080 | 363/18723 | 2.59e-06 | 8.65e-05 | 44 |
| GO:00512358 | Breast | Precancer | maintenance of location | 40/1080 | 327/18723 | 5.85e-06 | 1.71e-04 | 40 |
| GO:00516519 | Breast | Precancer | maintenance of location in cell | 30/1080 | 214/18723 | 5.91e-06 | 1.71e-04 | 30 |
| GO:00705858 | Breast | Precancer | protein localization to mitochondrion | 21/1080 | 125/18723 | 9.07e-06 | 2.42e-04 | 21 |
| GO:00070066 | Breast | Precancer | mitochondrial membrane organization | 20/1080 | 116/18723 | 9.88e-06 | 2.61e-04 | 20 |
| GO:00726558 | Breast | Precancer | establishment of protein localization to mitochondrion | 20/1080 | 120/18723 | 1.66e-05 | 4.03e-04 | 20 |
| GO:00510999 | Breast | Precancer | positive regulation of binding | 23/1080 | 173/18723 | 1.58e-04 | 2.68e-03 | 23 |
| GO:19018445 | Breast | Precancer | regulation of cell communication by electrical coupling involved in cardiac conduction | 5/1080 | 11/18723 | 2.18e-04 | 3.35e-03 | 5 |
| GO:00901516 | Breast | Precancer | establishment of protein localization to mitochondrial membrane | 8/1080 | 30/18723 | 2.24e-04 | 3.40e-03 | 8 |
| GO:00224119 | Breast | Precancer | cellular component disassembly | 44/1080 | 443/18723 | 3.17e-04 | 4.51e-03 | 44 |
| GO:00860643 | Breast | Precancer | cell communication by electrical coupling involved in cardiac conduction | 7/1080 | 25/18723 | 4.00e-04 | 5.42e-03 | 7 |
| Pathway ID | Tissue | Disease Stage | Description | Gene Ratio | Bg Ratio | pvalue | p.adjust | qvalue | Count |
| hsa0501218 | Breast | Precancer | Parkinson disease | 99/684 | 266/8465 | 3.58e-42 | 5.65e-40 | 4.33e-40 | 99 |
| hsa0501016 | Breast | Precancer | Alzheimer disease | 103/684 | 384/8465 | 1.03e-29 | 4.66e-28 | 3.57e-28 | 103 |
| hsa0502216 | Breast | Precancer | Pathways of neurodegeneration - multiple diseases | 112/684 | 476/8465 | 6.96e-27 | 2.44e-25 | 1.87e-25 | 112 |
| hsa0516718 | Breast | Precancer | Kaposi sarcoma-associated herpesvirus infection | 36/684 | 194/8465 | 1.68e-06 | 2.53e-05 | 1.94e-05 | 36 |
| hsa0491518 | Breast | Precancer | Estrogen signaling pathway | 28/684 | 138/8465 | 4.10e-06 | 5.39e-05 | 4.13e-05 | 28 |
| hsa0541818 | Breast | Precancer | Fluid shear stress and atherosclerosis | 28/684 | 139/8465 | 4.74e-06 | 6.00e-05 | 4.59e-05 | 28 |
| hsa0541718 | Breast | Precancer | Lipid and atherosclerosis | 37/684 | 215/8465 | 7.64e-06 | 9.29e-05 | 7.12e-05 | 37 |
| hsa042189 | Breast | Precancer | Cellular senescence | 29/684 | 156/8465 | 1.66e-05 | 1.69e-04 | 1.30e-04 | 29 |
| hsa05031 | Breast | Precancer | Amphetamine addiction | 14/684 | 69/8465 | 1.05e-03 | 7.35e-03 | 5.63e-03 | 14 |
| hsa0516316 | Breast | Precancer | Human cytomegalovirus infection | 32/684 | 225/8465 | 1.13e-03 | 7.57e-03 | 5.80e-03 | 32 |
| hsa0497114 | Breast | Precancer | Gastric acid secretion | 13/684 | 76/8465 | 7.35e-03 | 4.07e-02 | 3.12e-02 | 13 |
| hsa0501219 | Breast | Precancer | Parkinson disease | 99/684 | 266/8465 | 3.58e-42 | 5.65e-40 | 4.33e-40 | 99 |
| hsa0501017 | Breast | Precancer | Alzheimer disease | 103/684 | 384/8465 | 1.03e-29 | 4.66e-28 | 3.57e-28 | 103 |
| hsa0502217 | Breast | Precancer | Pathways of neurodegeneration - multiple diseases | 112/684 | 476/8465 | 6.96e-27 | 2.44e-25 | 1.87e-25 | 112 |
| hsa0516719 | Breast | Precancer | Kaposi sarcoma-associated herpesvirus infection | 36/684 | 194/8465 | 1.68e-06 | 2.53e-05 | 1.94e-05 | 36 |
| hsa0491519 | Breast | Precancer | Estrogen signaling pathway | 28/684 | 138/8465 | 4.10e-06 | 5.39e-05 | 4.13e-05 | 28 |
| hsa0541819 | Breast | Precancer | Fluid shear stress and atherosclerosis | 28/684 | 139/8465 | 4.74e-06 | 6.00e-05 | 4.59e-05 | 28 |
| hsa0541719 | Breast | Precancer | Lipid and atherosclerosis | 37/684 | 215/8465 | 7.64e-06 | 9.29e-05 | 7.12e-05 | 37 |
| hsa0421814 | Breast | Precancer | Cellular senescence | 29/684 | 156/8465 | 1.66e-05 | 1.69e-04 | 1.30e-04 | 29 |
| hsa050311 | Breast | Precancer | Amphetamine addiction | 14/684 | 69/8465 | 1.05e-03 | 7.35e-03 | 5.63e-03 | 14 |
| Hugo Symbol | Variant Class | Variant Classification | dbSNP RS | HGVSc | HGVSp | HGVSp Short | SWISSPROT | BIOTYPE | SIFT | PolyPhen | Tumor Sample Barcode | Tissue | Histology | Sex | Age | Stage | Therapy Types | Drugs | Outcome |
| CALM1 | SNV | Missense_Mutation | | c.400N>A | p.Asp134Asn | p.D134N | P62158 | protein_coding | deleterious_low_confidence(0.03) | possibly_damaging(0.574) | TCGA-C5-A1BK-01 | Cervix | cervical & endocervical cancer | Female | <65 | I/II | Unknown | Unknown | SD |
| CALM1 | SNV | Missense_Mutation | | c.241N>A | p.Asp81Asn | p.D81N | P62158 | protein_coding | deleterious_low_confidence(0.03) | benign(0.043) | TCGA-C5-A1BQ-01 | Cervix | cervical & endocervical cancer | Female | >=65 | III/IV | Chemotherapy | cisplatin | CR |
| CALM1 | SNV | Missense_Mutation | | c.202G>A | p.Glu68Lys | p.E68K | P62158 | protein_coding | deleterious_low_confidence(0.01) | probably_damaging(0.932) | TCGA-AA-3977-01 | Colorectum | colon adenocarcinoma | Male | >=65 | I/II | Unknown | Unknown | SD |
| CALM1 | SNV | Missense_Mutation | | c.202N>A | p.Glu68Lys | p.E68K | P62158 | protein_coding | deleterious_low_confidence(0.01) | probably_damaging(0.932) | TCGA-AP-A1DV-01 | Endometrium | uterine corpus endometrioid carcinoma | Female | <65 | I/II | Unknown | Unknown | SD |
| CALM1 | SNV | Missense_Mutation | novel | c.169N>A | p.Asp57Asn | p.D57N | P62158 | protein_coding | deleterious_low_confidence(0) | probably_damaging(0.972) | TCGA-B5-A3FA-01 | Endometrium | uterine corpus endometrioid carcinoma | Female | >=65 | I/II | Unknown | Unknown | SD |
| CALM1 | SNV | Missense_Mutation | | c.210N>T | p.Leu70Phe | p.L70F | P62158 | protein_coding | deleterious_low_confidence(0.01) | possibly_damaging(0.67) | TCGA-05-4415-01 | Lung | lung adenocarcinoma | Male | <65 | III/IV | Unknown | Unknown | PD |
| CALM1 | SNV | Missense_Mutation | novel | c.219N>T | p.Met73Ile | p.M73I | P62158 | protein_coding | deleterious_low_confidence(0.02) | possibly_damaging(0.654) | TCGA-55-7907-01 | Lung | lung adenocarcinoma | Male | >=65 | I/II | Unknown | Unknown | PD |
| CALM1 | SNV | Missense_Mutation | novel | c.17N>T | p.Thr6Ile | p.T6I | P62158 | protein_coding | deleterious_low_confidence(0) | benign(0.272) | TCGA-60-2695-01 | Lung | lung squamous cell carcinoma | Female | >=65 | I/II | Unknown | Unknown | SD |
| CALM1 | SNV | Missense_Mutation | novel | c.76N>T | p.Gly26Cys | p.G26C | P62158 | protein_coding | deleterious_low_confidence(0.01) | probably_damaging(0.918) | TCGA-85-8287-01 | Lung | lung squamous cell carcinoma | Male | >=65 | I/II | Unknown | Unknown | SD |
| CALM1 | SNV | Missense_Mutation | novel | c.77N>T | p.Gly26Val | p.G26V | P62158 | protein_coding | deleterious_low_confidence(0) | probably_damaging(0.983) | TCGA-85-8287-01 | Lung | lung squamous cell carcinoma | Male | >=65 | I/II | Unknown | Unknown | SD |


