
|
|||||
|
 | |
| |
| |
| |
| |
| |
|
Gene: CALHM2 |
Gene summary for CALHM2 |
| Gene information | Species | Human | Gene symbol | CALHM2 | Gene ID | 51063 |
| Gene name | calcium homeostasis modulator family member 2 | |
| Gene Alias | FAM26B | |
| Cytomap | 10q24.33 | |
| Gene Type | protein-coding | GO ID | GO:0006810 | UniProtAcc | Q9HA72 |
Top |
Malignant transformation analysis |
| Identification of the aberrant gene expression in precancerous and cancerous lesions by comparing the gene expression of stem-like cells in diseased tissues with normal stem cells |
| Entrez ID | Symbol | Replicates | Species | Organ | Tissue | Adj P-value | Log2FC | Malignancy |
| 51063 | CALHM2 | LZE24T | Human | Esophagus | ESCC | 6.21e-04 | 1.05e-01 | 0.0596 |
| 51063 | CALHM2 | LZE6T | Human | Esophagus | ESCC | 5.65e-04 | 2.28e-01 | 0.0845 |
| 51063 | CALHM2 | P2T-E | Human | Esophagus | ESCC | 1.08e-05 | 1.80e-01 | 0.1177 |
| 51063 | CALHM2 | P4T-E | Human | Esophagus | ESCC | 3.01e-08 | 2.19e-01 | 0.1323 |
| 51063 | CALHM2 | P8T-E | Human | Esophagus | ESCC | 7.31e-03 | 9.46e-02 | 0.0889 |
| 51063 | CALHM2 | P9T-E | Human | Esophagus | ESCC | 2.49e-03 | 1.73e-01 | 0.1131 |
| 51063 | CALHM2 | P10T-E | Human | Esophagus | ESCC | 1.78e-03 | 9.48e-02 | 0.116 |
| 51063 | CALHM2 | P11T-E | Human | Esophagus | ESCC | 2.90e-03 | 2.14e-01 | 0.1426 |
| 51063 | CALHM2 | P12T-E | Human | Esophagus | ESCC | 3.06e-11 | 2.74e-01 | 0.1122 |
| 51063 | CALHM2 | P15T-E | Human | Esophagus | ESCC | 1.49e-05 | 3.18e-01 | 0.1149 |
| 51063 | CALHM2 | P16T-E | Human | Esophagus | ESCC | 4.27e-57 | 1.37e+00 | 0.1153 |
| 51063 | CALHM2 | P21T-E | Human | Esophagus | ESCC | 2.15e-03 | 1.18e-01 | 0.1617 |
| 51063 | CALHM2 | P22T-E | Human | Esophagus | ESCC | 2.29e-09 | 1.91e-01 | 0.1236 |
| 51063 | CALHM2 | P24T-E | Human | Esophagus | ESCC | 2.97e-07 | 1.98e-01 | 0.1287 |
| 51063 | CALHM2 | P26T-E | Human | Esophagus | ESCC | 2.33e-17 | 3.14e-01 | 0.1276 |
| 51063 | CALHM2 | P27T-E | Human | Esophagus | ESCC | 1.74e-09 | 2.86e-01 | 0.1055 |
| 51063 | CALHM2 | P28T-E | Human | Esophagus | ESCC | 6.07e-10 | 1.97e-01 | 0.1149 |
| 51063 | CALHM2 | P31T-E | Human | Esophagus | ESCC | 1.18e-05 | 1.51e-01 | 0.1251 |
| 51063 | CALHM2 | P32T-E | Human | Esophagus | ESCC | 4.98e-04 | 1.47e-01 | 0.1666 |
| 51063 | CALHM2 | P42T-E | Human | Esophagus | ESCC | 2.49e-07 | 2.28e-01 | 0.1175 |
| Page: 1 2 |
| Tissue | Expression Dynamics | Abbreviation |
| Esophagus | 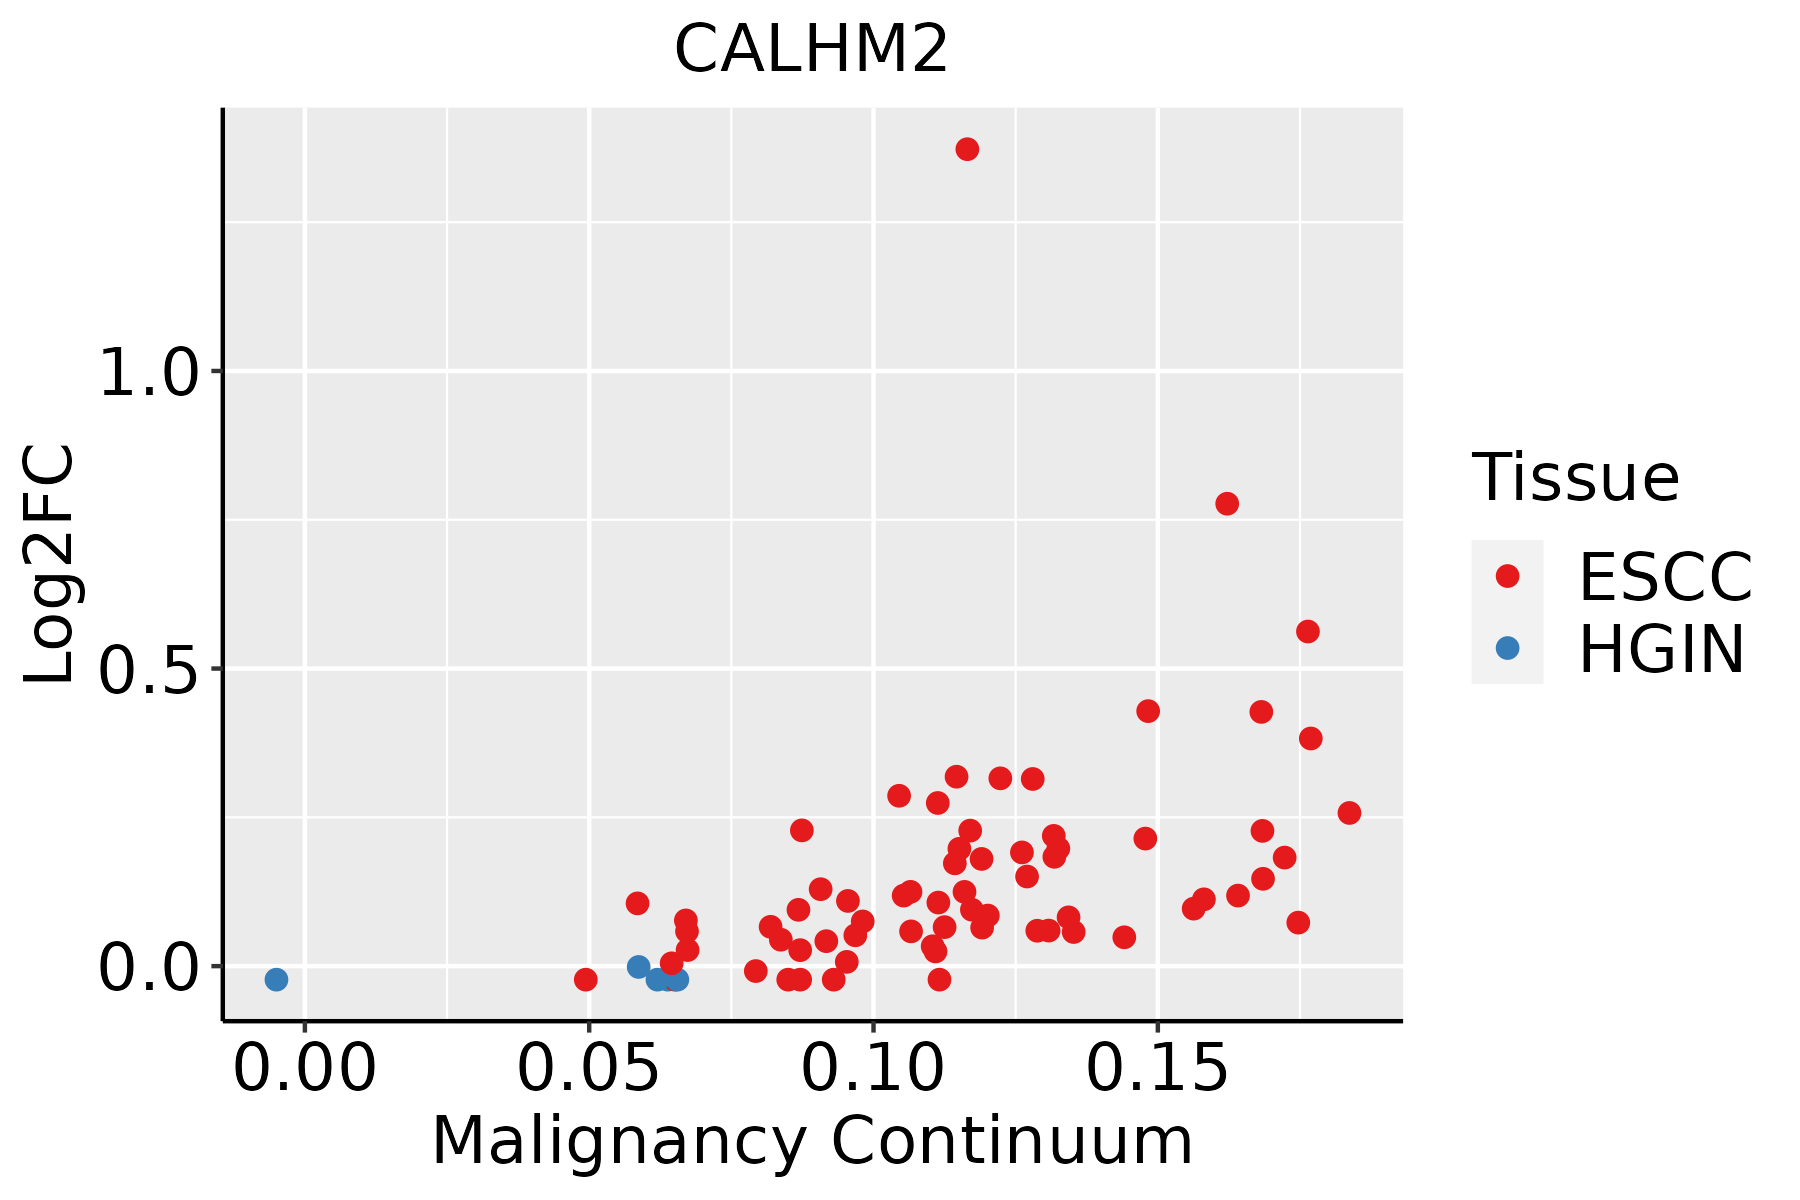 | ESCC: Esophageal squamous cell carcinoma |
| HGIN: High-grade intraepithelial neoplasias | ||
| LGIN: Low-grade intraepithelial neoplasias |
| ∗log2FC in expression of this searched gene in stem-like cells from each diseased tissue sample relative to stem-like cells in normal samples in each tissue plotted against the malignancy continuum. Samples are colored based on if they are from different disease stage. |
Top |
Malignant transformation related pathway analysis |
| Find out the enriched GO biological processes and KEGG pathways involved in transition from healthy to precancer to cancer |
| Tissue | Disease Stage | Enriched GO biological Processes |
| Colorectum | AD |  |
| Colorectum | SER |  |
| Colorectum | MSS |  |
| Colorectum | MSI-H |  |
| Colorectum | FAP |  |
| ∗Top 15 enriched GO BP terms are showed in the bar plot of each disease state in each tissue. Each row represents a significant GO biological process which is colored according to the -log10(p.adjust). |
| Page: 1 2 3 4 5 6 7 8 9 |
| GO ID | Tissue | Disease Stage | Description | Gene Ratio | Bg Ratio | pvalue | p.adjust | Count |
| Page: 1 |
| Pathway ID | Tissue | Disease Stage | Description | Gene Ratio | Bg Ratio | pvalue | p.adjust | qvalue | Count |
| Page: 1 |
Top |
Cell-cell communication analysis |
| Identification of potential cell-cell interactions between two cell types and their ligand-receptor pairs for different disease states |
| Ligand | Receptor | LRpair | Pathway | Tissue | Disease Stage |
| Page: 1 |
Top |
Single-cell gene regulatory network inference analysis |
| Find out the significant the regulons (TFs) and the target genes of each regulon across cell types for different disease states |
| TF | Cell Type | Tissue | Disease Stage | Target Gene | RSS | Regulon Activity |
| ∗The dot plots of a searched regulon are shown for all cell subpopulations in each disease state of each tissue based on the regulon specific score inferred using pySCENIC and by calculating the average expression. |
| Page: 1 |
Top |
Somatic mutation of malignant transformation related genes |
| Annotation of somatic variants for genes involved in malignant transformation |
| Hugo Symbol | Variant Class | Variant Classification | dbSNP RS | HGVSc | HGVSp | HGVSp Short | SWISSPROT | BIOTYPE | SIFT | PolyPhen | Tumor Sample Barcode | Tissue | Histology | Sex | Age | Stage | Therapy Types | Drugs | Outcome |
| CALHM2 | SNV | Missense_Mutation | rs554630072 | c.718N>T | p.Arg240Trp | p.R240W | Q9HA72 | protein_coding | deleterious(0) | benign(0.091) | TCGA-AN-A046-01 | Breast | breast invasive carcinoma | Female | >=65 | I/II | Unknown | Unknown | SD |
| CALHM2 | SNV | Missense_Mutation | c.764C>T | p.Ala255Val | p.A255V | Q9HA72 | protein_coding | tolerated(0.31) | possibly_damaging(0.509) | TCGA-AR-A1AL-01 | Breast | breast invasive carcinoma | Female | <65 | III/IV | Hormone Therapy | anastrozole | SD | |
| CALHM2 | deletion | Frame_Shift_Del | novel | c.302_303delNN | p.Leu101ProfsTer25 | p.L101Pfs*25 | Q9HA72 | protein_coding | TCGA-BH-A0GY-01 | Breast | breast invasive carcinoma | Female | >=65 | I/II | Chemotherapy | cyotxan | SD | ||
| CALHM2 | deletion | Frame_Shift_Del | c.745delN | p.Arg249AlafsTer15 | p.R249Afs*15 | Q9HA72 | protein_coding | TCGA-E2-A1IN-01 | Breast | breast invasive carcinoma | Female | <65 | I/II | Hormone Therapy | arimidex | SD | |||
| CALHM2 | SNV | Missense_Mutation | novel | c.532C>T | p.Arg178Cys | p.R178C | Q9HA72 | protein_coding | deleterious(0.01) | probably_damaging(0.962) | TCGA-2W-A8YY-01 | Cervix | cervical & endocervical cancer | Female | <65 | I/II | Chemotherapy | cisplatin | CR |
| CALHM2 | SNV | Missense_Mutation | novel | c.499N>C | p.Asp167His | p.D167H | Q9HA72 | protein_coding | tolerated(0.12) | benign(0.357) | TCGA-VS-A8EL-01 | Cervix | cervical & endocervical cancer | Female | <65 | I/II | Chemotherapy | cisplatin | CR |
| CALHM2 | SNV | Missense_Mutation | c.346N>G | p.Thr116Ala | p.T116A | Q9HA72 | protein_coding | tolerated(0.07) | possibly_damaging(0.881) | TCGA-AA-3663-01 | Colorectum | colon adenocarcinoma | Male | <65 | I/II | Unknown | Unknown | SD | |
| CALHM2 | SNV | Missense_Mutation | c.934G>A | p.Ala312Thr | p.A312T | Q9HA72 | protein_coding | tolerated_low_confidence(0.58) | benign(0) | TCGA-AY-6197-01 | Colorectum | colon adenocarcinoma | Male | <65 | I/II | Unknown | Unknown | SD | |
| CALHM2 | SNV | Missense_Mutation | rs369692383 | c.29N>A | p.Arg10His | p.R10H | Q9HA72 | protein_coding | deleterious_low_confidence(0.01) | benign(0.197) | TCGA-CM-4746-01 | Colorectum | colon adenocarcinoma | Male | <65 | I/II | Unknown | Unknown | SD |
| CALHM2 | SNV | Missense_Mutation | novel | c.91N>T | p.Gly31Cys | p.G31C | Q9HA72 | protein_coding | deleterious(0.02) | possibly_damaging(0.818) | TCGA-D5-6927-01 | Colorectum | colon adenocarcinoma | Male | <65 | I/II | Unknown | Unknown | SD |
| Page: 1 2 3 4 |
Top |
Related drugs of malignant transformation related genes |
| Identification of chemicals and drugs interact with genes involved in malignant transfromation |
| (DGIdb 4.0) |
| Entrez ID | Symbol | Category | Interaction Types | Drug Claim Name | Drug Name | PMIDs |
| Page: 1 |

Copyright 2023-Present -The University of Texas Health Science Center at Houston |