| Tissue | Expression Dynamics | Abbreviation |
| Breast |  | IDC: Invasive ductal carcinoma |
| DCIS: Ductal carcinoma in situ |
| Precancer(BRCA1-mut): Precancerous lesion from BRCA1 mutation carriers |
| Cervix | 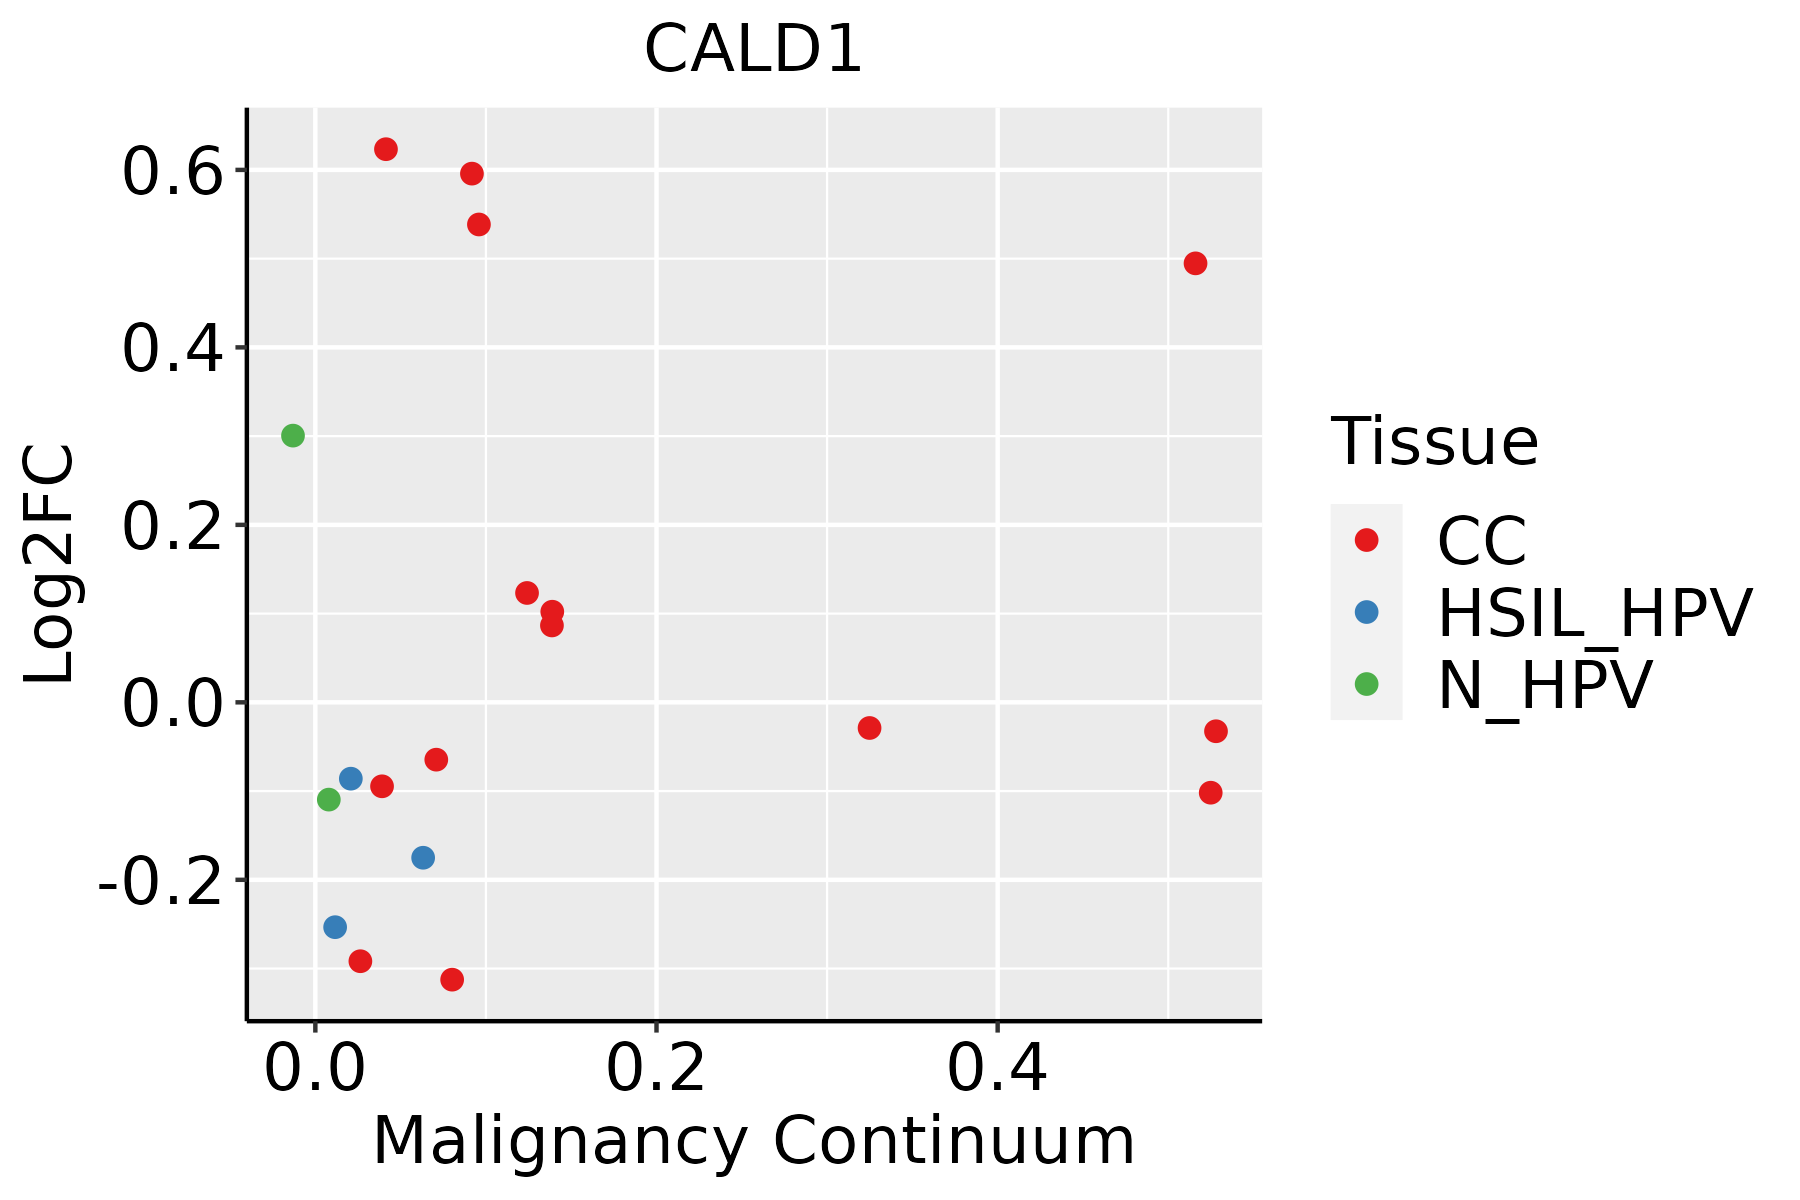 | CC: Cervix cancer |
| HSIL_HPV: HPV-infected high-grade squamous intraepithelial lesions |
| N_HPV: HPV-infected normal cervix |
| Endometrium |  | AEH: Atypical endometrial hyperplasia |
| EEC: Endometrioid Cancer |
| Esophagus | 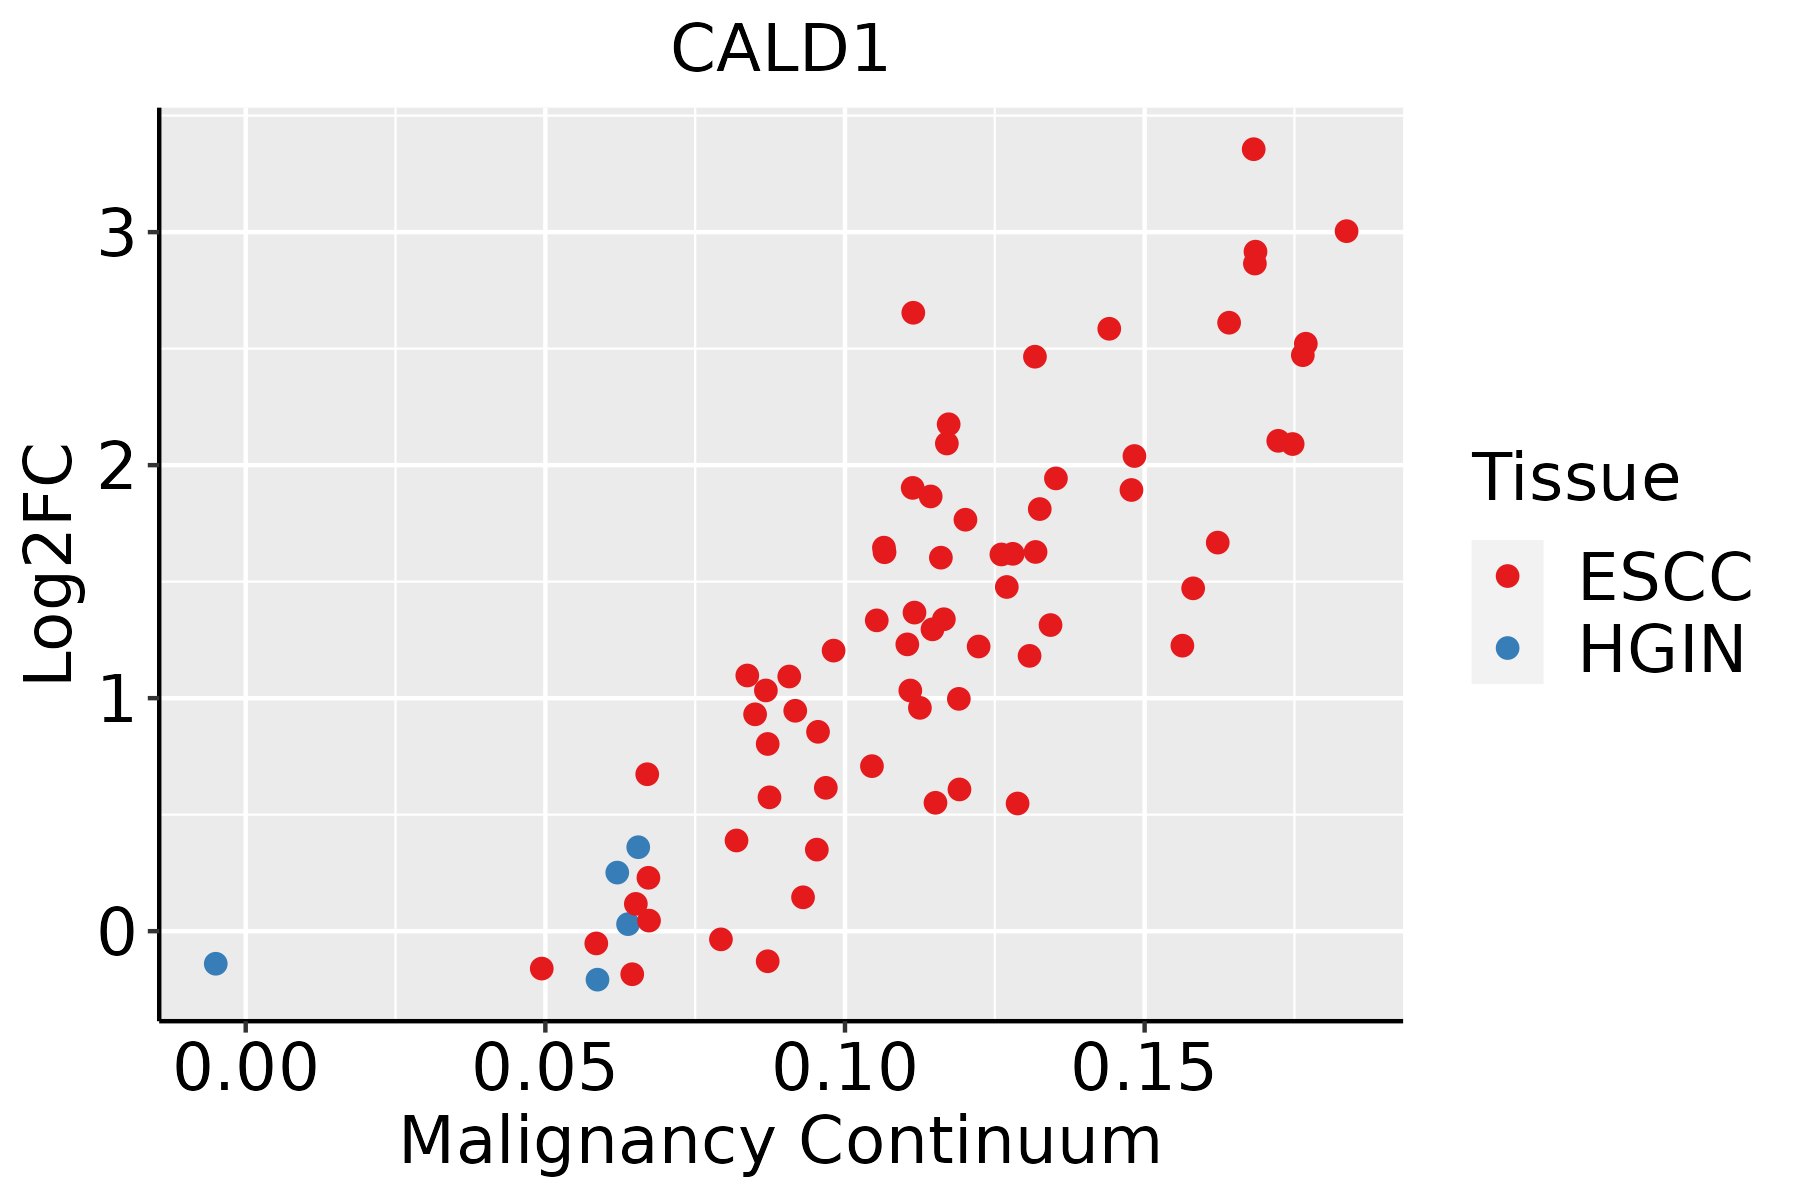 | ESCC: Esophageal squamous cell carcinoma |
| HGIN: High-grade intraepithelial neoplasias |
| LGIN: Low-grade intraepithelial neoplasias |
| Liver | 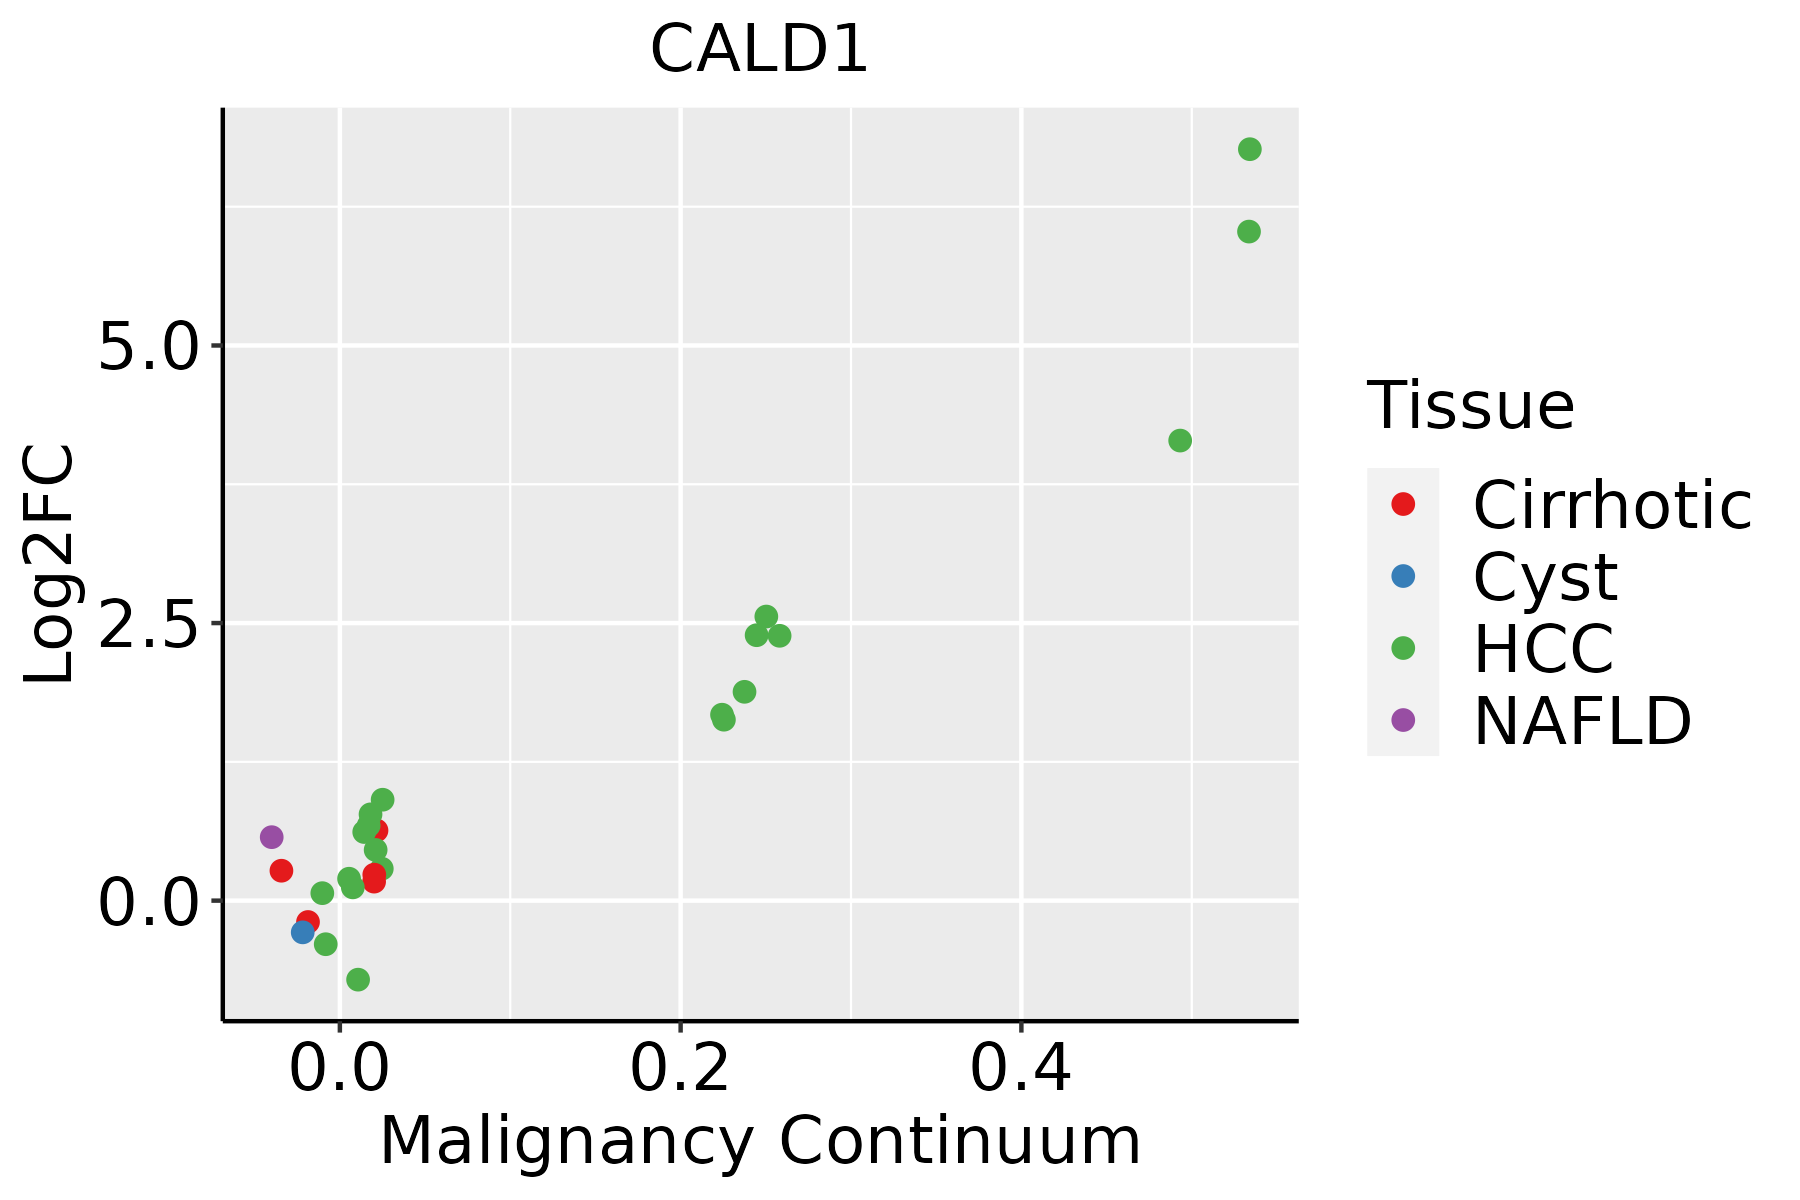 | HCC: Hepatocellular carcinoma |
| NAFLD: Non-alcoholic fatty liver disease |
| Lung | 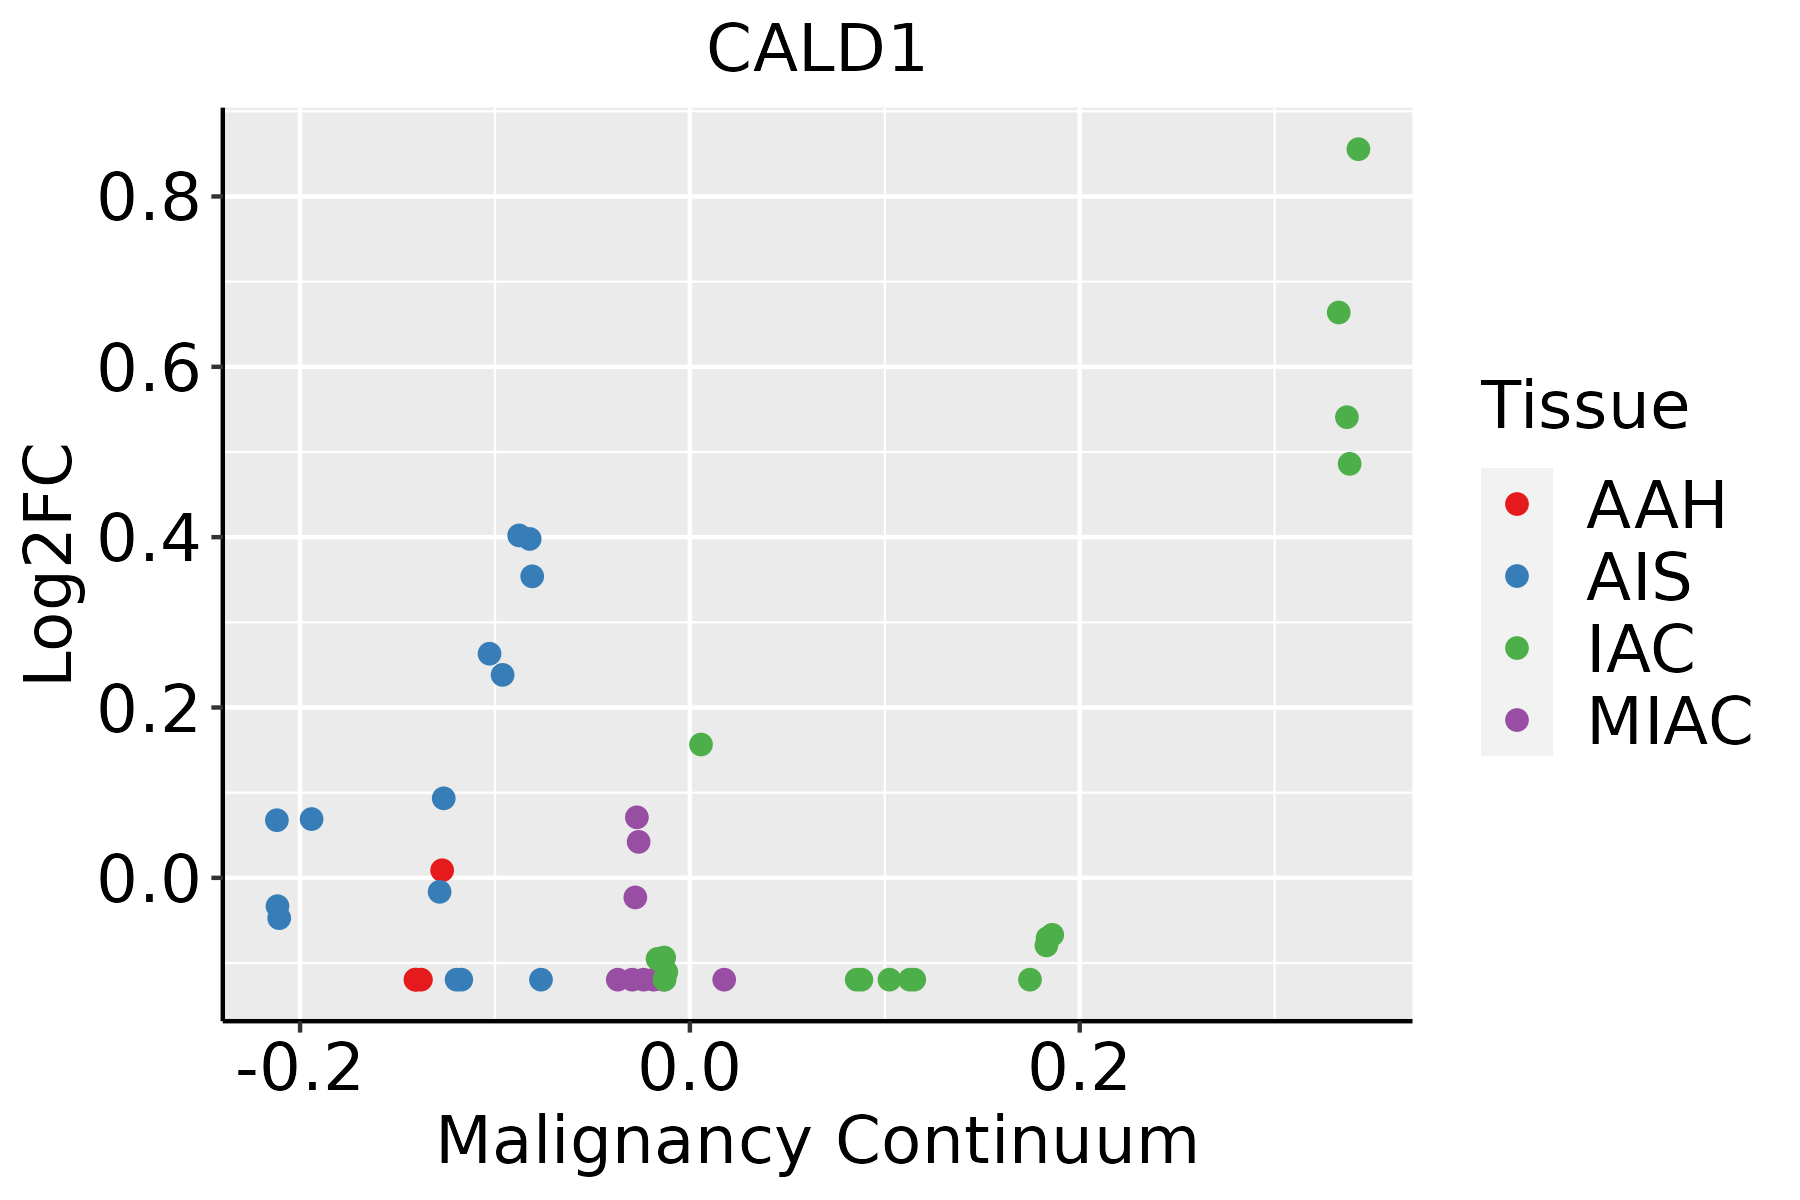 | AAH: Atypical adenomatous hyperplasia |
| AIS: Adenocarcinoma in situ |
| IAC: Invasive lung adenocarcinoma |
| MIA: Minimally invasive adenocarcinoma |
| Oral Cavity |  | EOLP: Erosive Oral lichen planus |
| LP: leukoplakia |
| NEOLP: Non-erosive oral lichen planus |
| OSCC: Oral squamous cell carcinoma |
| Prostate |  | BPH: Benign Prostatic Hyperplasia |
| Skin |  | AK: Actinic keratosis |
| cSCC: Cutaneous squamous cell carcinoma |
| SCCIS:squamous cell carcinoma in situ |
| Thyroid |  | ATC: Anaplastic thyroid cancer |
| HT: Hashimoto's thyroiditis |
| PTC: Papillary thyroid cancer |
| GO ID | Tissue | Disease Stage | Description | Gene Ratio | Bg Ratio | pvalue | p.adjust | Count |
| GO:000701514 | Breast | IDC | actin filament organization | 55/1434 | 442/18723 | 2.45e-04 | 3.84e-03 | 55 |
| GO:005101714 | Breast | IDC | actin filament bundle assembly | 24/1434 | 157/18723 | 8.73e-04 | 1.01e-02 | 24 |
| GO:006157214 | Breast | IDC | actin filament bundle organization | 24/1434 | 161/18723 | 1.25e-03 | 1.33e-02 | 24 |
| GO:00030125 | Breast | IDC | muscle system process | 50/1434 | 452/18723 | 5.52e-03 | 4.05e-02 | 50 |
| GO:000701524 | Breast | DCIS | actin filament organization | 56/1390 | 442/18723 | 5.90e-05 | 1.19e-03 | 56 |
| GO:005101724 | Breast | DCIS | actin filament bundle assembly | 25/1390 | 157/18723 | 2.31e-04 | 3.65e-03 | 25 |
| GO:006157224 | Breast | DCIS | actin filament bundle organization | 25/1390 | 161/18723 | 3.43e-04 | 4.90e-03 | 25 |
| GO:000301212 | Breast | DCIS | muscle system process | 50/1390 | 452/18723 | 3.02e-03 | 2.57e-02 | 50 |
| GO:000701510 | Cervix | CC | actin filament organization | 109/2311 | 442/18723 | 4.92e-13 | 2.45e-10 | 109 |
| GO:006157210 | Cervix | CC | actin filament bundle organization | 44/2311 | 161/18723 | 2.08e-07 | 9.34e-06 | 44 |
| GO:005101710 | Cervix | CC | actin filament bundle assembly | 43/2311 | 157/18723 | 2.66e-07 | 1.12e-05 | 43 |
| GO:000701515 | Cervix | HSIL_HPV | actin filament organization | 43/737 | 442/18723 | 4.77e-08 | 3.59e-06 | 43 |
| GO:006157215 | Cervix | HSIL_HPV | actin filament bundle organization | 16/737 | 161/18723 | 6.30e-04 | 8.64e-03 | 16 |
| GO:005101715 | Cervix | HSIL_HPV | actin filament bundle assembly | 15/737 | 157/18723 | 1.37e-03 | 1.56e-02 | 15 |
| GO:000701516 | Endometrium | AEH | actin filament organization | 98/2100 | 442/18723 | 1.99e-11 | 2.98e-09 | 98 |
| GO:005101716 | Endometrium | AEH | actin filament bundle assembly | 39/2100 | 157/18723 | 1.21e-06 | 3.91e-05 | 39 |
| GO:006157216 | Endometrium | AEH | actin filament bundle organization | 39/2100 | 161/18723 | 2.36e-06 | 6.86e-05 | 39 |
| GO:00030126 | Endometrium | AEH | muscle system process | 78/2100 | 452/18723 | 6.89e-05 | 1.06e-03 | 78 |
| GO:0006936 | Endometrium | AEH | muscle contraction | 59/2100 | 347/18723 | 7.32e-04 | 6.99e-03 | 59 |
| GO:000701517 | Endometrium | EEC | actin filament organization | 95/2168 | 442/18723 | 1.31e-09 | 1.09e-07 | 95 |
| Hugo Symbol | Variant Class | Variant Classification | dbSNP RS | HGVSc | HGVSp | HGVSp Short | SWISSPROT | BIOTYPE | SIFT | PolyPhen | Tumor Sample Barcode | Tissue | Histology | Sex | Age | Stage | Therapy Types | Drugs | Outcome |
| CALD1 | SNV | Missense_Mutation | | c.1384N>A | p.Glu462Lys | p.E462K | Q05682 | protein_coding | deleterious_low_confidence(0.05) | possibly_damaging(0.732) | TCGA-A2-A0EX-01 | Breast | breast invasive carcinoma | Female | <65 | I/II | Hormone Therapy | tamoxiphen | SD |
| CALD1 | SNV | Missense_Mutation | | c.56N>A | p.Arg19Gln | p.R19Q | Q05682 | protein_coding | deleterious(0) | probably_damaging(0.988) | TCGA-A2-A0EY-01 | Breast | breast invasive carcinoma | Female | <65 | I/II | Chemotherapy | adriamycin | SD |
| CALD1 | SNV | Missense_Mutation | | c.1315N>C | p.Glu439Gln | p.E439Q | Q05682 | protein_coding | deleterious_low_confidence(0) | possibly_damaging(0.898) | TCGA-A2-A0EY-01 | Breast | breast invasive carcinoma | Female | <65 | I/II | Chemotherapy | adriamycin | SD |
| CALD1 | SNV | Missense_Mutation | | c.1450C>G | p.Arg484Gly | p.R484G | Q05682 | protein_coding | tolerated(0.24) | benign(0) | TCGA-A8-A095-01 | Breast | breast invasive carcinoma | Female | <65 | I/II | Chemotherapy | 5-fluorouracil | CR |
| CALD1 | SNV | Missense_Mutation | | c.232N>A | p.Glu78Lys | p.E78K | Q05682 | protein_coding | deleterious(0.01) | possibly_damaging(0.652) | TCGA-AC-A23H-01 | Breast | breast invasive carcinoma | Female | >=65 | I/II | Unknown | Unknown | PD |
| CALD1 | SNV | Missense_Mutation | novel | c.1622N>T | p.Arg541Leu | p.R541L | Q05682 | protein_coding | deleterious(0) | possibly_damaging(0.845) | TCGA-B6-A1KI-01 | Breast | breast invasive carcinoma | Female | <65 | I/II | Unknown | Unknown | SD |
| CALD1 | SNV | Missense_Mutation | | c.2026N>C | p.Asp676His | p.D676H | Q05682 | protein_coding | deleterious(0) | probably_damaging(0.999) | TCGA-D8-A1J9-01 | Breast | breast invasive carcinoma | Female | <65 | I/II | Unknown | Unknown | SD |
| CALD1 | SNV | Missense_Mutation | novel | c.1065N>T | p.Glu355Asp | p.E355D | Q05682 | protein_coding | tolerated_low_confidence(0.37) | benign(0.096) | TCGA-E9-A54Y-01 | Breast | breast invasive carcinoma | Female | <65 | III/IV | Unknown | Unknown | SD |
| CALD1 | SNV | Missense_Mutation | novel | c.2128N>G | p.Arg710Gly | p.R710G | Q05682 | protein_coding | deleterious(0.01) | probably_damaging(0.992) | TCGA-JL-A3YW-01 | Breast | breast invasive carcinoma | Female | <65 | I/II | Unknown | Unknown | SD |
| CALD1 | SNV | Missense_Mutation | novel | c.2090C>T | p.Pro697Leu | p.P697L | Q05682 | protein_coding | deleterious(0) | possibly_damaging(0.874) | TCGA-2W-A8YY-01 | Cervix | cervical & endocervical cancer | Female | <65 | I/II | Chemotherapy | cisplatin | CR |


