
|
|||||
|
 | |
| |
| |
| |
| |
| |
|
Gene: CALCRL |
Gene summary for CALCRL |
| Gene information | Species | Human | Gene symbol | CALCRL | Gene ID | 10203 |
| Gene name | calcitonin receptor like receptor | |
| Gene Alias | CGRPR | |
| Cytomap | 2q32.1 | |
| Gene Type | protein-coding | GO ID | GO:0001525 | UniProtAcc | Q16602 |
Top |
Malignant transformation analysis |
| Identification of the aberrant gene expression in precancerous and cancerous lesions by comparing the gene expression of stem-like cells in diseased tissues with normal stem cells |
| Entrez ID | Symbol | Replicates | Species | Organ | Tissue | Adj P-value | Log2FC | Malignancy |
| 10203 | CALCRL | P4T-E | Human | Esophagus | ESCC | 2.57e-11 | 4.15e-01 | 0.1323 |
| 10203 | CALCRL | P8T-E | Human | Esophagus | ESCC | 2.38e-03 | 1.85e-01 | 0.0889 |
| 10203 | CALCRL | P10T-E | Human | Esophagus | ESCC | 1.72e-05 | 1.83e-01 | 0.116 |
| 10203 | CALCRL | P15T-E | Human | Esophagus | ESCC | 8.20e-14 | 4.56e-01 | 0.1149 |
| 10203 | CALCRL | P22T-E | Human | Esophagus | ESCC | 8.84e-15 | 3.33e-01 | 0.1236 |
| 10203 | CALCRL | P23T-E | Human | Esophagus | ESCC | 1.34e-06 | 6.13e-01 | 0.108 |
| 10203 | CALCRL | P26T-E | Human | Esophagus | ESCC | 1.79e-25 | 5.55e-01 | 0.1276 |
| 10203 | CALCRL | P28T-E | Human | Esophagus | ESCC | 8.38e-10 | 4.87e-01 | 0.1149 |
| 10203 | CALCRL | P30T-E | Human | Esophagus | ESCC | 3.14e-11 | 6.22e-01 | 0.137 |
| 10203 | CALCRL | P32T-E | Human | Esophagus | ESCC | 1.71e-14 | 5.95e-01 | 0.1666 |
| 10203 | CALCRL | P36T-E | Human | Esophagus | ESCC | 4.22e-06 | 5.79e-01 | 0.1187 |
| 10203 | CALCRL | P39T-E | Human | Esophagus | ESCC | 4.01e-05 | 1.08e-01 | 0.0894 |
| 10203 | CALCRL | P40T-E | Human | Esophagus | ESCC | 4.65e-08 | 4.10e-01 | 0.109 |
| 10203 | CALCRL | P42T-E | Human | Esophagus | ESCC | 2.45e-10 | 3.83e-01 | 0.1175 |
| 10203 | CALCRL | P47T-E | Human | Esophagus | ESCC | 5.44e-11 | 3.93e-01 | 0.1067 |
| 10203 | CALCRL | P48T-E | Human | Esophagus | ESCC | 3.83e-04 | 2.30e-01 | 0.0959 |
| 10203 | CALCRL | P52T-E | Human | Esophagus | ESCC | 5.69e-06 | 2.90e-01 | 0.1555 |
| 10203 | CALCRL | P54T-E | Human | Esophagus | ESCC | 3.31e-02 | 2.04e-01 | 0.0975 |
| 10203 | CALCRL | P57T-E | Human | Esophagus | ESCC | 4.66e-05 | 3.05e-01 | 0.0926 |
| 10203 | CALCRL | P61T-E | Human | Esophagus | ESCC | 1.81e-11 | 4.55e-01 | 0.099 |
| Page: 1 2 |
| Tissue | Expression Dynamics | Abbreviation |
| Esophagus | 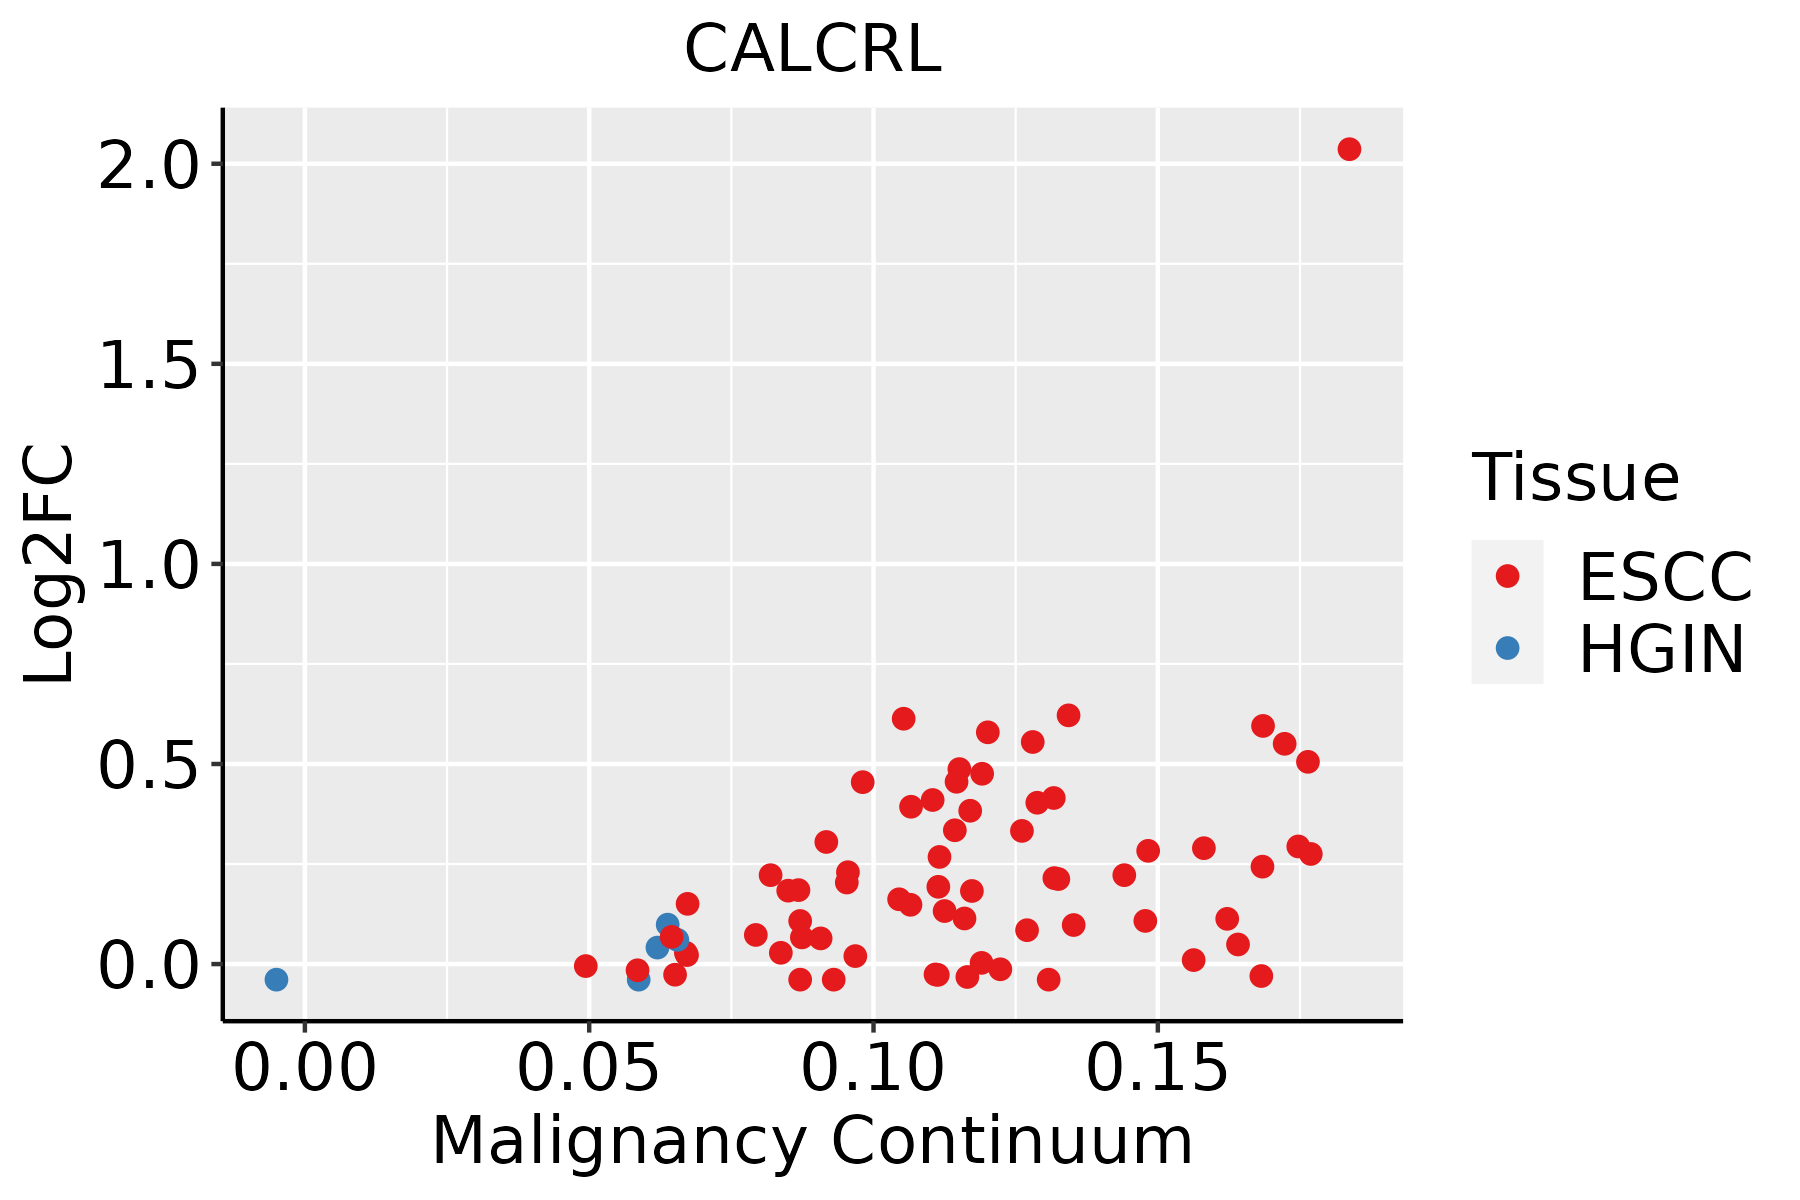 | ESCC: Esophageal squamous cell carcinoma |
| HGIN: High-grade intraepithelial neoplasias | ||
| LGIN: Low-grade intraepithelial neoplasias | ||
| Thyroid | 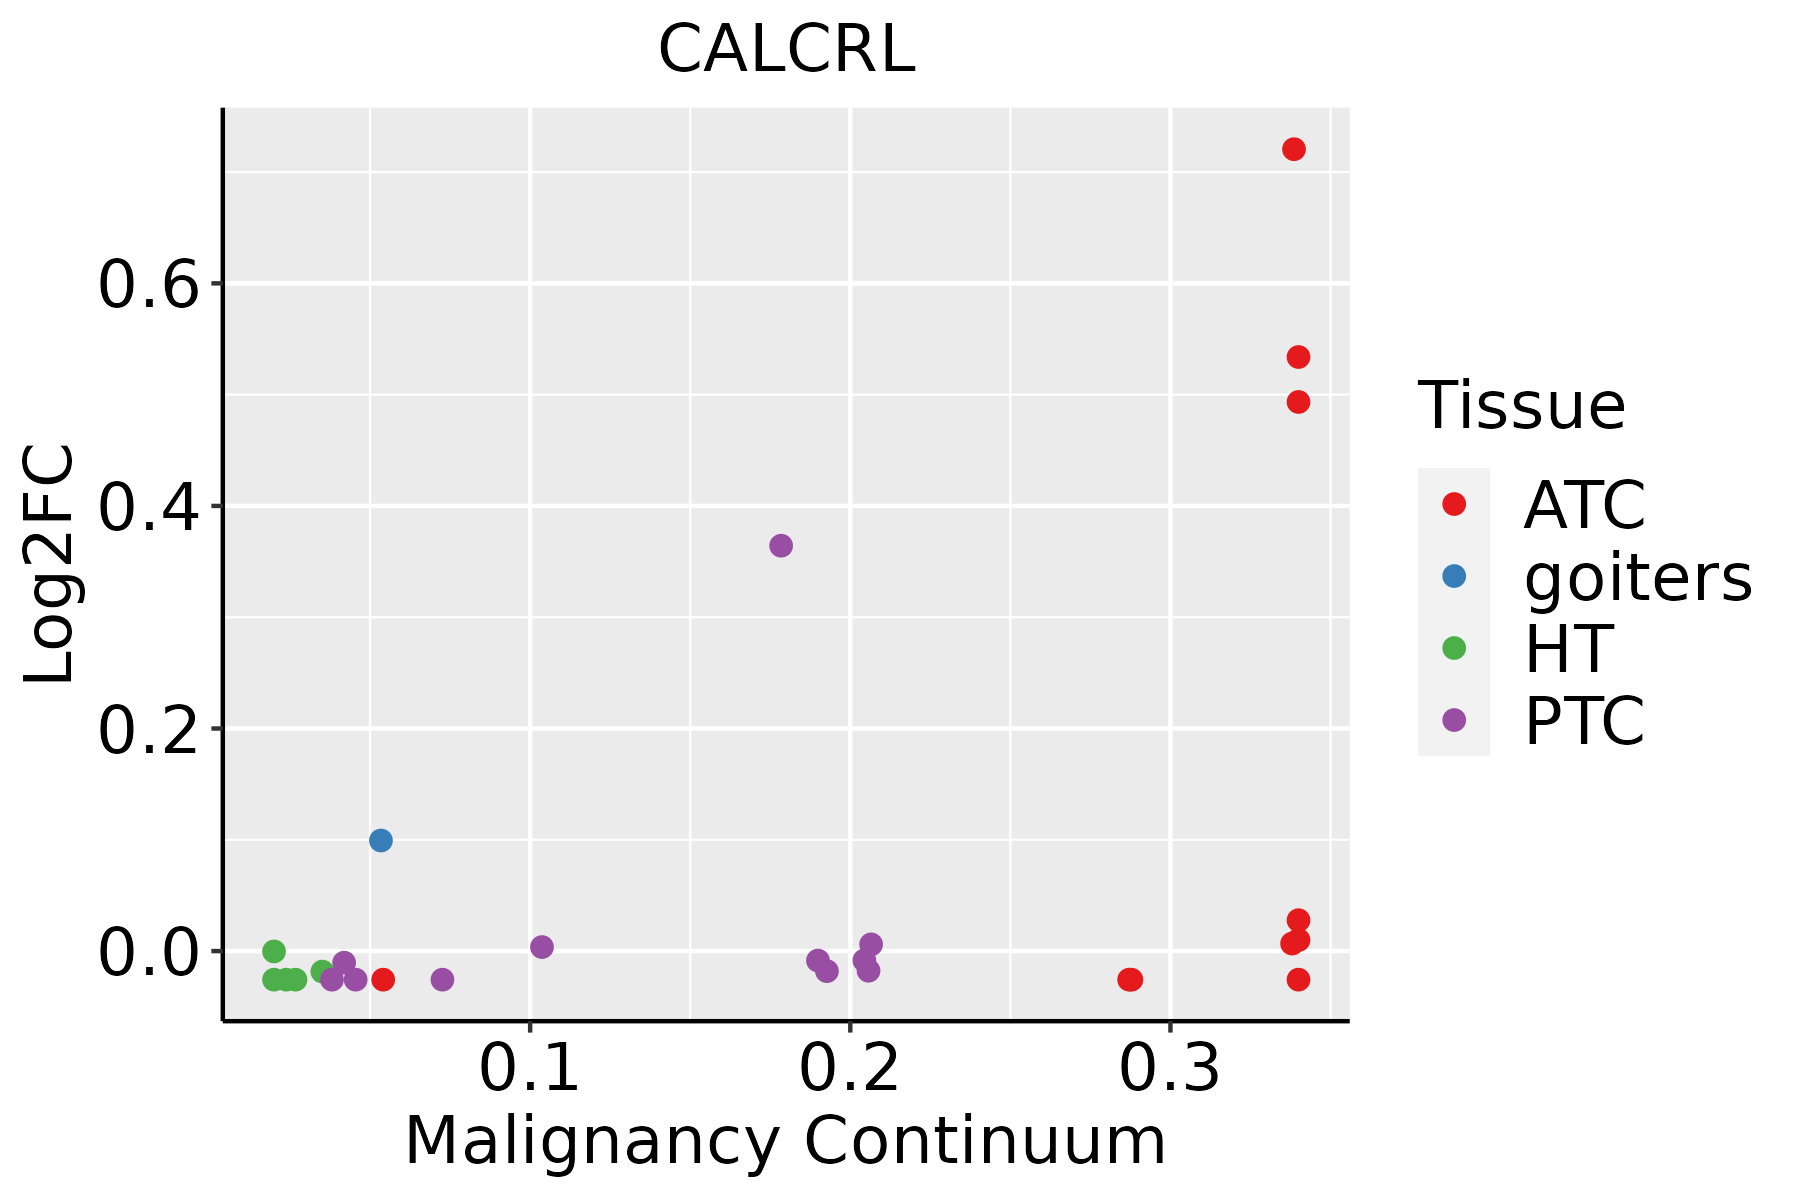 | ATC: Anaplastic thyroid cancer |
| HT: Hashimoto's thyroiditis | ||
| PTC: Papillary thyroid cancer |
| ∗log2FC in expression of this searched gene in stem-like cells from each diseased tissue sample relative to stem-like cells in normal samples in each tissue plotted against the malignancy continuum. Samples are colored based on if they are from different disease stage. |
Top |
Malignant transformation related pathway analysis |
| Find out the enriched GO biological processes and KEGG pathways involved in transition from healthy to precancer to cancer |
| Tissue | Disease Stage | Enriched GO biological Processes |
| Colorectum | AD |  |
| Colorectum | SER |  |
| Colorectum | MSS |  |
| Colorectum | MSI-H |  |
| Colorectum | FAP |  |
| ∗Top 15 enriched GO BP terms are showed in the bar plot of each disease state in each tissue. Each row represents a significant GO biological process which is colored according to the -log10(p.adjust). |
| Page: 1 2 3 4 5 6 7 8 9 |
| GO ID | Tissue | Disease Stage | Description | Gene Ratio | Bg Ratio | pvalue | p.adjust | Count |
| GO:004311218 | Esophagus | ESCC | receptor metabolic process | 104/8552 | 166/18723 | 7.44e-06 | 7.37e-05 | 104 |
| GO:000689818 | Esophagus | ESCC | receptor-mediated endocytosis | 142/8552 | 244/18723 | 5.22e-05 | 4.05e-04 | 142 |
| GO:00486597 | Esophagus | ESCC | smooth muscle cell proliferation | 103/8552 | 184/18723 | 3.08e-03 | 1.28e-02 | 103 |
| GO:00486607 | Esophagus | ESCC | regulation of smooth muscle cell proliferation | 100/8552 | 180/18723 | 4.76e-03 | 1.85e-02 | 100 |
| GO:00330025 | Esophagus | ESCC | muscle cell proliferation | 134/8552 | 248/18723 | 4.80e-03 | 1.86e-02 | 134 |
| GO:00486615 | Esophagus | ESCC | positive regulation of smooth muscle cell proliferation | 61/8552 | 104/18723 | 5.22e-03 | 1.97e-02 | 61 |
| GO:0009743111 | Esophagus | ESCC | response to carbohydrate | 135/8552 | 253/18723 | 8.16e-03 | 2.89e-02 | 135 |
| GO:000689826 | Thyroid | ATC | receptor-mediated endocytosis | 118/6293 | 244/18723 | 1.17e-06 | 1.50e-05 | 118 |
| GO:004311224 | Thyroid | ATC | receptor metabolic process | 82/6293 | 166/18723 | 1.78e-05 | 1.63e-04 | 82 |
| GO:000974333 | Thyroid | ATC | response to carbohydrate | 114/6293 | 253/18723 | 9.26e-05 | 6.81e-04 | 114 |
| GO:003300214 | Thyroid | ATC | muscle cell proliferation | 107/6293 | 248/18723 | 1.03e-03 | 5.47e-03 | 107 |
| GO:004865916 | Thyroid | ATC | smooth muscle cell proliferation | 81/6293 | 184/18723 | 2.02e-03 | 9.60e-03 | 81 |
| GO:007132224 | Thyroid | ATC | cellular response to carbohydrate stimulus | 72/6293 | 163/18723 | 3.12e-03 | 1.41e-02 | 72 |
| GO:004866016 | Thyroid | ATC | regulation of smooth muscle cell proliferation | 78/6293 | 180/18723 | 4.00e-03 | 1.73e-02 | 78 |
| GO:003162310 | Thyroid | ATC | receptor internalization | 52/6293 | 113/18723 | 4.05e-03 | 1.74e-02 | 52 |
| Page: 1 |
| Pathway ID | Tissue | Disease Stage | Description | Gene Ratio | Bg Ratio | pvalue | p.adjust | qvalue | Count |
| Page: 1 |
Top |
Cell-cell communication analysis |
| Identification of potential cell-cell interactions between two cell types and their ligand-receptor pairs for different disease states |
| Ligand | Receptor | LRpair | Pathway | Tissue | Disease Stage |
| ADM | CALCRL | ADM_CALCRL | CALCR | Breast | ADJ |
| ADM | CALCRL | ADM_CALCRL | CALCR | Breast | DCIS |
| ADM | CALCRL | ADM_CALCRL | CALCR | Breast | Healthy |
| ADM | CALCRL | ADM_CALCRL | CALCR | Breast | IDC |
| ADM | CALCRL | ADM_CALCRL | CALCR | Breast | Precancer |
| ADM | CALCRL | ADM_CALCRL | CALCR | Cervix | ADJ |
| ADM | CALCRL | ADM_CALCRL | CALCR | Cervix | CC |
| ADM | CALCRL | ADM_CALCRL | CALCR | Cervix | Precancer |
| CALCB | CALCRL | CALCB_CALCRL | CALCR | CRC | CRC |
| ADM | CALCRL | ADM_CALCRL | CALCR | Endometrium | AEH |
| ADM | CALCRL | ADM_CALCRL | CALCR | Endometrium | EEC |
| ADM | CALCRL | ADM_CALCRL | CALCR | Endometrium | Healthy |
| ADM | CALCRL | ADM_CALCRL | CALCR | Esophagus | ESCC |
| ADM | CALCRL | ADM_CALCRL | CALCR | Esophagus | Healthy |
| ADM | CALCRL | ADM_CALCRL | CALCR | HNSCC | ADJ |
| ADM | CALCRL | ADM_CALCRL | CALCR | HNSCC | Healthy |
| ADM | CALCRL | ADM_CALCRL | CALCR | HNSCC | OSCC |
| ADM | CALCRL | ADM_CALCRL | CALCR | HNSCC | Precancer |
| ADM | CALCRL | ADM_CALCRL | CALCR | Liver | HCC |
| ADM | CALCRL | ADM_CALCRL | CALCR | Liver | Healthy |
| Page: 1 |
Top |
Single-cell gene regulatory network inference analysis |
| Find out the significant the regulons (TFs) and the target genes of each regulon across cell types for different disease states |
| TF | Cell Type | Tissue | Disease Stage | Target Gene | RSS | Regulon Activity |
| ∗The dot plots of a searched regulon are shown for all cell subpopulations in each disease state of each tissue based on the regulon specific score inferred using pySCENIC and by calculating the average expression. |
| Page: 1 |
Top |
Somatic mutation of malignant transformation related genes |
| Annotation of somatic variants for genes involved in malignant transformation |
| Hugo Symbol | Variant Class | Variant Classification | dbSNP RS | HGVSc | HGVSp | HGVSp Short | SWISSPROT | BIOTYPE | SIFT | PolyPhen | Tumor Sample Barcode | Tissue | Histology | Sex | Age | Stage | Therapy Types | Drugs | Outcome |
| CALCRL | SNV | Missense_Mutation | c.1220N>C | p.Gly407Ala | p.G407A | Q16602 | protein_coding | tolerated(0.15) | benign(0.023) | TCGA-A2-A04Y-01 | Breast | breast invasive carcinoma | Female | <65 | I/II | Chemotherapy | cytoxan | SD | |
| CALCRL | SNV | Missense_Mutation | c.236N>T | p.Ala79Val | p.A79V | Q16602 | protein_coding | deleterious(0.05) | benign(0.101) | TCGA-AO-A128-01 | Breast | breast invasive carcinoma | Female | <65 | I/II | Chemotherapy | doxorubicin | SD | |
| CALCRL | SNV | Missense_Mutation | c.509N>A | p.Ser170Asn | p.S170N | Q16602 | protein_coding | deleterious(0.01) | possibly_damaging(0.823) | TCGA-BH-A0E9-01 | Breast | breast invasive carcinoma | Female | <65 | I/II | Chemotherapy | taxotere | CR | |
| CALCRL | SNV | Missense_Mutation | c.1042N>A | p.Glu348Lys | p.E348K | Q16602 | protein_coding | deleterious(0) | benign(0.232) | TCGA-C8-A1HM-01 | Breast | breast invasive carcinoma | Female | >=65 | I/II | Chemotherapy | doxorubicin | CR | |
| CALCRL | SNV | Missense_Mutation | c.1197N>C | p.Trp399Cys | p.W399C | Q16602 | protein_coding | deleterious(0) | probably_damaging(0.984) | TCGA-XX-A89A-01 | Breast | breast invasive carcinoma | Female | >=65 | I/II | Unknown | Unknown | SD | |
| CALCRL | SNV | Missense_Mutation | c.635G>T | p.Cys212Phe | p.C212F | Q16602 | protein_coding | deleterious(0) | probably_damaging(0.999) | TCGA-IR-A3LA-01 | Cervix | cervical & endocervical cancer | Female | <65 | I/II | Chemotherapy | cisplatin | CR | |
| CALCRL | SNV | Missense_Mutation | c.985N>C | p.Asn329His | p.N329H | Q16602 | protein_coding | tolerated(0.61) | benign(0.007) | TCGA-A6-2677-01 | Colorectum | colon adenocarcinoma | Female | >=65 | III/IV | Ancillary | leucovorin | SD | |
| CALCRL | SNV | Missense_Mutation | novel | c.65N>A | p.Ala22Glu | p.A22E | Q16602 | protein_coding | tolerated(0.44) | benign(0.001) | TCGA-AA-3870-01 | Colorectum | colon adenocarcinoma | Female | >=65 | III/IV | Chemotherapy | folinic | CR |
| CALCRL | SNV | Missense_Mutation | novel | c.944T>C | p.Val315Ala | p.V315A | Q16602 | protein_coding | deleterious(0) | probably_damaging(0.998) | TCGA-AA-3984-01 | Colorectum | colon adenocarcinoma | Female | <65 | I/II | Unknown | Unknown | SD |
| CALCRL | SNV | Missense_Mutation | rs144814027 | c.940N>T | p.Arg314Cys | p.R314C | Q16602 | protein_coding | deleterious(0) | probably_damaging(0.999) | TCGA-CM-6674-01 | Colorectum | colon adenocarcinoma | Male | <65 | I/II | Unknown | Unknown | SD |
| Page: 1 2 3 4 5 6 7 8 9 |
Top |
Related drugs of malignant transformation related genes |
| Identification of chemicals and drugs interact with genes involved in malignant transfromation |
| (DGIdb 4.0) |
| Entrez ID | Symbol | Category | Interaction Types | Drug Claim Name | Drug Name | PMIDs |
| 10203 | CALCRL | G PROTEIN COUPLED RECEPTOR, DRUGGABLE GENOME | CGRP | CALCITONIN GENE-RELATED PEPTIDE | ||
| 10203 | CALCRL | G PROTEIN COUPLED RECEPTOR, DRUGGABLE GENOME | antagonist | CHEMBL236593 | TELCAGEPANT | |
| 10203 | CALCRL | G PROTEIN COUPLED RECEPTOR, DRUGGABLE GENOME | LBR-101 | FREMANEZUMAB | ||
| 10203 | CALCRL | G PROTEIN COUPLED RECEPTOR, DRUGGABLE GENOME | Erenumab | ERENUMAB | ||
| 10203 | CALCRL | G PROTEIN COUPLED RECEPTOR, DRUGGABLE GENOME | Olcegepant | OLCEGEPANT | ||
| 10203 | CALCRL | G PROTEIN COUPLED RECEPTOR, DRUGGABLE GENOME | agonist | CHEMBL2105635 | DAVALINTIDE | |
| 10203 | CALCRL | G PROTEIN COUPLED RECEPTOR, DRUGGABLE GENOME | Telcagepant | TELCAGEPANT | ||
| 10203 | CALCRL | G PROTEIN COUPLED RECEPTOR, DRUGGABLE GENOME | antagonist | CHEMBL2178422 | RIMEGEPANT | |
| 10203 | CALCRL | G PROTEIN COUPLED RECEPTOR, DRUGGABLE GENOME | BMS-927711 | RIMEGEPANT | ||
| 10203 | CALCRL | G PROTEIN COUPLED RECEPTOR, DRUGGABLE GENOME | BI-44370 TA |
| Page: 1 2 |

Copyright 2023-Present -The University of Texas Health Science Center at Houston |