
|
|||||
|
 | |
| |
| |
| |
| |
| |
|
Gene: CALCOCO2 |
Gene summary for CALCOCO2 |
| Gene information | Species | Human | Gene symbol | CALCOCO2 | Gene ID | 10241 |
| Gene name | calcium binding and coiled-coil domain 2 | |
| Gene Alias | NDP52 | |
| Cytomap | 17q21.32 | |
| Gene Type | protein-coding | GO ID | GO:0002376 | UniProtAcc | Q13137 |
Top |
Malignant transformation analysis |
| Identification of the aberrant gene expression in precancerous and cancerous lesions by comparing the gene expression of stem-like cells in diseased tissues with normal stem cells |
| Entrez ID | Symbol | Replicates | Species | Organ | Tissue | Adj P-value | Log2FC | Malignancy |
| 10241 | CALCOCO2 | HTA11_347_2000001011 | Human | Colorectum | AD | 1.35e-19 | 6.79e-01 | -0.1954 |
| 10241 | CALCOCO2 | F007 | Human | Colorectum | FAP | 1.47e-02 | -3.87e-01 | 0.1176 |
| 10241 | CALCOCO2 | A002-C-010 | Human | Colorectum | FAP | 9.67e-03 | -2.55e-01 | 0.242 |
| 10241 | CALCOCO2 | A001-C-207 | Human | Colorectum | FAP | 1.98e-03 | -2.86e-01 | 0.1278 |
| 10241 | CALCOCO2 | A015-C-203 | Human | Colorectum | FAP | 4.15e-13 | -2.92e-01 | -0.1294 |
| 10241 | CALCOCO2 | A015-C-204 | Human | Colorectum | FAP | 4.24e-02 | -2.48e-01 | -0.0228 |
| 10241 | CALCOCO2 | A002-C-201 | Human | Colorectum | FAP | 1.77e-08 | -3.27e-01 | 0.0324 |
| 10241 | CALCOCO2 | A001-C-108 | Human | Colorectum | FAP | 3.06e-07 | -1.79e-01 | -0.0272 |
| 10241 | CALCOCO2 | A002-C-205 | Human | Colorectum | FAP | 2.93e-09 | -1.99e-01 | -0.1236 |
| 10241 | CALCOCO2 | A015-C-006 | Human | Colorectum | FAP | 2.91e-09 | -4.04e-01 | -0.0994 |
| 10241 | CALCOCO2 | A015-C-106 | Human | Colorectum | FAP | 1.46e-05 | -1.79e-01 | -0.0511 |
| 10241 | CALCOCO2 | A002-C-114 | Human | Colorectum | FAP | 5.79e-09 | -2.90e-01 | -0.1561 |
| 10241 | CALCOCO2 | A015-C-104 | Human | Colorectum | FAP | 3.06e-13 | -1.41e-01 | -0.1899 |
| 10241 | CALCOCO2 | A001-C-014 | Human | Colorectum | FAP | 6.58e-07 | -2.06e-01 | 0.0135 |
| 10241 | CALCOCO2 | A002-C-016 | Human | Colorectum | FAP | 8.33e-12 | -2.96e-01 | 0.0521 |
| 10241 | CALCOCO2 | A015-C-002 | Human | Colorectum | FAP | 7.85e-05 | -2.76e-01 | -0.0763 |
| 10241 | CALCOCO2 | A001-C-203 | Human | Colorectum | FAP | 1.07e-03 | -2.02e-01 | -0.0481 |
| 10241 | CALCOCO2 | A002-C-116 | Human | Colorectum | FAP | 9.48e-16 | -3.09e-01 | -0.0452 |
| 10241 | CALCOCO2 | A014-C-008 | Human | Colorectum | FAP | 2.16e-06 | -2.09e-01 | -0.191 |
| 10241 | CALCOCO2 | A018-E-020 | Human | Colorectum | FAP | 5.51e-08 | -1.63e-01 | -0.2034 |
| Page: 1 2 3 4 5 6 7 8 |
| Tissue | Expression Dynamics | Abbreviation |
| Colorectum (GSE201348) |  | FAP: Familial adenomatous polyposis |
| CRC: Colorectal cancer | ||
| Colorectum (HTA11) |  | AD: Adenomas |
| SER: Sessile serrated lesions | ||
| MSI-H: Microsatellite-high colorectal cancer | ||
| MSS: Microsatellite stable colorectal cancer | ||
| Esophagus | 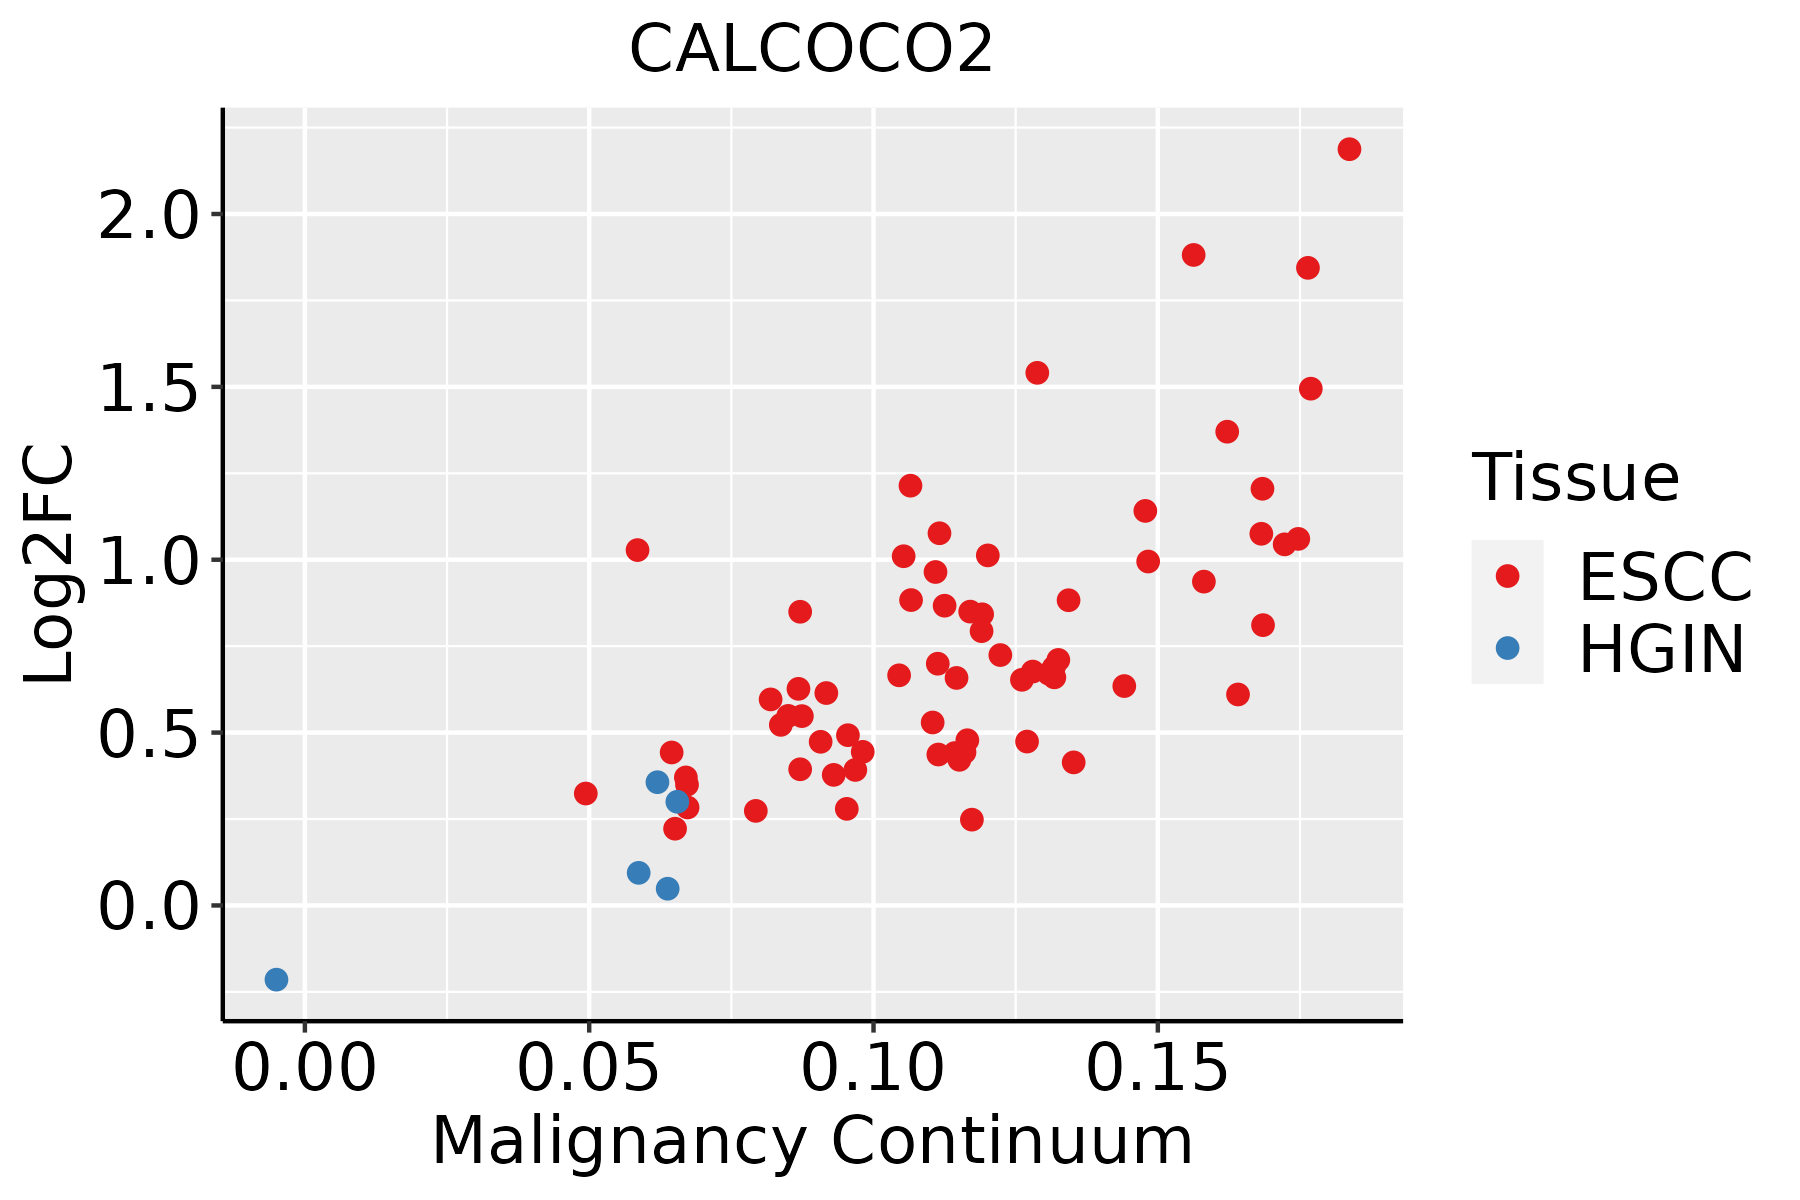 | ESCC: Esophageal squamous cell carcinoma |
| HGIN: High-grade intraepithelial neoplasias | ||
| LGIN: Low-grade intraepithelial neoplasias | ||
| Liver | 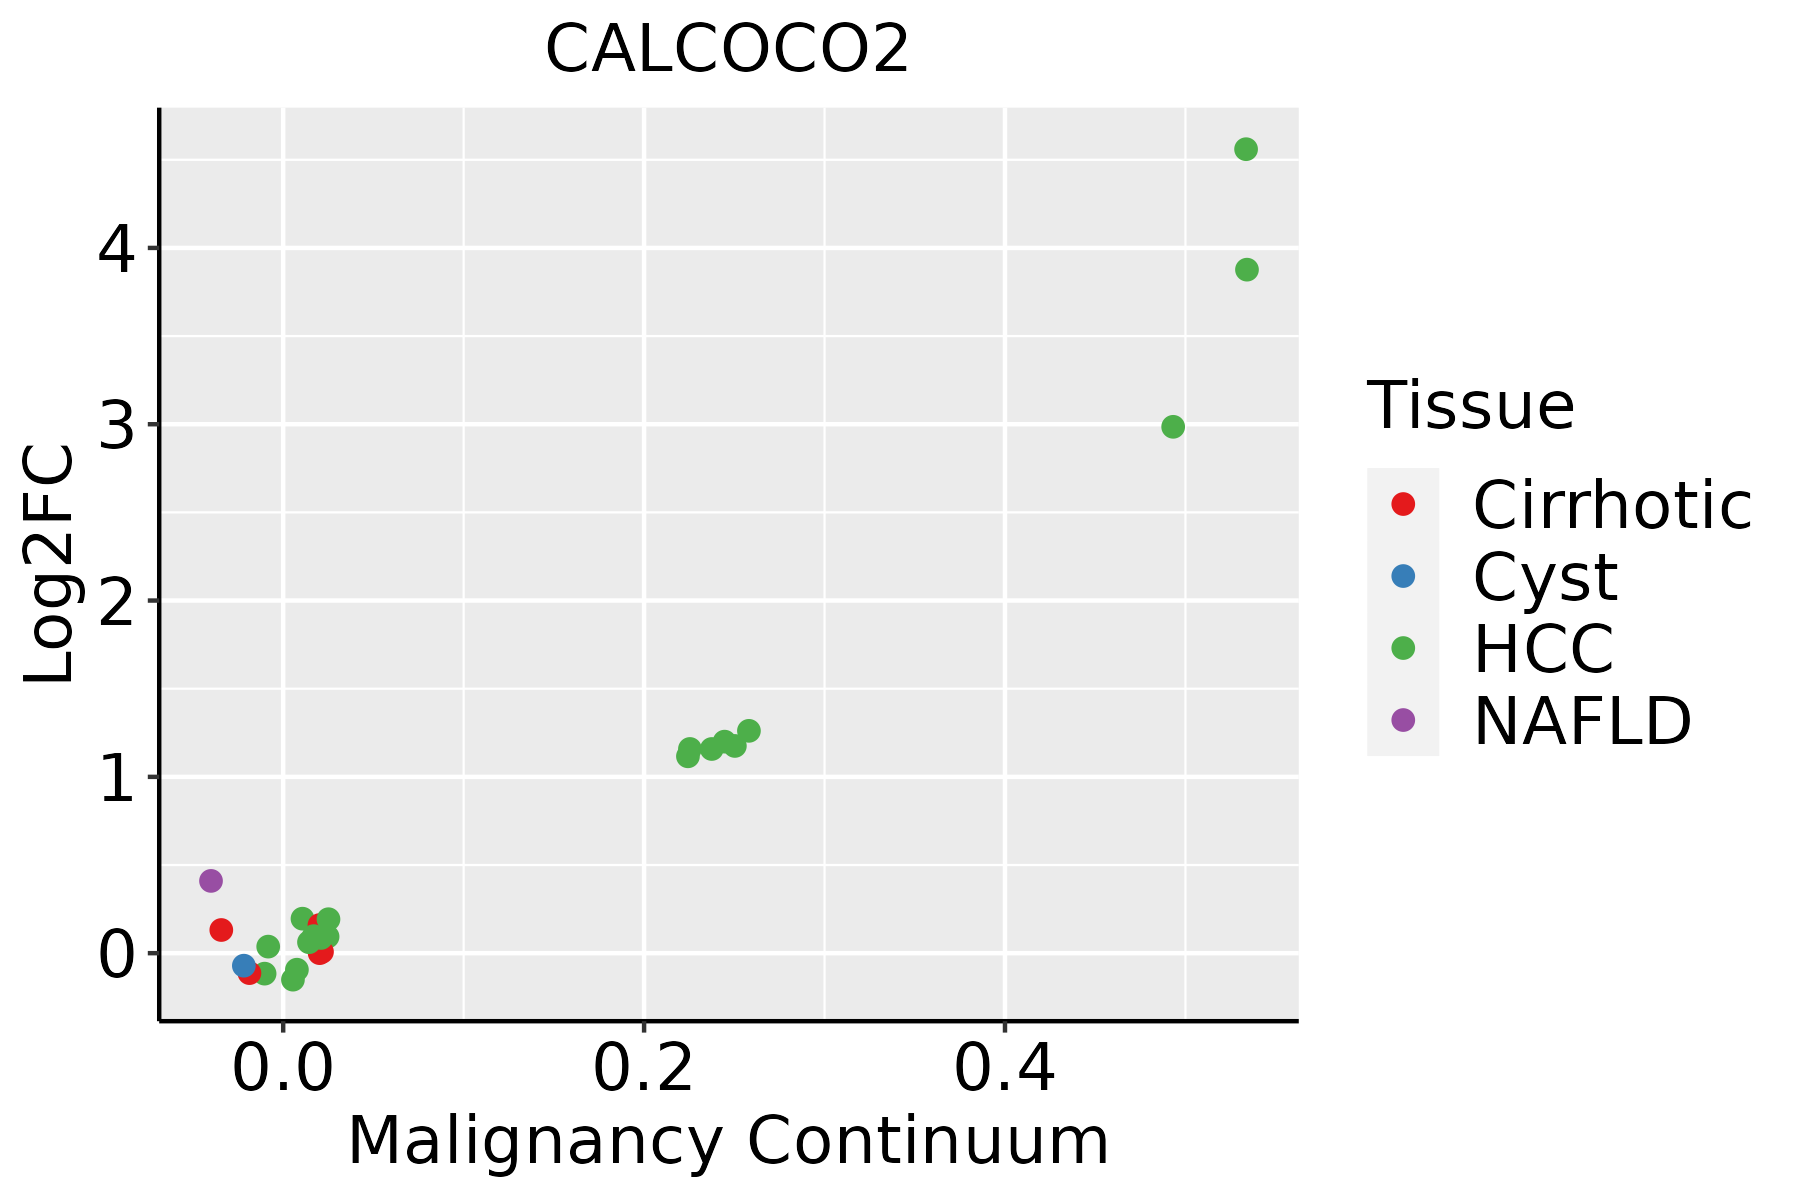 | HCC: Hepatocellular carcinoma |
| NAFLD: Non-alcoholic fatty liver disease | ||
| Oral Cavity | 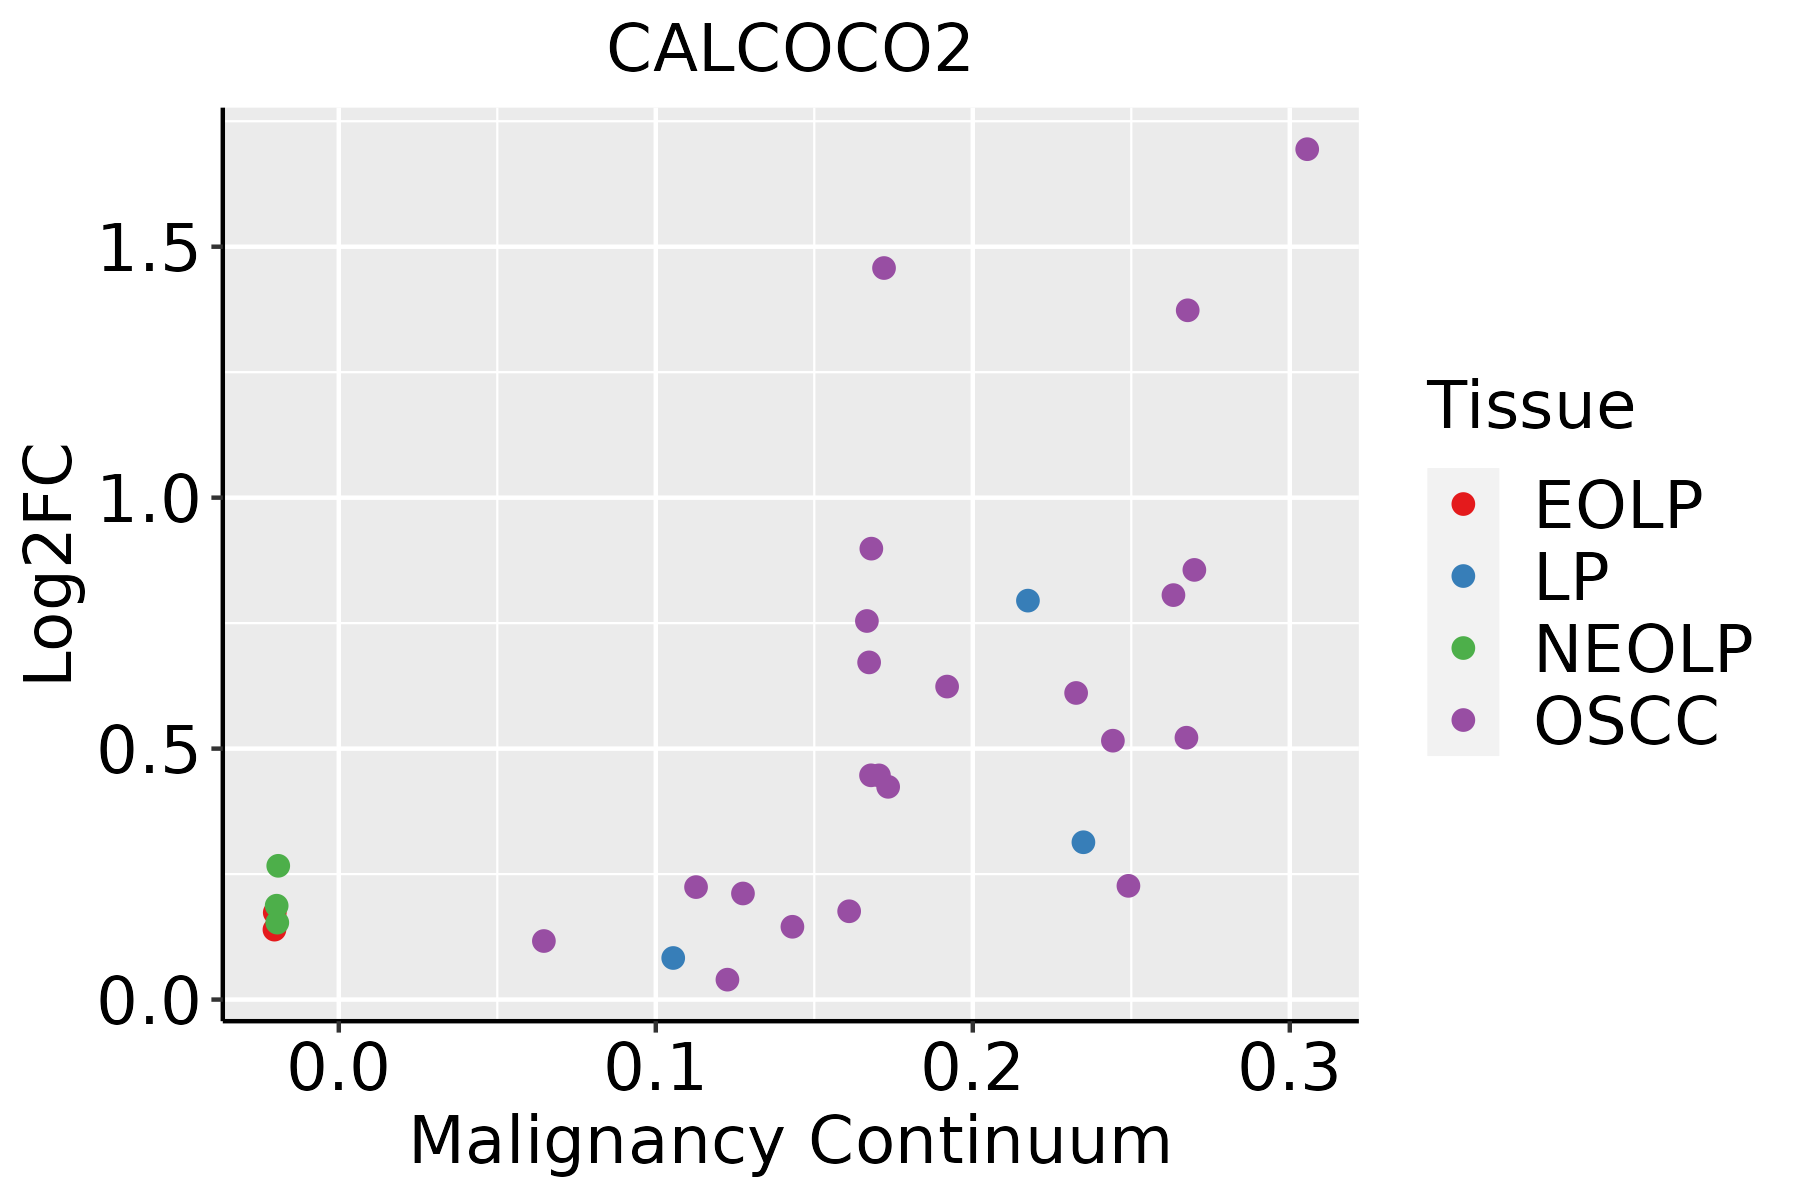 | EOLP: Erosive Oral lichen planus |
| LP: leukoplakia | ||
| NEOLP: Non-erosive oral lichen planus | ||
| OSCC: Oral squamous cell carcinoma | ||
| Skin | 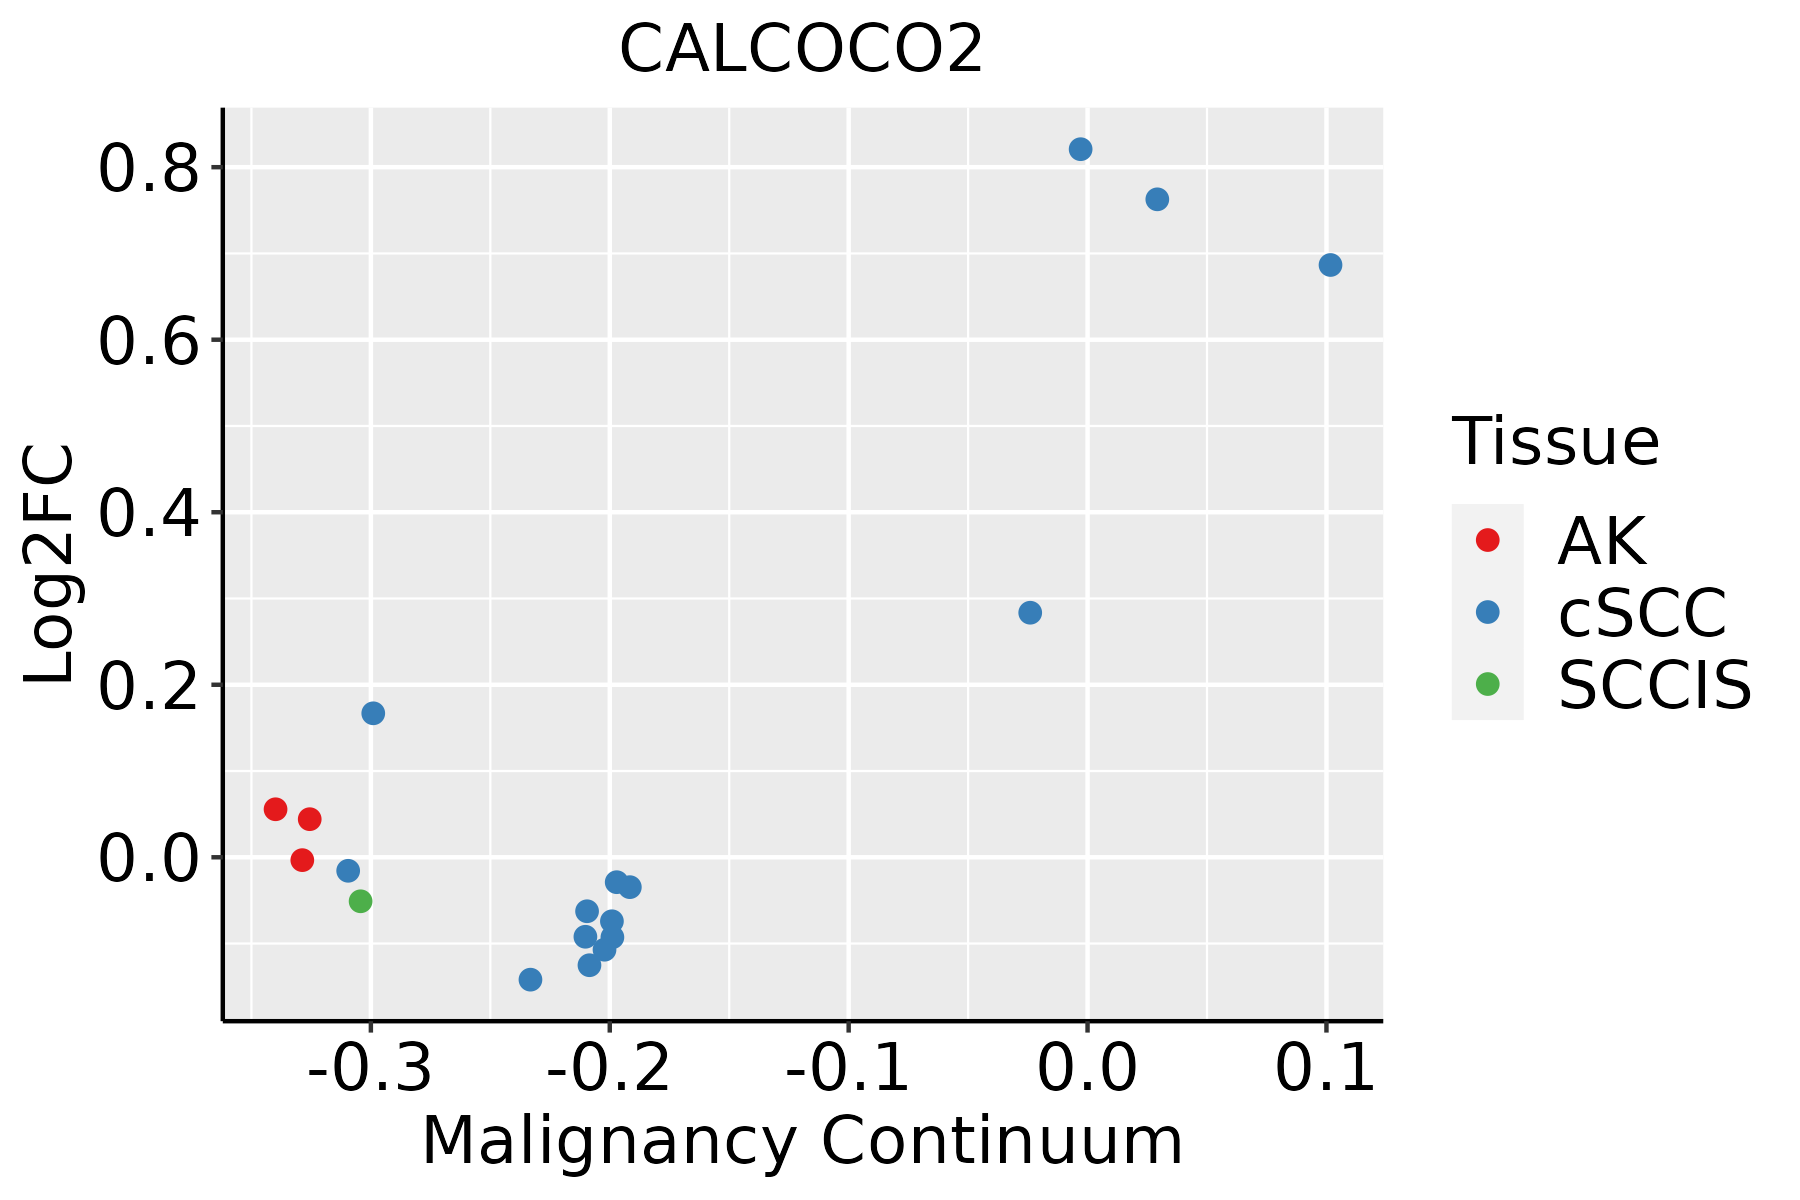 | AK: Actinic keratosis |
| cSCC: Cutaneous squamous cell carcinoma | ||
| SCCIS:squamous cell carcinoma in situ | ||
| Thyroid | 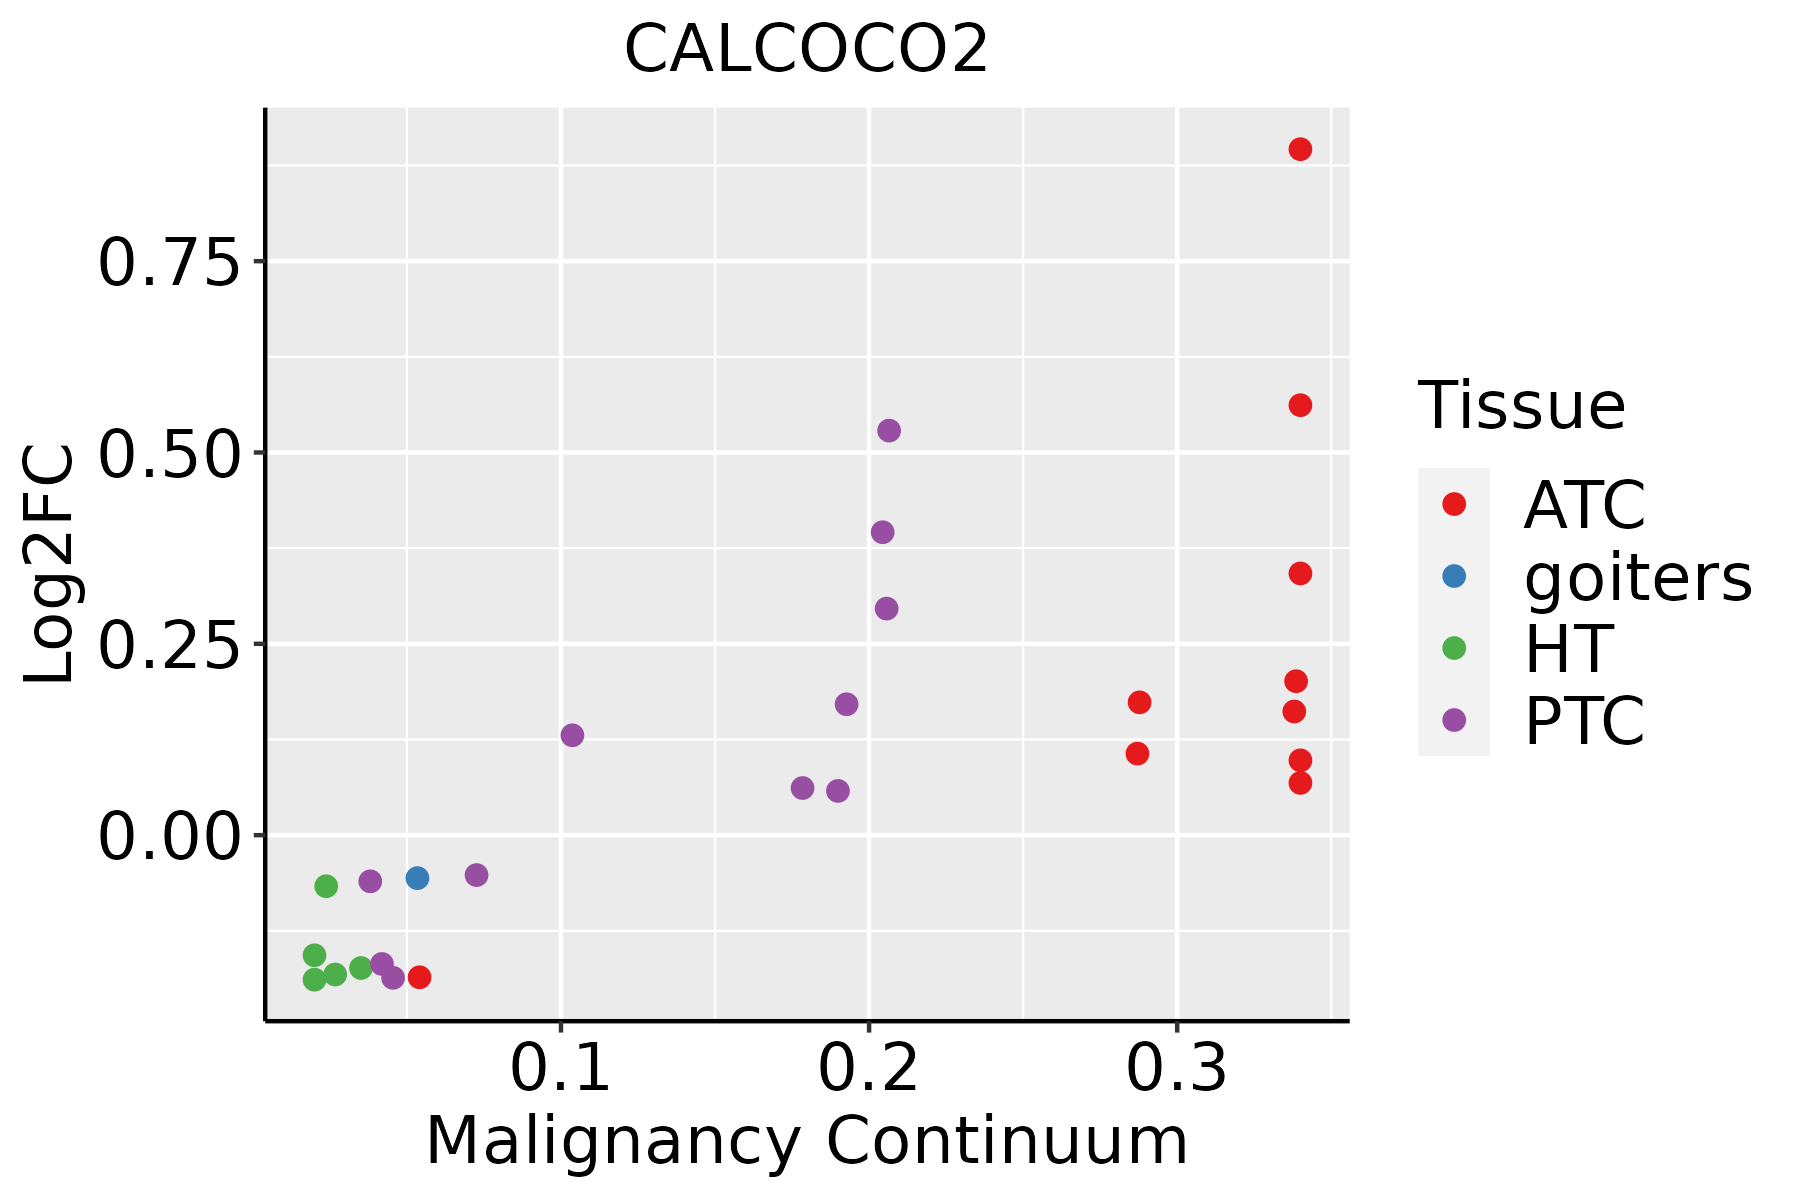 | ATC: Anaplastic thyroid cancer |
| HT: Hashimoto's thyroiditis | ||
| PTC: Papillary thyroid cancer |
| ∗log2FC in expression of this searched gene in stem-like cells from each diseased tissue sample relative to stem-like cells in normal samples in each tissue plotted against the malignancy continuum. Samples are colored based on if they are from different disease stage. |
Top |
Malignant transformation related pathway analysis |
| Find out the enriched GO biological processes and KEGG pathways involved in transition from healthy to precancer to cancer |
| Tissue | Disease Stage | Enriched GO biological Processes |
| Colorectum | AD |  |
| Colorectum | SER |  |
| Colorectum | MSS |  |
| Colorectum | MSI-H |  |
| Colorectum | FAP |  |
| ∗Top 15 enriched GO BP terms are showed in the bar plot of each disease state in each tissue. Each row represents a significant GO biological process which is colored according to the -log10(p.adjust). |
| Page: 1 2 3 4 5 6 7 8 9 |
| GO ID | Tissue | Disease Stage | Description | Gene Ratio | Bg Ratio | pvalue | p.adjust | Count |
| GO:0016032 | Colorectum | AD | viral process | 168/3918 | 415/18723 | 4.67e-20 | 3.66e-17 | 168 |
| GO:0009896 | Colorectum | AD | positive regulation of catabolic process | 180/3918 | 492/18723 | 4.33e-16 | 1.94e-13 | 180 |
| GO:0031331 | Colorectum | AD | positive regulation of cellular catabolic process | 156/3918 | 427/18723 | 4.68e-14 | 1.05e-11 | 156 |
| GO:0022411 | Colorectum | AD | cellular component disassembly | 147/3918 | 443/18723 | 8.53e-10 | 6.76e-08 | 147 |
| GO:0010506 | Colorectum | AD | regulation of autophagy | 111/3918 | 317/18723 | 3.57e-09 | 2.35e-07 | 111 |
| GO:0016236 | Colorectum | AD | macroautophagy | 103/3918 | 291/18723 | 6.76e-09 | 4.15e-07 | 103 |
| GO:0032984 | Colorectum | AD | protein-containing complex disassembly | 81/3918 | 224/18723 | 9.41e-08 | 4.65e-06 | 81 |
| GO:0061912 | Colorectum | AD | selective autophagy | 29/3918 | 68/18723 | 4.20e-05 | 7.39e-04 | 29 |
| GO:0016241 | Colorectum | AD | regulation of macroautophagy | 50/3918 | 141/18723 | 4.55e-05 | 7.92e-04 | 50 |
| GO:0010508 | Colorectum | AD | positive regulation of autophagy | 43/3918 | 124/18723 | 2.64e-04 | 3.27e-03 | 43 |
| GO:0043244 | Colorectum | AD | regulation of protein-containing complex disassembly | 41/3918 | 121/18723 | 6.22e-04 | 6.48e-03 | 41 |
| GO:0043243 | Colorectum | AD | positive regulation of protein-containing complex disassembly | 14/3918 | 35/18723 | 7.92e-03 | 4.73e-02 | 14 |
| GO:00160324 | Colorectum | FAP | viral process | 114/2622 | 415/18723 | 3.00e-13 | 2.63e-10 | 114 |
| GO:00098964 | Colorectum | FAP | positive regulation of catabolic process | 126/2622 | 492/18723 | 3.76e-12 | 2.56e-09 | 126 |
| GO:00313314 | Colorectum | FAP | positive regulation of cellular catabolic process | 110/2622 | 427/18723 | 6.09e-11 | 2.19e-08 | 110 |
| GO:00105063 | Colorectum | FAP | regulation of autophagy | 80/2622 | 317/18723 | 6.43e-08 | 4.54e-06 | 80 |
| GO:00162363 | Colorectum | FAP | macroautophagy | 70/2622 | 291/18723 | 2.73e-06 | 1.02e-04 | 70 |
| GO:00224114 | Colorectum | FAP | cellular component disassembly | 97/2622 | 443/18723 | 3.44e-06 | 1.23e-04 | 97 |
| GO:00329844 | Colorectum | FAP | protein-containing complex disassembly | 54/2622 | 224/18723 | 3.37e-05 | 7.48e-04 | 54 |
| GO:00162413 | Colorectum | FAP | regulation of macroautophagy | 38/2622 | 141/18723 | 3.78e-05 | 8.13e-04 | 38 |
| Page: 1 2 3 4 5 6 7 8 9 |
| Pathway ID | Tissue | Disease Stage | Description | Gene Ratio | Bg Ratio | pvalue | p.adjust | qvalue | Count |
| hsa05131 | Colorectum | AD | Shigellosis | 109/2092 | 247/8465 | 1.09e-11 | 2.44e-10 | 1.55e-10 | 109 |
| hsa04137 | Colorectum | AD | Mitophagy - animal | 29/2092 | 72/8465 | 2.49e-03 | 1.35e-02 | 8.59e-03 | 29 |
| hsa051311 | Colorectum | AD | Shigellosis | 109/2092 | 247/8465 | 1.09e-11 | 2.44e-10 | 1.55e-10 | 109 |
| hsa041371 | Colorectum | AD | Mitophagy - animal | 29/2092 | 72/8465 | 2.49e-03 | 1.35e-02 | 8.59e-03 | 29 |
| hsa051318 | Colorectum | FAP | Shigellosis | 76/1404 | 247/8465 | 1.57e-08 | 5.84e-07 | 3.55e-07 | 76 |
| hsa041378 | Colorectum | FAP | Mitophagy - animal | 20/1404 | 72/8465 | 1.14e-02 | 3.92e-02 | 2.38e-02 | 20 |
| hsa051319 | Colorectum | FAP | Shigellosis | 76/1404 | 247/8465 | 1.57e-08 | 5.84e-07 | 3.55e-07 | 76 |
| hsa041379 | Colorectum | FAP | Mitophagy - animal | 20/1404 | 72/8465 | 1.14e-02 | 3.92e-02 | 2.38e-02 | 20 |
| hsa0513110 | Colorectum | CRC | Shigellosis | 59/1091 | 247/8465 | 1.19e-06 | 5.41e-05 | 3.66e-05 | 59 |
| hsa0413710 | Colorectum | CRC | Mitophagy - animal | 17/1091 | 72/8465 | 8.74e-03 | 4.00e-02 | 2.71e-02 | 17 |
| hsa0513111 | Colorectum | CRC | Shigellosis | 59/1091 | 247/8465 | 1.19e-06 | 5.41e-05 | 3.66e-05 | 59 |
| hsa0413711 | Colorectum | CRC | Mitophagy - animal | 17/1091 | 72/8465 | 8.74e-03 | 4.00e-02 | 2.71e-02 | 17 |
| hsa0513139 | Esophagus | HGIN | Shigellosis | 71/1383 | 247/8465 | 4.89e-07 | 7.98e-06 | 6.34e-06 | 71 |
| hsa0413730 | Esophagus | HGIN | Mitophagy - animal | 23/1383 | 72/8465 | 7.69e-04 | 7.59e-03 | 6.03e-03 | 23 |
| hsa0516420 | Esophagus | HGIN | Influenza A | 42/1383 | 171/8465 | 3.41e-03 | 2.54e-02 | 2.02e-02 | 42 |
| hsa05131114 | Esophagus | HGIN | Shigellosis | 71/1383 | 247/8465 | 4.89e-07 | 7.98e-06 | 6.34e-06 | 71 |
| hsa04137113 | Esophagus | HGIN | Mitophagy - animal | 23/1383 | 72/8465 | 7.69e-04 | 7.59e-03 | 6.03e-03 | 23 |
| hsa05164110 | Esophagus | HGIN | Influenza A | 42/1383 | 171/8465 | 3.41e-03 | 2.54e-02 | 2.02e-02 | 42 |
| hsa05131211 | Esophagus | ESCC | Shigellosis | 176/4205 | 247/8465 | 2.27e-12 | 4.01e-11 | 2.05e-11 | 176 |
| hsa0516425 | Esophagus | ESCC | Influenza A | 122/4205 | 171/8465 | 5.01e-09 | 4.79e-08 | 2.45e-08 | 122 |
| Page: 1 2 3 |
Top |
Cell-cell communication analysis |
| Identification of potential cell-cell interactions between two cell types and their ligand-receptor pairs for different disease states |
| Ligand | Receptor | LRpair | Pathway | Tissue | Disease Stage |
| Page: 1 |
Top |
Single-cell gene regulatory network inference analysis |
| Find out the significant the regulons (TFs) and the target genes of each regulon across cell types for different disease states |
| TF | Cell Type | Tissue | Disease Stage | Target Gene | RSS | Regulon Activity |
| ∗The dot plots of a searched regulon are shown for all cell subpopulations in each disease state of each tissue based on the regulon specific score inferred using pySCENIC and by calculating the average expression. |
| Page: 1 |
Top |
Somatic mutation of malignant transformation related genes |
| Annotation of somatic variants for genes involved in malignant transformation |
| Hugo Symbol | Variant Class | Variant Classification | dbSNP RS | HGVSc | HGVSp | HGVSp Short | SWISSPROT | BIOTYPE | SIFT | PolyPhen | Tumor Sample Barcode | Tissue | Histology | Sex | Age | Stage | Therapy Types | Drugs | Outcome |
| CALCOCO2 | SNV | Missense_Mutation | c.742N>C | p.Glu248Gln | p.E248Q | Q13137 | protein_coding | tolerated(0.08) | benign(0.249) | TCGA-AN-A0XW-01 | Breast | breast invasive carcinoma | Female | <65 | III/IV | Unknown | Unknown | SD | |
| CALCOCO2 | SNV | Missense_Mutation | c.489N>C | p.Gln163His | p.Q163H | Q13137 | protein_coding | deleterious(0) | probably_damaging(0.987) | TCGA-D8-A1JA-01 | Breast | breast invasive carcinoma | Female | <65 | III/IV | Chemotherapy | adriamycin | PD | |
| CALCOCO2 | SNV | Missense_Mutation | c.712N>A | p.Glu238Lys | p.E238K | Q13137 | protein_coding | tolerated(0.08) | possibly_damaging(0.78) | TCGA-S3-AA14-01 | Breast | breast invasive carcinoma | Female | <65 | I/II | Chemotherapy | adriamycin | CR | |
| CALCOCO2 | SNV | Missense_Mutation | c.1073N>G | p.Glu358Gly | p.E358G | Q13137 | protein_coding | deleterious(0.02) | possibly_damaging(0.729) | TCGA-DR-A0ZM-01 | Cervix | cervical & endocervical cancer | Female | <65 | III/IV | Unspecific | Cisplatin | SD | |
| CALCOCO2 | SNV | Missense_Mutation | c.25C>T | p.Pro9Ser | p.P9S | Q13137 | protein_coding | deleterious(0.01) | probably_damaging(0.928) | TCGA-AA-3692-01 | Colorectum | colon adenocarcinoma | Female | <65 | III/IV | Chemotherapy | folinic | PD | |
| CALCOCO2 | SNV | Missense_Mutation | novel | c.840N>T | p.Glu280Asp | p.E280D | Q13137 | protein_coding | deleterious(0.04) | benign(0.281) | TCGA-CA-6717-01 | Colorectum | colon adenocarcinoma | Male | <65 | I/II | Chemotherapy | oxaliplatin | CR |
| CALCOCO2 | SNV | Missense_Mutation | rs769234486 | c.95N>G | p.Tyr32Cys | p.Y32C | Q13137 | protein_coding | deleterious(0.02) | possibly_damaging(0.5) | TCGA-AG-A01Y-01 | Colorectum | rectum adenocarcinoma | Female | <65 | I/II | Chemotherapy | 5-fluorouracil | CR |
| CALCOCO2 | SNV | Missense_Mutation | novel | c.912G>T | p.Lys304Asn | p.K304N | Q13137 | protein_coding | deleterious(0.04) | possibly_damaging(0.511) | TCGA-AJ-A2QO-01 | Endometrium | uterine corpus endometrioid carcinoma | Female | >=65 | I/II | Unknown | Unknown | SD |
| CALCOCO2 | SNV | Missense_Mutation | c.544G>A | p.Glu182Lys | p.E182K | Q13137 | protein_coding | tolerated(0.15) | benign(0.02) | TCGA-AP-A0LM-01 | Endometrium | uterine corpus endometrioid carcinoma | Female | <65 | III/IV | Chemotherapy | cisplatin | SD | |
| CALCOCO2 | SNV | Missense_Mutation | rs759040135 | c.1244C>T | p.Pro415Leu | p.P415L | Q13137 | protein_coding | tolerated(1) | benign(0) | TCGA-AP-A0LM-01 | Endometrium | uterine corpus endometrioid carcinoma | Female | <65 | III/IV | Chemotherapy | cisplatin | SD |
| Page: 1 2 3 4 |
Top |
Related drugs of malignant transformation related genes |
| Identification of chemicals and drugs interact with genes involved in malignant transfromation |
| (DGIdb 4.0) |
| Entrez ID | Symbol | Category | Interaction Types | Drug Claim Name | Drug Name | PMIDs |
| Page: 1 |

Copyright 2023-Present -The University of Texas Health Science Center at Houston |