
|
|||||
|
 | |
| |
| |
| |
| |
| |
|
Gene: CALCOCO1 |
Gene summary for CALCOCO1 |
| Gene information | Species | Human | Gene symbol | CALCOCO1 | Gene ID | 57658 |
| Gene name | calcium binding and coiled-coil domain 1 | |
| Gene Alias | Cocoa | |
| Cytomap | 12q13.13 | |
| Gene Type | protein-coding | GO ID | GO:0006139 | UniProtAcc | Q9P1Z2 |
Top |
Malignant transformation analysis |
| Identification of the aberrant gene expression in precancerous and cancerous lesions by comparing the gene expression of stem-like cells in diseased tissues with normal stem cells |
| Entrez ID | Symbol | Replicates | Species | Organ | Tissue | Adj P-value | Log2FC | Malignancy |
| 57658 | CALCOCO1 | LZE8T | Human | Esophagus | ESCC | 3.38e-04 | 7.60e-02 | 0.067 |
| 57658 | CALCOCO1 | LZE20T | Human | Esophagus | ESCC | 8.10e-07 | 8.38e-02 | 0.0662 |
| 57658 | CALCOCO1 | LZE24T | Human | Esophagus | ESCC | 3.17e-21 | 5.41e-01 | 0.0596 |
| 57658 | CALCOCO1 | P1T-E | Human | Esophagus | ESCC | 8.63e-10 | 4.57e-01 | 0.0875 |
| 57658 | CALCOCO1 | P2T-E | Human | Esophagus | ESCC | 2.02e-21 | 4.39e-01 | 0.1177 |
| 57658 | CALCOCO1 | P4T-E | Human | Esophagus | ESCC | 1.71e-03 | 2.26e-02 | 0.1323 |
| 57658 | CALCOCO1 | P8T-E | Human | Esophagus | ESCC | 8.63e-31 | 5.13e-01 | 0.0889 |
| 57658 | CALCOCO1 | P9T-E | Human | Esophagus | ESCC | 2.78e-02 | 5.56e-02 | 0.1131 |
| 57658 | CALCOCO1 | P10T-E | Human | Esophagus | ESCC | 9.45e-21 | 2.66e-01 | 0.116 |
| 57658 | CALCOCO1 | P11T-E | Human | Esophagus | ESCC | 7.65e-07 | 4.37e-01 | 0.1426 |
| 57658 | CALCOCO1 | P12T-E | Human | Esophagus | ESCC | 2.15e-15 | 1.79e-01 | 0.1122 |
| 57658 | CALCOCO1 | P15T-E | Human | Esophagus | ESCC | 9.67e-12 | 2.43e-01 | 0.1149 |
| 57658 | CALCOCO1 | P16T-E | Human | Esophagus | ESCC | 2.52e-21 | 2.84e-01 | 0.1153 |
| 57658 | CALCOCO1 | P17T-E | Human | Esophagus | ESCC | 2.49e-05 | 4.96e-01 | 0.1278 |
| 57658 | CALCOCO1 | P19T-E | Human | Esophagus | ESCC | 6.77e-05 | 3.21e-01 | 0.1662 |
| 57658 | CALCOCO1 | P20T-E | Human | Esophagus | ESCC | 9.72e-18 | 4.14e-01 | 0.1124 |
| 57658 | CALCOCO1 | P21T-E | Human | Esophagus | ESCC | 5.98e-08 | 9.35e-02 | 0.1617 |
| 57658 | CALCOCO1 | P22T-E | Human | Esophagus | ESCC | 5.57e-15 | 9.23e-02 | 0.1236 |
| 57658 | CALCOCO1 | P23T-E | Human | Esophagus | ESCC | 2.41e-09 | 3.30e-01 | 0.108 |
| 57658 | CALCOCO1 | P24T-E | Human | Esophagus | ESCC | 1.78e-10 | 1.98e-01 | 0.1287 |
| Page: 1 2 3 4 |
| Tissue | Expression Dynamics | Abbreviation |
| Esophagus | 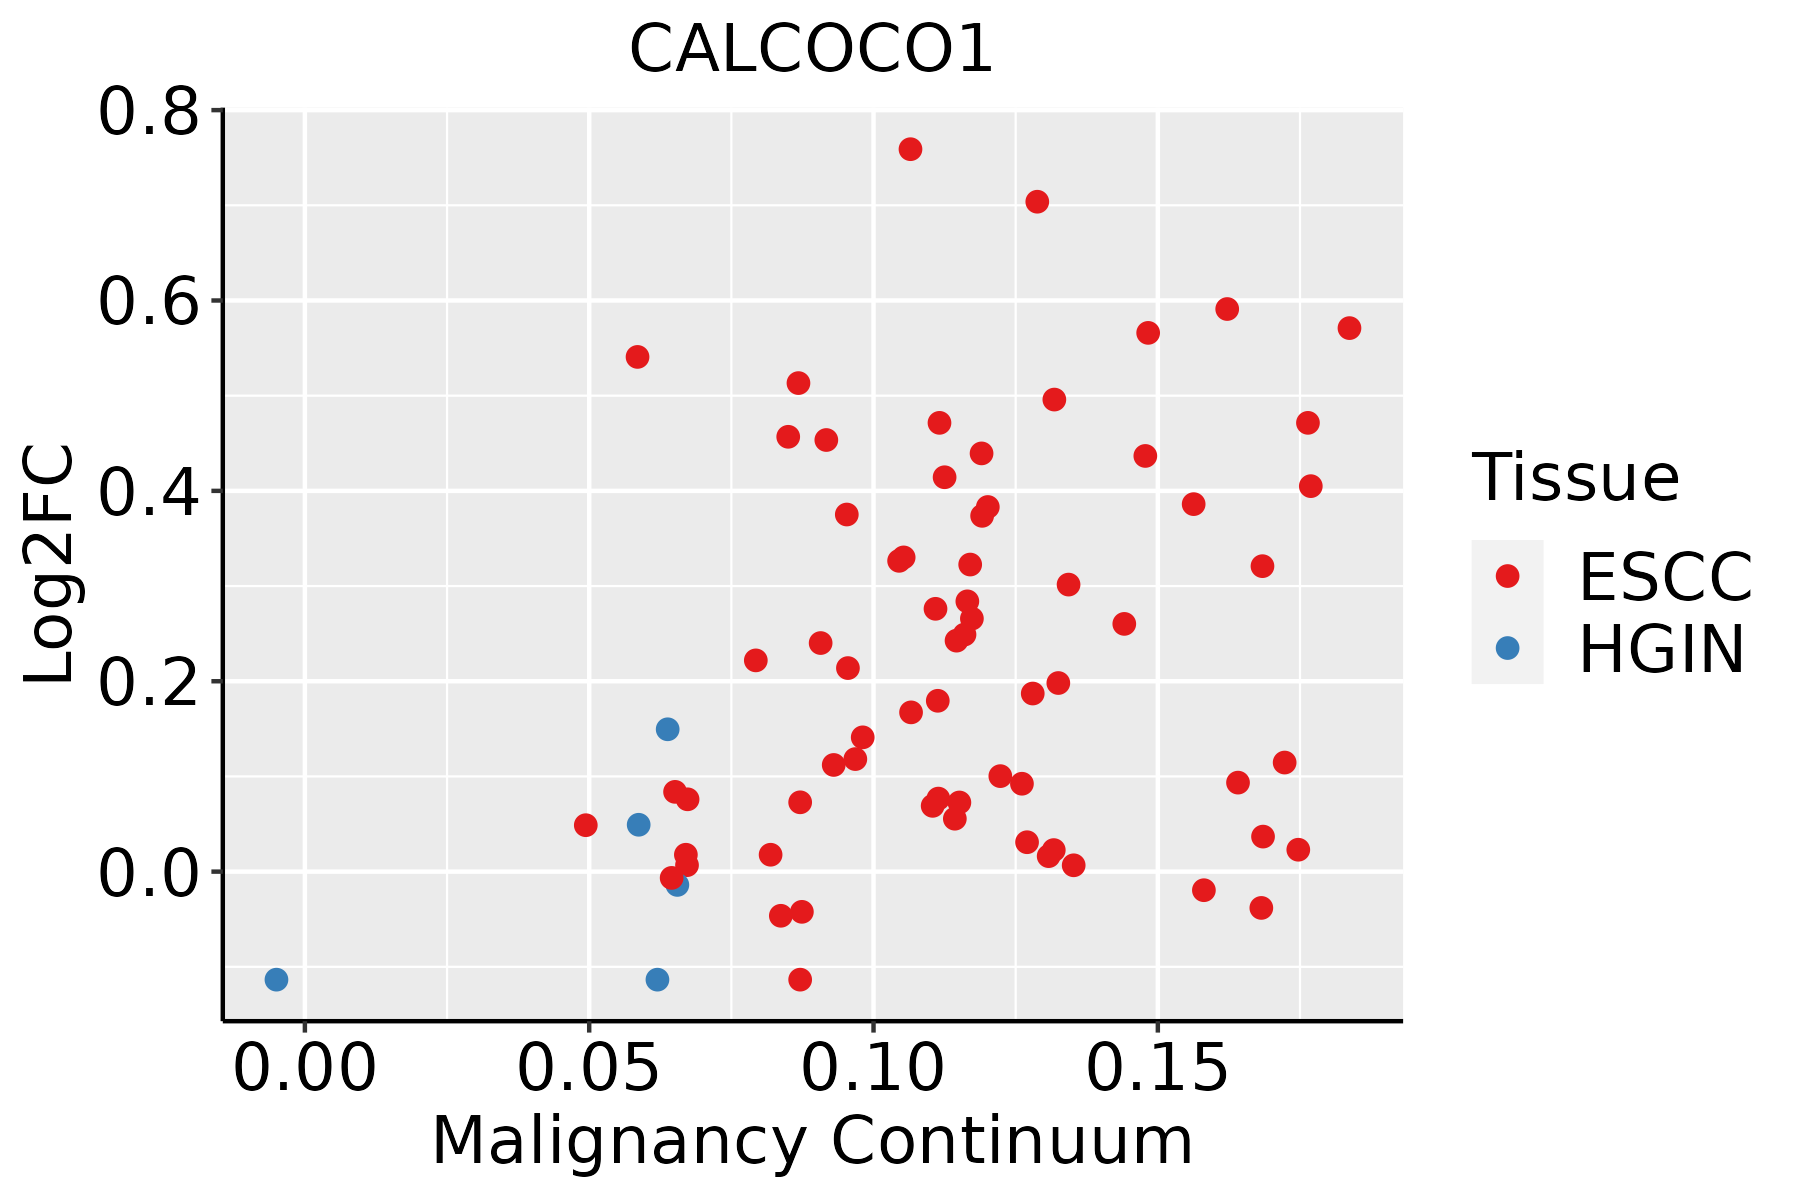 | ESCC: Esophageal squamous cell carcinoma |
| HGIN: High-grade intraepithelial neoplasias | ||
| LGIN: Low-grade intraepithelial neoplasias | ||
| Liver | 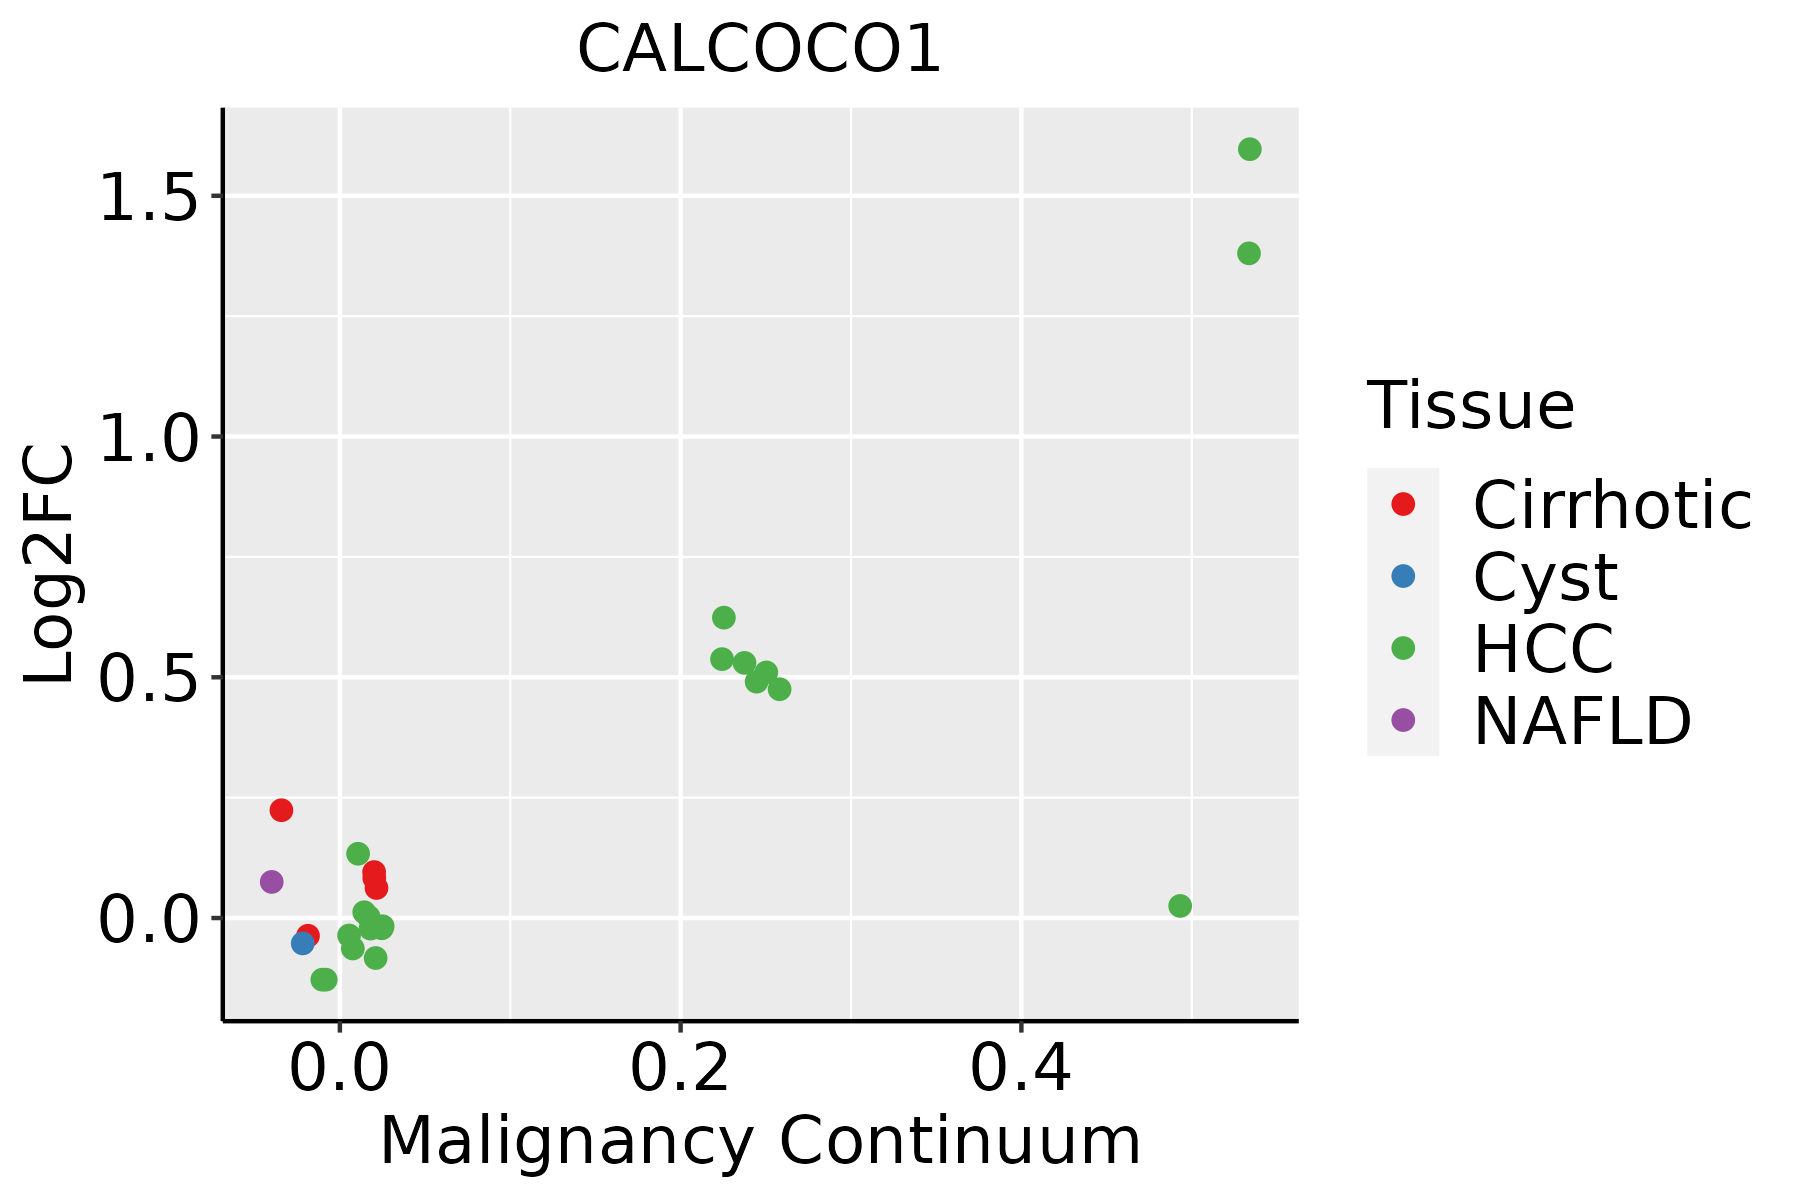 | HCC: Hepatocellular carcinoma |
| NAFLD: Non-alcoholic fatty liver disease | ||
| Thyroid | 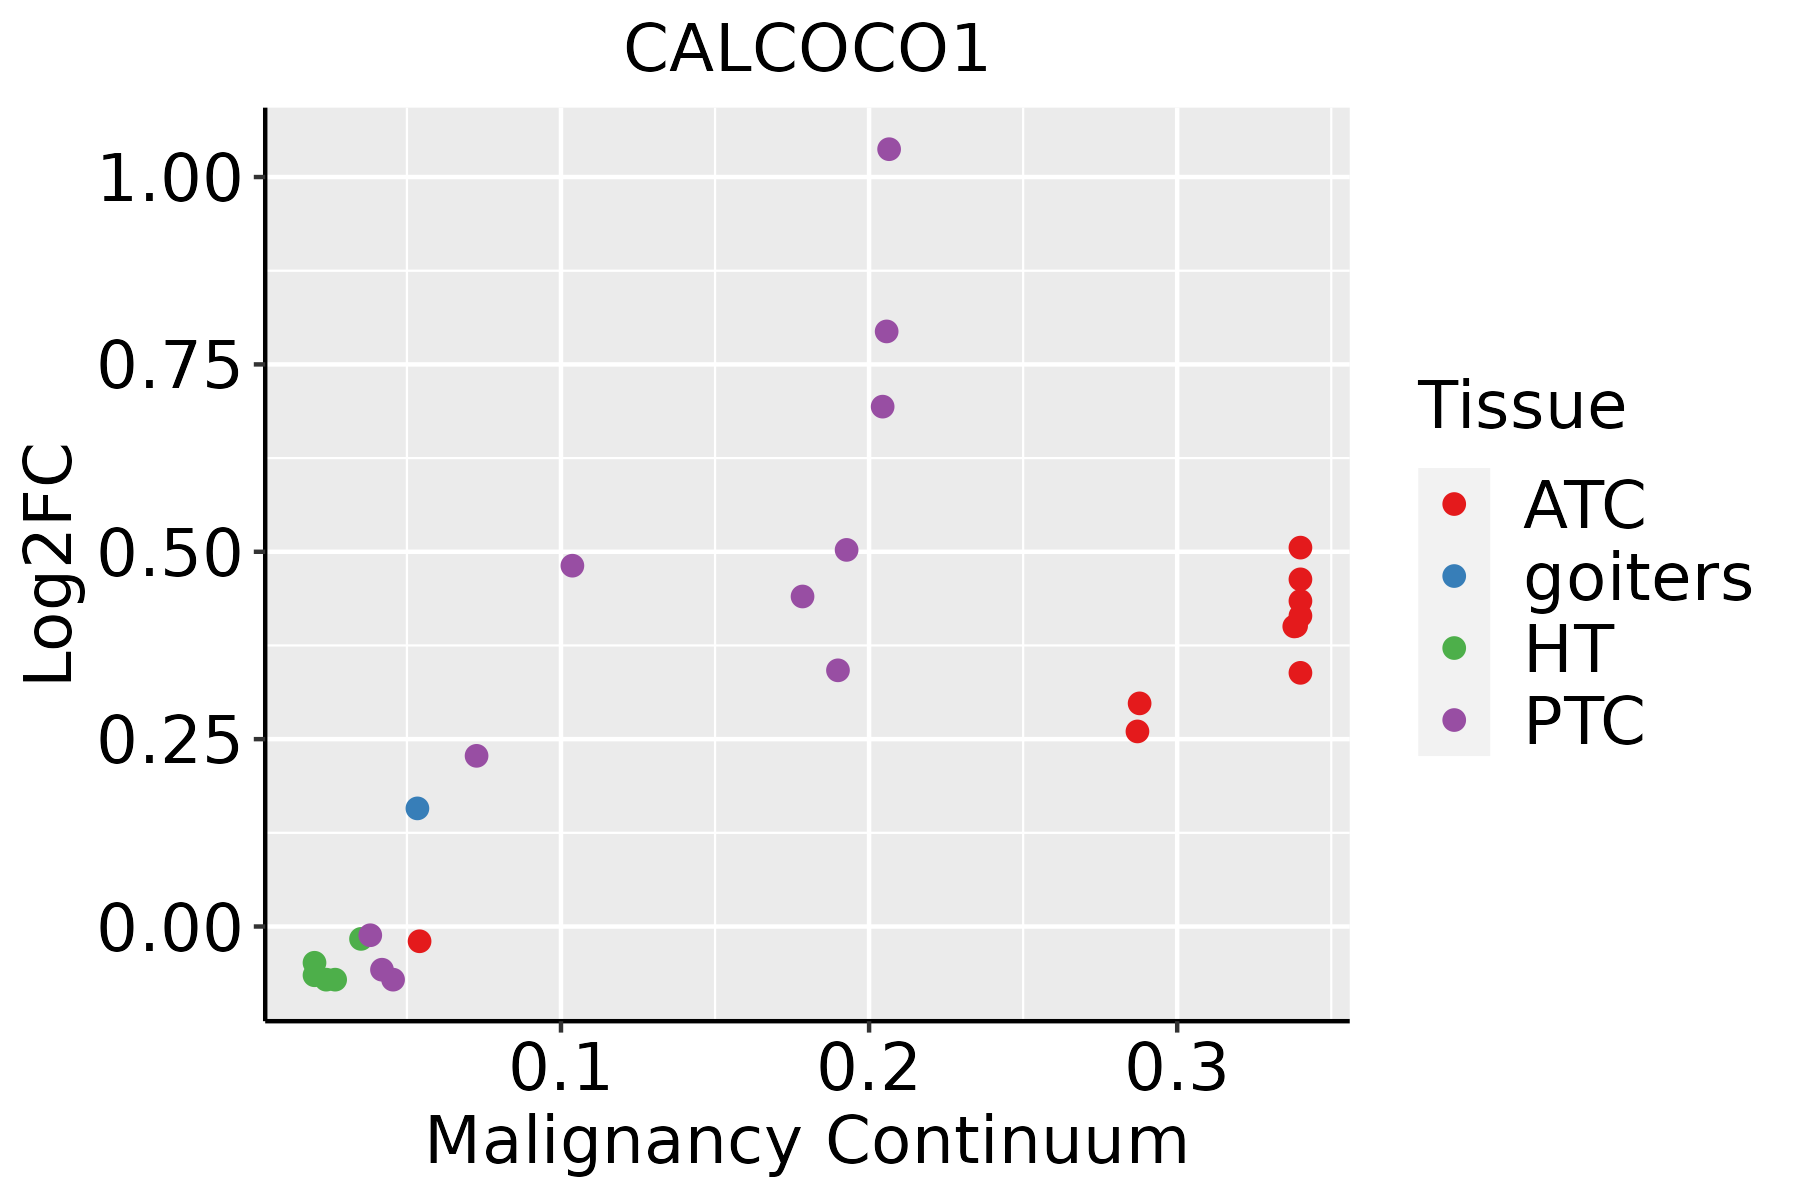 | ATC: Anaplastic thyroid cancer |
| HT: Hashimoto's thyroiditis | ||
| PTC: Papillary thyroid cancer |
| ∗log2FC in expression of this searched gene in stem-like cells from each diseased tissue sample relative to stem-like cells in normal samples in each tissue plotted against the malignancy continuum. Samples are colored based on if they are from different disease stage. |
Top |
Malignant transformation related pathway analysis |
| Find out the enriched GO biological processes and KEGG pathways involved in transition from healthy to precancer to cancer |
| Tissue | Disease Stage | Enriched GO biological Processes |
| Colorectum | AD |  |
| Colorectum | SER |  |
| Colorectum | MSS |  |
| Colorectum | MSI-H |  |
| Colorectum | FAP |  |
| ∗Top 15 enriched GO BP terms are showed in the bar plot of each disease state in each tissue. Each row represents a significant GO biological process which is colored according to the -log10(p.adjust). |
| Page: 1 2 3 4 5 6 7 8 9 |
| GO ID | Tissue | Disease Stage | Description | Gene Ratio | Bg Ratio | pvalue | p.adjust | Count |
| GO:001605517 | Esophagus | ESCC | Wnt signaling pathway | 268/8552 | 444/18723 | 2.32e-10 | 6.58e-09 | 268 |
| GO:019873817 | Esophagus | ESCC | cell-cell signaling by wnt | 269/8552 | 446/18723 | 2.41e-10 | 6.79e-09 | 269 |
| GO:0030522110 | Esophagus | ESCC | intracellular receptor signaling pathway | 170/8552 | 265/18723 | 8.58e-10 | 2.09e-08 | 170 |
| GO:0048545111 | Esophagus | ESCC | response to steroid hormone | 204/8552 | 339/18723 | 4.47e-08 | 8.11e-07 | 204 |
| GO:0071383110 | Esophagus | ESCC | cellular response to steroid hormone stimulus | 127/8552 | 204/18723 | 1.26e-06 | 1.55e-05 | 127 |
| GO:003051819 | Esophagus | ESCC | intracellular steroid hormone receptor signaling pathway | 76/8552 | 116/18723 | 1.25e-05 | 1.15e-04 | 76 |
| GO:004340119 | Esophagus | ESCC | steroid hormone mediated signaling pathway | 87/8552 | 136/18723 | 1.25e-05 | 1.15e-04 | 87 |
| GO:000975516 | Esophagus | ESCC | hormone-mediated signaling pathway | 106/8552 | 190/18723 | 3.13e-03 | 1.30e-02 | 106 |
| GO:004854512 | Liver | Cirrhotic | response to steroid hormone | 146/4634 | 339/18723 | 7.87e-14 | 6.76e-12 | 146 |
| GO:007138312 | Liver | Cirrhotic | cellular response to steroid hormone stimulus | 90/4634 | 204/18723 | 1.04e-09 | 4.70e-08 | 90 |
| GO:003052212 | Liver | Cirrhotic | intracellular receptor signaling pathway | 105/4634 | 265/18723 | 5.44e-08 | 1.69e-06 | 105 |
| GO:004340111 | Liver | Cirrhotic | steroid hormone mediated signaling pathway | 58/4634 | 136/18723 | 3.44e-06 | 5.95e-05 | 58 |
| GO:001605511 | Liver | Cirrhotic | Wnt signaling pathway | 150/4634 | 444/18723 | 9.75e-06 | 1.42e-04 | 150 |
| GO:003051811 | Liver | Cirrhotic | intracellular steroid hormone receptor signaling pathway | 50/4634 | 116/18723 | 1.11e-05 | 1.59e-04 | 50 |
| GO:019873811 | Liver | Cirrhotic | cell-cell signaling by wnt | 150/4634 | 446/18723 | 1.28e-05 | 1.80e-04 | 150 |
| GO:000975511 | Liver | Cirrhotic | hormone-mediated signaling pathway | 71/4634 | 190/18723 | 7.09e-05 | 7.98e-04 | 71 |
| GO:003052222 | Liver | HCC | intracellular receptor signaling pathway | 171/7958 | 265/18723 | 3.00e-13 | 1.61e-11 | 171 |
| GO:004854522 | Liver | HCC | response to steroid hormone | 206/7958 | 339/18723 | 6.81e-12 | 2.92e-10 | 206 |
| GO:007138322 | Liver | HCC | cellular response to steroid hormone stimulus | 128/7958 | 204/18723 | 3.92e-09 | 1.04e-07 | 128 |
| GO:019873821 | Liver | HCC | cell-cell signaling by wnt | 247/7958 | 446/18723 | 2.11e-08 | 4.96e-07 | 247 |
| Page: 1 2 |
| Pathway ID | Tissue | Disease Stage | Description | Gene Ratio | Bg Ratio | pvalue | p.adjust | qvalue | Count |
| Page: 1 |
Top |
Cell-cell communication analysis |
| Identification of potential cell-cell interactions between two cell types and their ligand-receptor pairs for different disease states |
| Ligand | Receptor | LRpair | Pathway | Tissue | Disease Stage |
| Page: 1 |
Top |
Single-cell gene regulatory network inference analysis |
| Find out the significant the regulons (TFs) and the target genes of each regulon across cell types for different disease states |
| TF | Cell Type | Tissue | Disease Stage | Target Gene | RSS | Regulon Activity |
| ∗The dot plots of a searched regulon are shown for all cell subpopulations in each disease state of each tissue based on the regulon specific score inferred using pySCENIC and by calculating the average expression. |
| Page: 1 |
Top |
Somatic mutation of malignant transformation related genes |
| Annotation of somatic variants for genes involved in malignant transformation |
| Hugo Symbol | Variant Class | Variant Classification | dbSNP RS | HGVSc | HGVSp | HGVSp Short | SWISSPROT | BIOTYPE | SIFT | PolyPhen | Tumor Sample Barcode | Tissue | Histology | Sex | Age | Stage | Therapy Types | Drugs | Outcome |
| CALCOCO1 | SNV | Missense_Mutation | novel | c.1774G>T | p.Asp592Tyr | p.D592Y | Q9P1Z2 | protein_coding | deleterious(0) | possibly_damaging(0.88) | TCGA-3C-AALJ-01 | Breast | breast invasive carcinoma | Female | <65 | I/II | Chemotherapy | doxorubicin | SD |
| CALCOCO1 | SNV | Missense_Mutation | c.1224N>C | p.Trp408Cys | p.W408C | Q9P1Z2 | protein_coding | deleterious(0) | probably_damaging(0.999) | TCGA-A2-A0CX-01 | Breast | breast invasive carcinoma | Female | <65 | I/II | Chemotherapy | adriamycin | SD | |
| CALCOCO1 | SNV | Missense_Mutation | rs747890587 | c.302G>A | p.Arg101Gln | p.R101Q | Q9P1Z2 | protein_coding | tolerated(0.06) | probably_damaging(0.92) | TCGA-AC-A8OQ-01 | Breast | breast invasive carcinoma | Female | >=65 | I/II | Unknown | Unknown | SD |
| CALCOCO1 | SNV | Missense_Mutation | novel | c.1070A>C | p.Gln357Pro | p.Q357P | Q9P1Z2 | protein_coding | deleterious(0.01) | probably_damaging(0.996) | TCGA-AQ-A54N-01 | Breast | breast invasive carcinoma | Female | <65 | I/II | Unknown | Unknown | SD |
| CALCOCO1 | SNV | Missense_Mutation | novel | c.312C>A | p.Asn104Lys | p.N104K | Q9P1Z2 | protein_coding | deleterious(0.03) | benign(0.007) | TCGA-BH-A0EE-01 | Breast | breast invasive carcinoma | Female | >=65 | I/II | Chemotherapy | docetaxel | SD |
| CALCOCO1 | deletion | Frame_Shift_Del | novel | c.1244delN | p.Leu415ArgfsTer13 | p.L415Rfs*13 | Q9P1Z2 | protein_coding | TCGA-EW-A2FV-01 | Breast | breast invasive carcinoma | Female | <65 | III/IV | Chemotherapy | docetaxel | SD | ||
| CALCOCO1 | SNV | Missense_Mutation | c.1186G>A | p.Glu396Lys | p.E396K | Q9P1Z2 | protein_coding | deleterious(0.04) | possibly_damaging(0.829) | TCGA-C5-A1BL-01 | Cervix | cervical & endocervical cancer | Female | <65 | I/II | Unknown | Unknown | SD | |
| CALCOCO1 | SNV | Missense_Mutation | rs371310406 | c.662G>A | p.Arg221Gln | p.R221Q | Q9P1Z2 | protein_coding | tolerated(0.63) | benign(0) | TCGA-EA-A3HQ-01 | Cervix | cervical & endocervical cancer | Female | <65 | I/II | Unknown | Unknown | SD |
| CALCOCO1 | SNV | Missense_Mutation | rs759644053 | c.176N>A | p.Arg59Gln | p.R59Q | Q9P1Z2 | protein_coding | deleterious(0.01) | probably_damaging(0.998) | TCGA-EA-A3HS-01 | Cervix | cervical & endocervical cancer | Female | <65 | I/II | Unknown | Unknown | SD |
| CALCOCO1 | SNV | Missense_Mutation | c.160G>A | p.Glu54Lys | p.E54K | Q9P1Z2 | protein_coding | tolerated(0.28) | possibly_damaging(0.542) | TCGA-JW-A5VL-01 | Cervix | cervical & endocervical cancer | Female | <65 | I/II | Unknown | Unknown | SD |
| Page: 1 2 3 4 5 6 |
Top |
Related drugs of malignant transformation related genes |
| Identification of chemicals and drugs interact with genes involved in malignant transfromation |
| (DGIdb 4.0) |
| Entrez ID | Symbol | Category | Interaction Types | Drug Claim Name | Drug Name | PMIDs |
| Page: 1 |

Copyright 2023-Present -The University of Texas Health Science Center at Houston |