
|
|||||
|
 | |
| |
| |
| |
| |
| |
|
Gene: CALCB |
Gene summary for CALCB |
| Gene information | Species | Human | Gene symbol | CALCB | Gene ID | 797 |
| Gene name | calcitonin related polypeptide beta | |
| Gene Alias | CALC2 | |
| Cytomap | 11p15.2 | |
| Gene Type | protein-coding | GO ID | GO:0006873 | UniProtAcc | P10092 |
Top |
Malignant transformation analysis |
| Identification of the aberrant gene expression in precancerous and cancerous lesions by comparing the gene expression of stem-like cells in diseased tissues with normal stem cells |
| Entrez ID | Symbol | Replicates | Species | Organ | Tissue | Adj P-value | Log2FC | Malignancy |
| 797 | CALCB | A015-C-203 | Human | Colorectum | FAP | 6.67e-06 | 3.63e-01 | -0.1294 |
| 797 | CALCB | A015-C-204 | Human | Colorectum | FAP | 1.12e-05 | 4.87e-01 | -0.0228 |
| 797 | CALCB | A002-C-201 | Human | Colorectum | FAP | 8.15e-03 | 3.67e-01 | 0.0324 |
| 797 | CALCB | A001-C-108 | Human | Colorectum | FAP | 2.12e-12 | 4.31e-01 | -0.0272 |
| 797 | CALCB | A002-C-021 | Human | Colorectum | FAP | 1.07e-07 | 2.25e-01 | 0.1171 |
| 797 | CALCB | A014-C-108 | Human | Colorectum | FAP | 2.19e-04 | 3.71e-01 | -0.124 |
| 797 | CALCB | A001-C-104 | Human | Colorectum | FAP | 4.36e-10 | 3.75e-01 | 0.0184 |
| 797 | CALCB | A015-C-106 | Human | Colorectum | FAP | 1.28e-03 | 2.86e-01 | -0.0511 |
| 797 | CALCB | A015-C-104 | Human | Colorectum | FAP | 6.06e-07 | 3.75e-01 | -0.1899 |
| 797 | CALCB | A001-C-014 | Human | Colorectum | FAP | 1.62e-13 | 5.18e-01 | 0.0135 |
| 797 | CALCB | A002-C-016 | Human | Colorectum | FAP | 6.56e-06 | 4.11e-01 | 0.0521 |
| 797 | CALCB | A015-C-002 | Human | Colorectum | FAP | 9.84e-04 | 5.02e-01 | -0.0763 |
| 797 | CALCB | A001-C-007 | Human | Colorectum | CRC | 1.08e-06 | 5.85e-01 | 0.1899 |
| 797 | CALCB | A001-C-203 | Human | Colorectum | FAP | 3.31e-10 | 4.12e-01 | -0.0481 |
| 797 | CALCB | A008-E-015 | Human | Colorectum | FAP | 8.78e-07 | 1.93e-01 | 0.0177 |
| 797 | CALCB | A014-C-008 | Human | Colorectum | FAP | 1.35e-02 | 4.18e-01 | -0.191 |
| 797 | CALCB | A018-E-020 | Human | Colorectum | FAP | 3.11e-07 | 5.33e-01 | -0.2034 |
| 797 | CALCB | F034 | Human | Colorectum | FAP | 1.79e-07 | 4.07e-01 | -0.0665 |
| 797 | CALCB | F072B | Human | Colorectum | FAP | 4.08e-03 | 2.53e-01 | 0.257 |
| 797 | CALCB | CRC-1-8810 | Human | Colorectum | CRC | 4.48e-02 | 1.64e-01 | 0.6257 |
| Page: 1 2 |
| Tissue | Expression Dynamics | Abbreviation |
| Colorectum (GSE201348) | 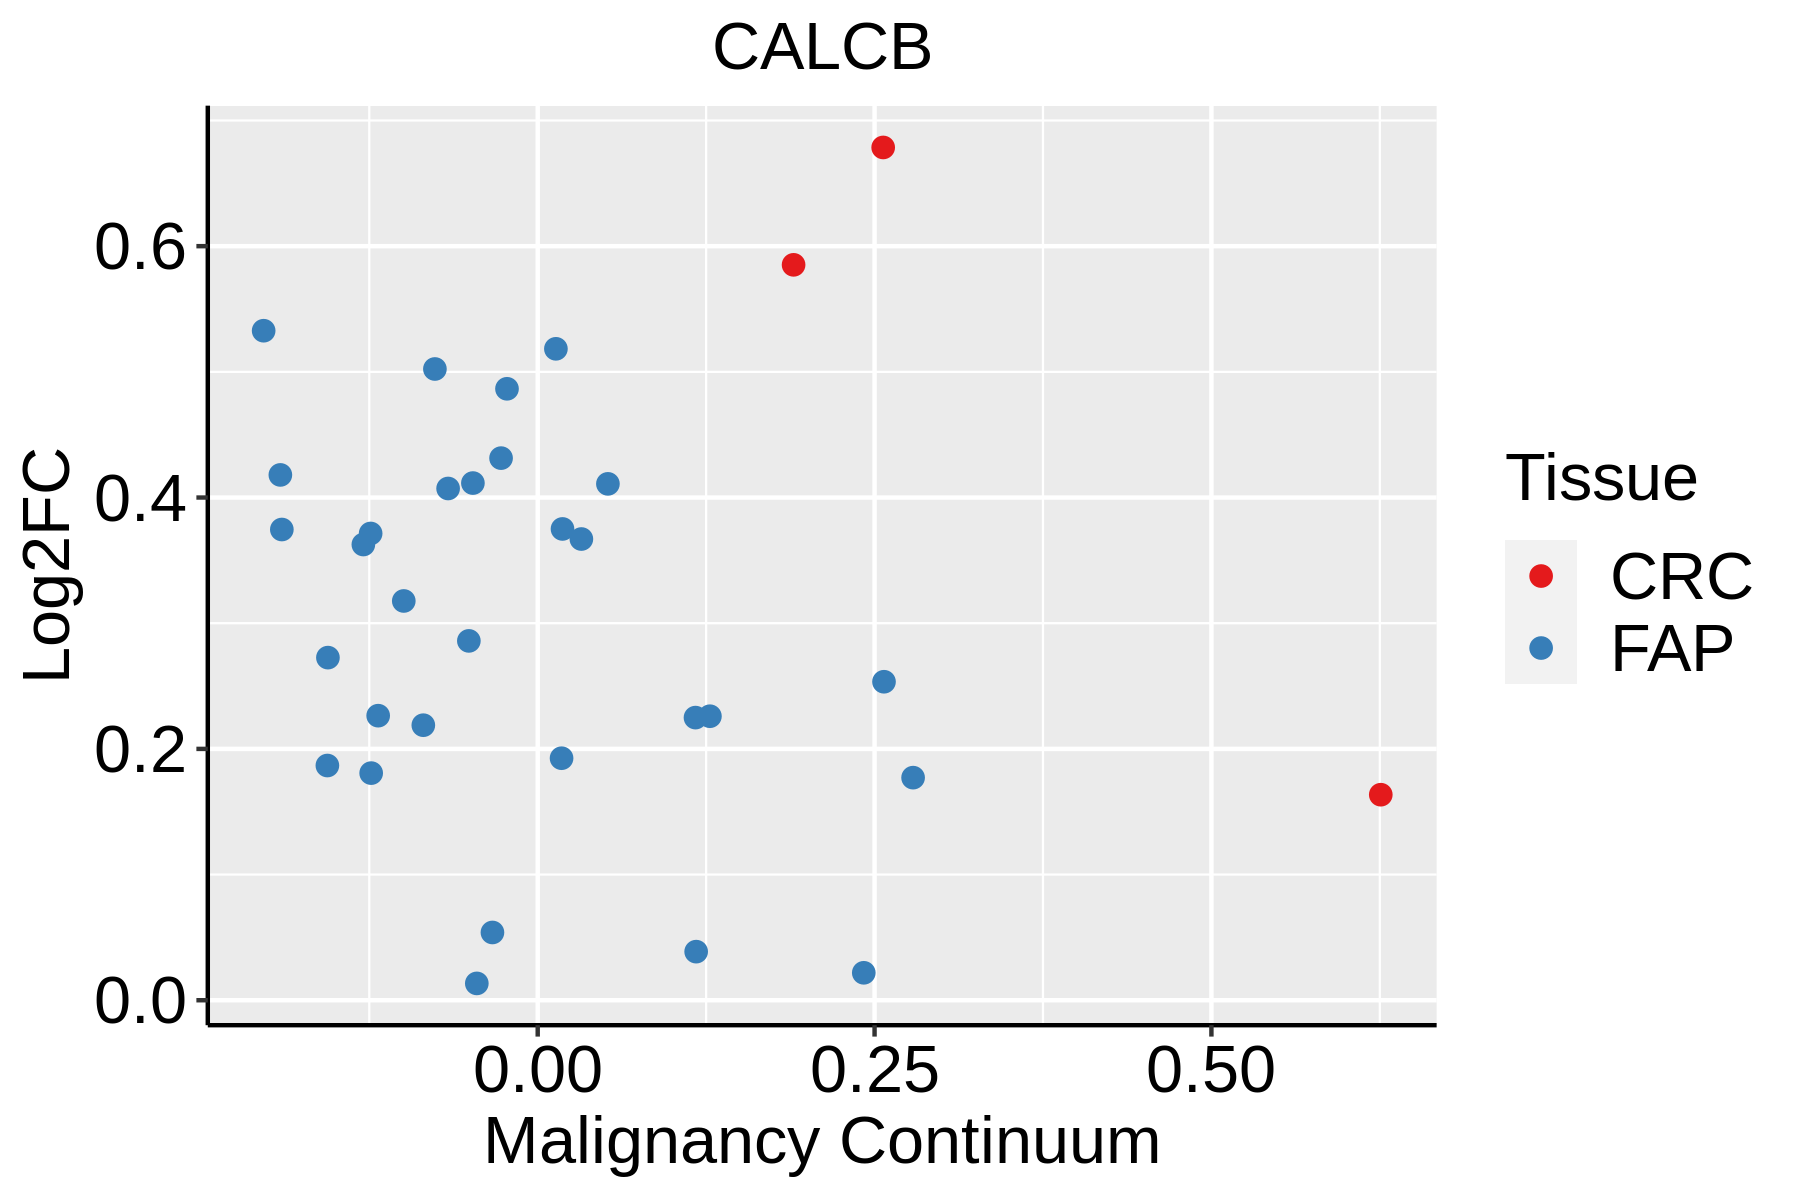 | FAP: Familial adenomatous polyposis |
| CRC: Colorectal cancer | ||
| Colorectum (HTA11) |  | AD: Adenomas |
| SER: Sessile serrated lesions | ||
| MSI-H: Microsatellite-high colorectal cancer | ||
| MSS: Microsatellite stable colorectal cancer |
| ∗log2FC in expression of this searched gene in stem-like cells from each diseased tissue sample relative to stem-like cells in normal samples in each tissue plotted against the malignancy continuum. Samples are colored based on if they are from different disease stage. |
Top |
Malignant transformation related pathway analysis |
| Find out the enriched GO biological processes and KEGG pathways involved in transition from healthy to precancer to cancer |
| Tissue | Disease Stage | Enriched GO biological Processes |
| Colorectum | AD |  |
| Colorectum | SER |  |
| Colorectum | MSS |  |
| Colorectum | MSI-H |  |
| Colorectum | FAP |  |
| ∗Top 15 enriched GO BP terms are showed in the bar plot of each disease state in each tissue. Each row represents a significant GO biological process which is colored according to the -log10(p.adjust). |
| Page: 1 2 3 4 5 6 7 8 9 |
| GO ID | Tissue | Disease Stage | Description | Gene Ratio | Bg Ratio | pvalue | p.adjust | Count |
| Page: 1 |
| Pathway ID | Tissue | Disease Stage | Description | Gene Ratio | Bg Ratio | pvalue | p.adjust | qvalue | Count |
| hsa04270 | Colorectum | FAP | Vascular smooth muscle contraction | 33/1404 | 134/8465 | 1.05e-02 | 3.74e-02 | 2.28e-02 | 33 |
| hsa042701 | Colorectum | FAP | Vascular smooth muscle contraction | 33/1404 | 134/8465 | 1.05e-02 | 3.74e-02 | 2.28e-02 | 33 |
| hsa042702 | Colorectum | CRC | Vascular smooth muscle contraction | 27/1091 | 134/8465 | 1.13e-02 | 4.90e-02 | 3.32e-02 | 27 |
| hsa042703 | Colorectum | CRC | Vascular smooth muscle contraction | 27/1091 | 134/8465 | 1.13e-02 | 4.90e-02 | 3.32e-02 | 27 |
| Page: 1 |
Top |
Cell-cell communication analysis |
| Identification of potential cell-cell interactions between two cell types and their ligand-receptor pairs for different disease states |
| Ligand | Receptor | LRpair | Pathway | Tissue | Disease Stage |
| CALCB | CALCRL | CALCB_CALCRL | CALCR | CRC | CRC |
| Page: 1 |
Top |
Single-cell gene regulatory network inference analysis |
| Find out the significant the regulons (TFs) and the target genes of each regulon across cell types for different disease states |
| TF | Cell Type | Tissue | Disease Stage | Target Gene | RSS | Regulon Activity |
| ∗The dot plots of a searched regulon are shown for all cell subpopulations in each disease state of each tissue based on the regulon specific score inferred using pySCENIC and by calculating the average expression. |
| Page: 1 |
Top |
Somatic mutation of malignant transformation related genes |
| Annotation of somatic variants for genes involved in malignant transformation |
| Hugo Symbol | Variant Class | Variant Classification | dbSNP RS | HGVSc | HGVSp | HGVSp Short | SWISSPROT | BIOTYPE | SIFT | PolyPhen | Tumor Sample Barcode | Tissue | Histology | Sex | Age | Stage | Therapy Types | Drugs | Outcome |
| CALCB | insertion | Frame_Shift_Ins | novel | c.349_350insAAAA | p.Ala117GlufsTer16 | p.A117Efs*16 | P10092 | protein_coding | TCGA-AN-A04C-01 | Breast | breast invasive carcinoma | Female | <65 | I/II | Unknown | Unknown | SD | ||
| CALCB | insertion | Nonsense_Mutation | novel | c.350_351insTGATAGAAAATGAAATGGGGAGGTGTGGAATCGTTCA | p.Phe118AspfsTer4 | p.F118Dfs*4 | P10092 | protein_coding | TCGA-AN-A04C-01 | Breast | breast invasive carcinoma | Female | <65 | I/II | Unknown | Unknown | SD | ||
| CALCB | SNV | Missense_Mutation | c.242N>C | p.Arg81Thr | p.R81T | P10092 | protein_coding | deleterious(0) | probably_damaging(0.998) | TCGA-IR-A3LH-01 | Cervix | cervical & endocervical cancer | Female | <65 | I/II | Chemotherapy | cisplatin | CR | |
| CALCB | SNV | Missense_Mutation | c.242N>C | p.Arg81Thr | p.R81T | P10092 | protein_coding | deleterious(0) | probably_damaging(0.998) | TCGA-JW-A5VL-01 | Cervix | cervical & endocervical cancer | Female | <65 | I/II | Unknown | Unknown | SD | |
| CALCB | SNV | Missense_Mutation | novel | c.152C>T | p.Ala51Val | p.A51V | P10092 | protein_coding | tolerated(0.07) | benign(0.045) | TCGA-AA-A00N-01 | Colorectum | colon adenocarcinoma | Male | >=65 | I/II | Unknown | Unknown | PD |
| CALCB | SNV | Missense_Mutation | c.94N>A | p.Leu32Met | p.L32M | P10092 | protein_coding | deleterious(0.03) | possibly_damaging(0.897) | TCGA-AG-A002-01 | Colorectum | rectum adenocarcinoma | Male | <65 | I/II | Unknown | Unknown | SD | |
| CALCB | SNV | Missense_Mutation | novel | c.250A>G | p.Asn84Asp | p.N84D | P10092 | protein_coding | tolerated(0.08) | possibly_damaging(0.756) | TCGA-D1-A175-01 | Endometrium | uterine corpus endometrioid carcinoma | Female | <65 | I/II | Chemotherapy | paclitaxel | SD |
| CALCB | SNV | Missense_Mutation | c.216G>T | p.Gln72His | p.Q72H | P10092 | protein_coding | deleterious(0.01) | benign(0.183) | TCGA-D1-A177-01 | Endometrium | uterine corpus endometrioid carcinoma | Female | >=65 | I/II | Unknown | Unknown | PD | |
| CALCB | SNV | Missense_Mutation | novel | c.49C>A | p.Leu17Met | p.L17M | P10092 | protein_coding | tolerated(0.06) | possibly_damaging(0.906) | TCGA-D1-A1NZ-01 | Endometrium | uterine corpus endometrioid carcinoma | Female | <65 | I/II | Unknown | Unknown | SD |
| CALCB | SNV | Missense_Mutation | novel | c.34N>A | p.Leu12Ile | p.L12I | P10092 | protein_coding | tolerated(0.12) | benign(0.125) | TCGA-DF-A2KU-01 | Endometrium | uterine corpus endometrioid carcinoma | Female | Unknown | I/II | Unknown | Unknown | SD |
| Page: 1 2 |
Top |
Related drugs of malignant transformation related genes |
| Identification of chemicals and drugs interact with genes involved in malignant transfromation |
| (DGIdb 4.0) |
| Entrez ID | Symbol | Category | Interaction Types | Drug Claim Name | Drug Name | PMIDs |
| 797 | CALCB | DRUGGABLE GENOME | inhibitor | CHEMBL3833320 | EPTINEZUMAB |
| Page: 1 |

Copyright 2023-Present -The University of Texas Health Science Center at Houston |