
|
|||||
|
 | |
| |
| |
| |
| |
| |
|
Gene: CALB1 |
Gene summary for CALB1 |
| Gene information | Species | Human | Gene symbol | CALB1 | Gene ID | 793 |
| Gene name | calbindin 1 | |
| Gene Alias | CALB | |
| Cytomap | 8q21.3 | |
| Gene Type | protein-coding | GO ID | GO:0001654 | UniProtAcc | P05937 |
Top |
Malignant transformation analysis |
| Identification of the aberrant gene expression in precancerous and cancerous lesions by comparing the gene expression of stem-like cells in diseased tissues with normal stem cells |
| Entrez ID | Symbol | Replicates | Species | Organ | Tissue | Adj P-value | Log2FC | Malignancy |
| 793 | CALB1 | L1 | Human | Cervix | CC | 5.22e-20 | 7.09e-01 | 0.0802 |
| 793 | CALB1 | C04 | Human | Oral cavity | OSCC | 6.21e-03 | 3.40e-01 | 0.2633 |
| 793 | CALB1 | C38 | Human | Oral cavity | OSCC | 1.52e-05 | 1.14e+00 | 0.172 |
| 793 | CALB1 | C57 | Human | Oral cavity | OSCC | 7.19e-66 | 2.74e+00 | 0.1679 |
| 793 | CALB1 | LN38 | Human | Oral cavity | OSCC | 1.54e-03 | 4.85e-01 | 0.168 |
| 793 | CALB1 | SYSMH1 | Human | Oral cavity | OSCC | 8.75e-05 | 3.11e-01 | 0.1127 |
| 793 | CALB1 | SYSMH3 | Human | Oral cavity | OSCC | 8.81e-25 | 9.85e-01 | 0.2442 |
| 793 | CALB1 | ATC13 | Human | Thyroid | ATC | 5.96e-08 | 5.71e-01 | 0.34 |
| 793 | CALB1 | ATC5 | Human | Thyroid | ATC | 9.50e-14 | 5.97e-01 | 0.34 |
| Page: 1 |
| Tissue | Expression Dynamics | Abbreviation |
| Cervix | 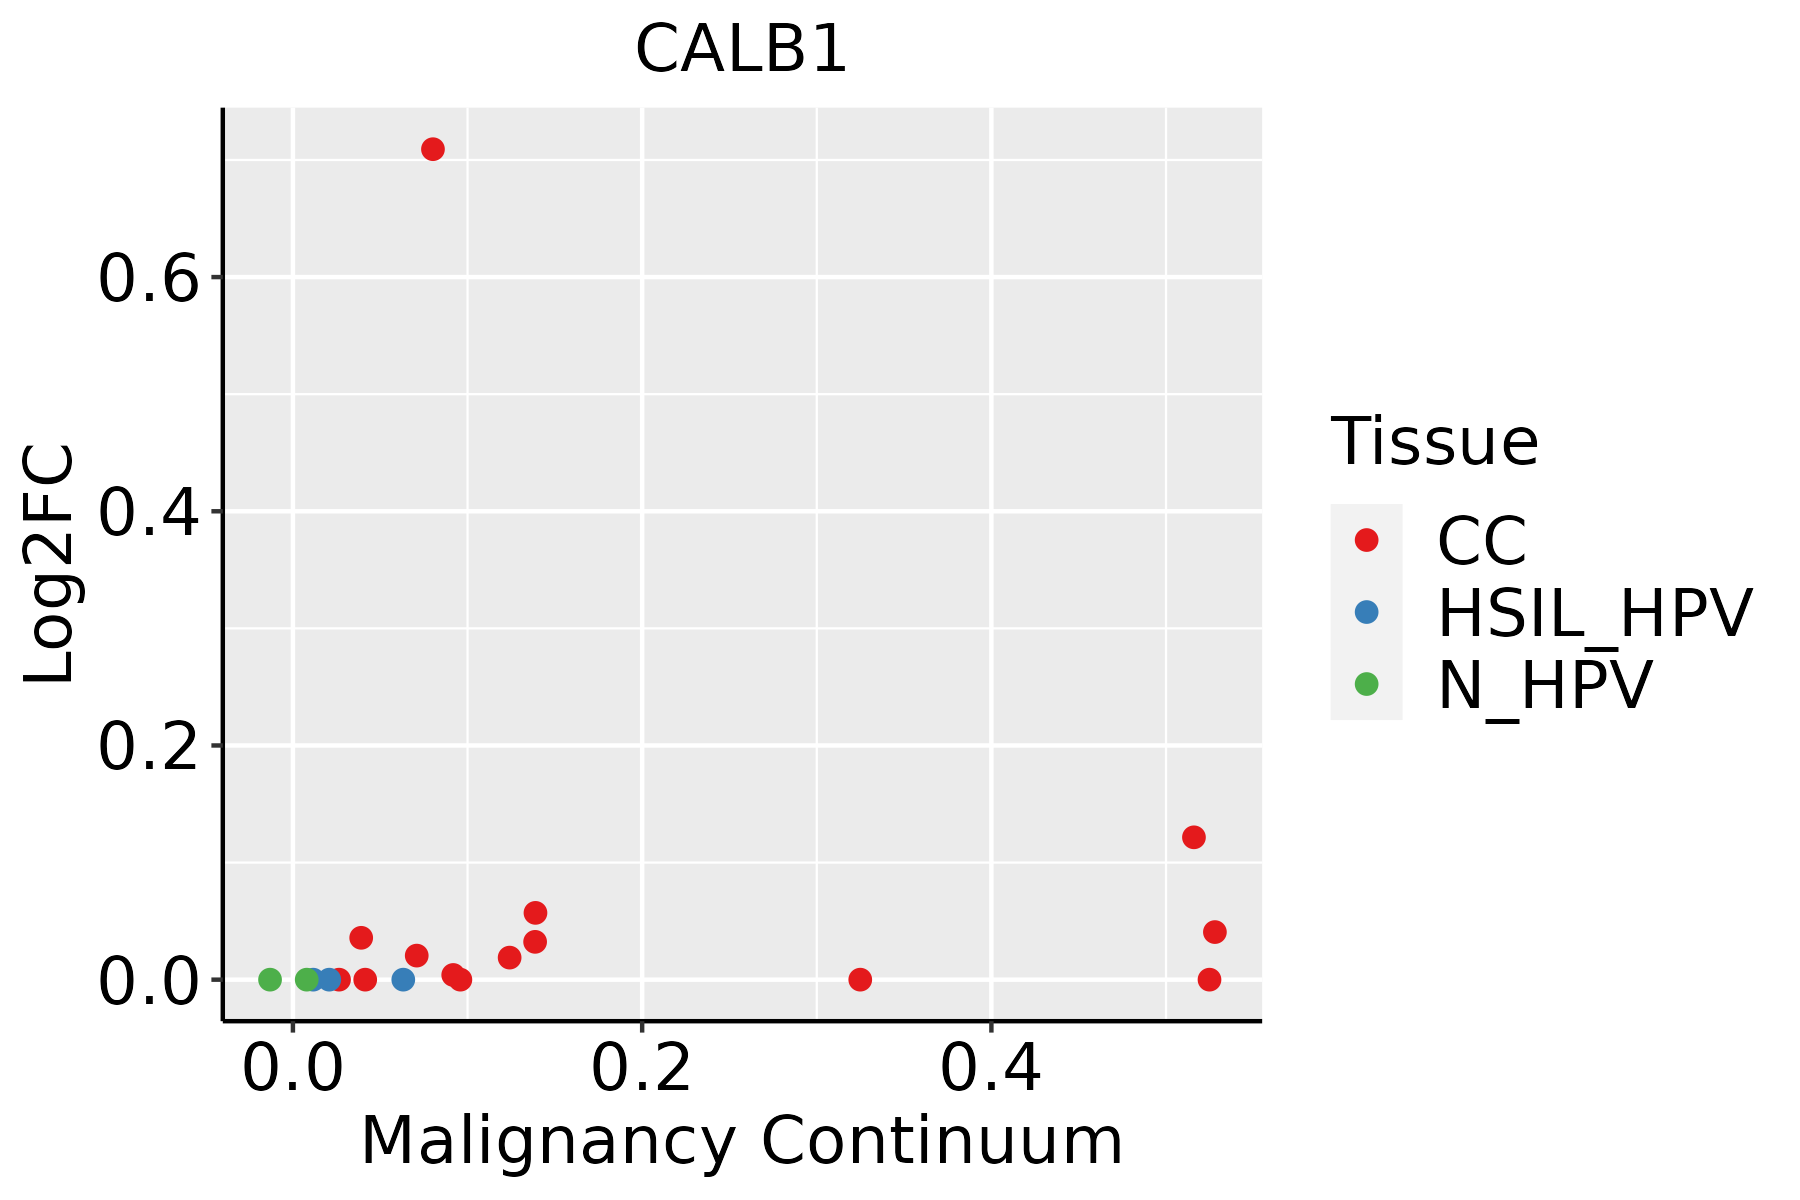 | CC: Cervix cancer |
| HSIL_HPV: HPV-infected high-grade squamous intraepithelial lesions | ||
| N_HPV: HPV-infected normal cervix | ||
| Oral Cavity | 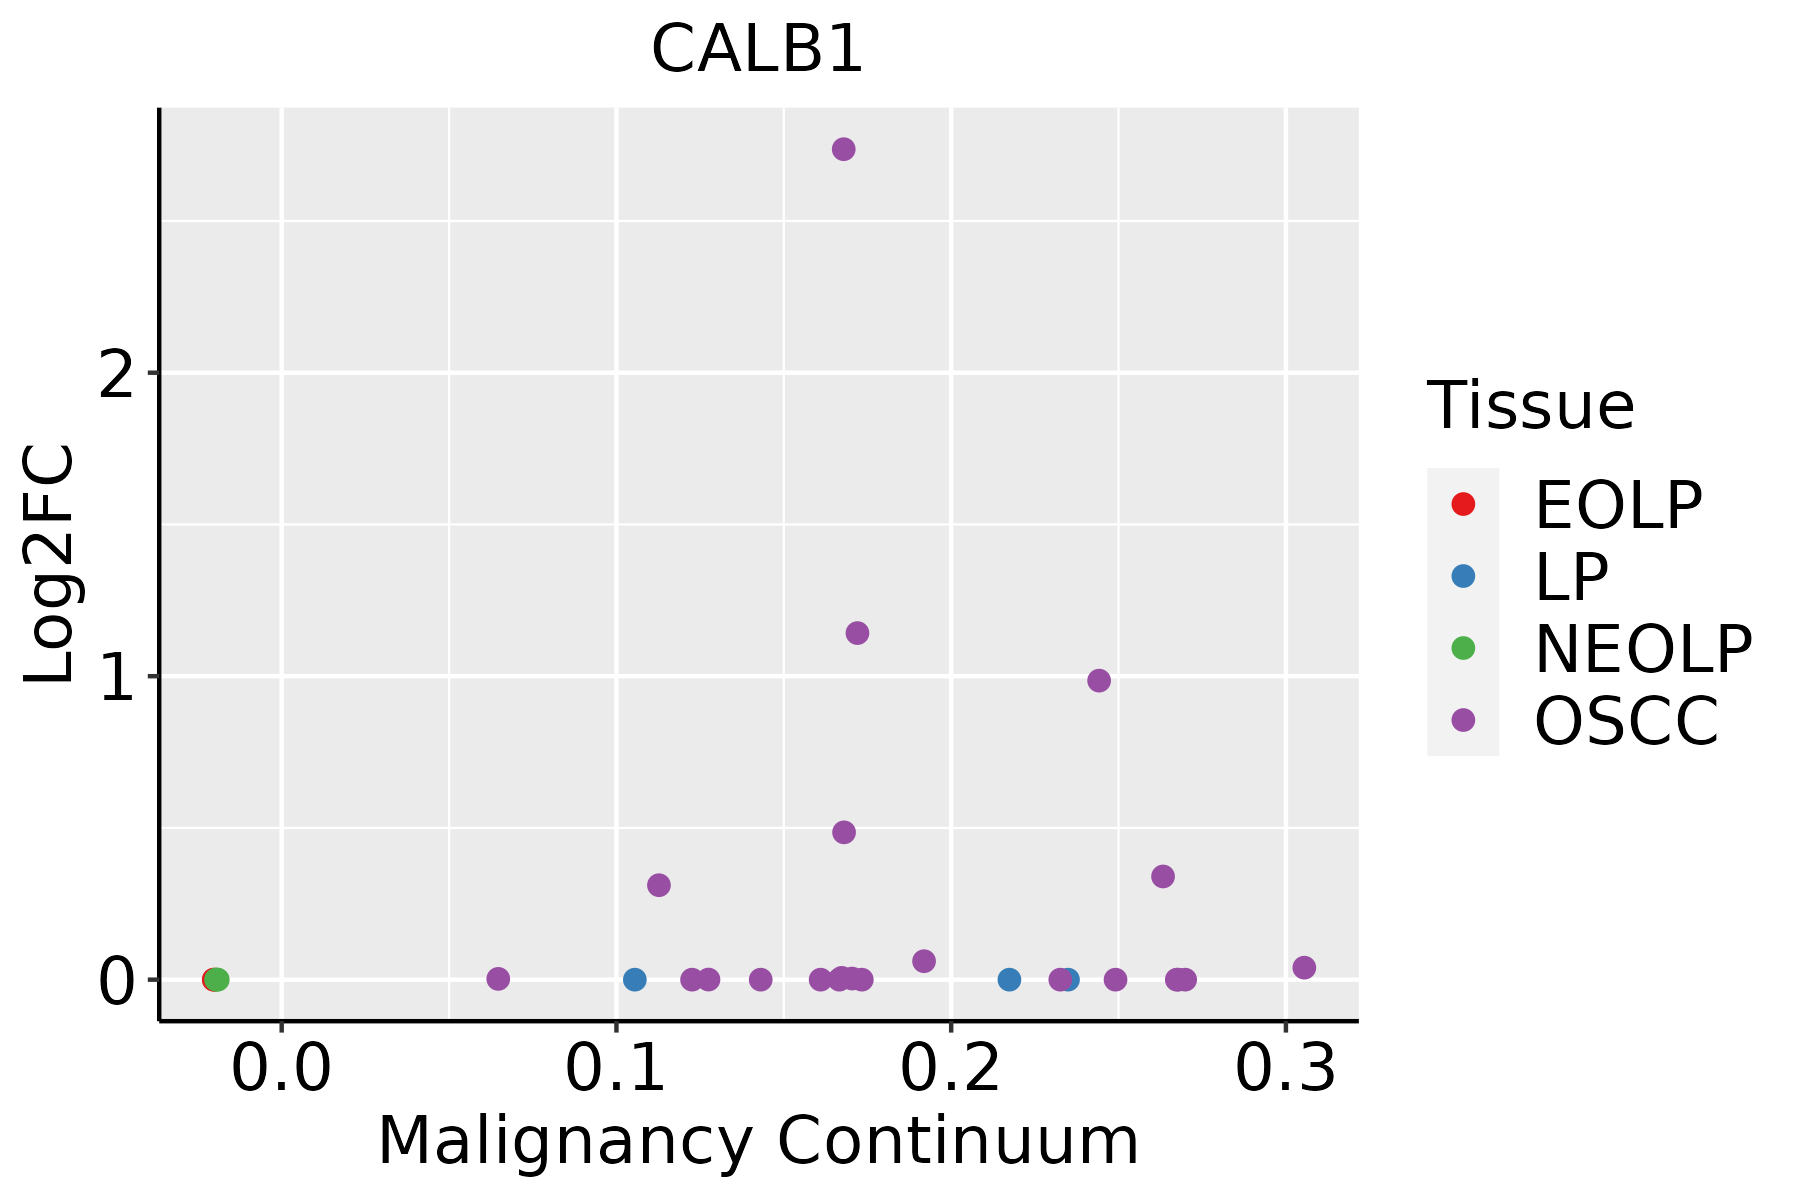 | EOLP: Erosive Oral lichen planus |
| LP: leukoplakia | ||
| NEOLP: Non-erosive oral lichen planus | ||
| OSCC: Oral squamous cell carcinoma | ||
| Thyroid | 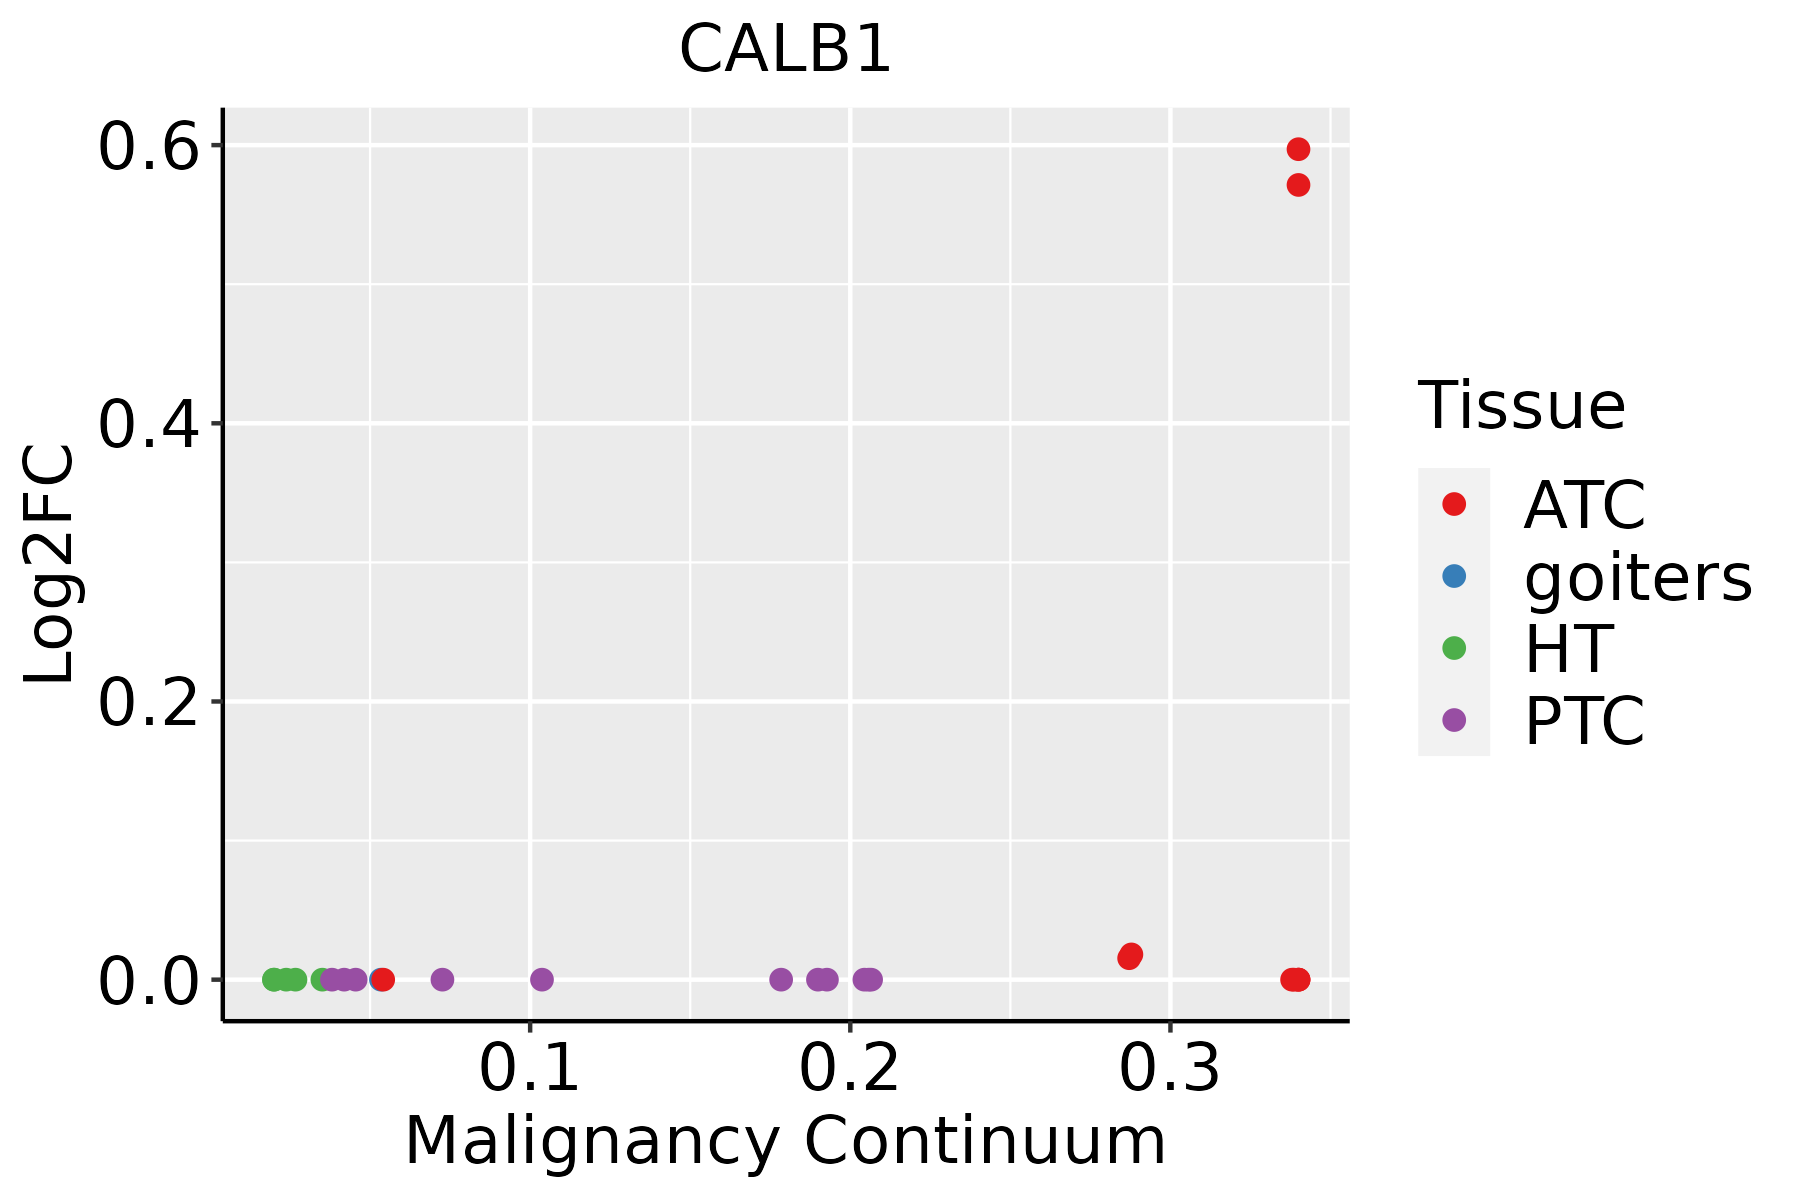 | ATC: Anaplastic thyroid cancer |
| HT: Hashimoto's thyroiditis | ||
| PTC: Papillary thyroid cancer |
| ∗log2FC in expression of this searched gene in stem-like cells from each diseased tissue sample relative to stem-like cells in normal samples in each tissue plotted against the malignancy continuum. Samples are colored based on if they are from different disease stage. |
Top |
Malignant transformation related pathway analysis |
| Find out the enriched GO biological processes and KEGG pathways involved in transition from healthy to precancer to cancer |
| Tissue | Disease Stage | Enriched GO biological Processes |
| Colorectum | AD |  |
| Colorectum | SER |  |
| Colorectum | MSS |  |
| Colorectum | MSI-H |  |
| Colorectum | FAP |  |
| ∗Top 15 enriched GO BP terms are showed in the bar plot of each disease state in each tissue. Each row represents a significant GO biological process which is colored according to the -log10(p.adjust). |
| Page: 1 2 3 4 5 6 7 8 9 |
| GO ID | Tissue | Disease Stage | Description | Gene Ratio | Bg Ratio | pvalue | p.adjust | Count |
| GO:00602498 | Cervix | CC | anatomical structure homeostasis | 63/2311 | 314/18723 | 6.03e-05 | 8.68e-04 | 63 |
| GO:00722341 | Cervix | CC | metanephric nephron tubule development | 7/2311 | 18/18723 | 3.99e-03 | 2.48e-02 | 7 |
| GO:0150063 | Cervix | CC | visual system development | 63/2311 | 375/18723 | 6.58e-03 | 3.65e-02 | 63 |
| GO:0001654 | Cervix | CC | eye development | 62/2311 | 371/18723 | 7.83e-03 | 4.13e-02 | 62 |
| GO:0048880 | Cervix | CC | sensory system development | 63/2311 | 381/18723 | 9.29e-03 | 4.66e-02 | 63 |
| GO:0072170 | Cervix | CC | metanephric tubule development | 7/2311 | 21/18723 | 1.04e-02 | 4.97e-02 | 7 |
| GO:0072243 | Cervix | CC | metanephric nephron epithelium development | 7/2311 | 21/18723 | 1.04e-02 | 4.97e-02 | 7 |
| GO:00016558 | Oral cavity | OSCC | urogenital system development | 160/7305 | 338/18723 | 1.03e-03 | 5.31e-03 | 160 |
| GO:000182222 | Thyroid | ATC | kidney development | 146/6293 | 293/18723 | 5.81e-09 | 1.28e-07 | 146 |
| GO:000165522 | Thyroid | ATC | urogenital system development | 164/6293 | 338/18723 | 7.92e-09 | 1.70e-07 | 164 |
| GO:007200122 | Thyroid | ATC | renal system development | 149/6293 | 302/18723 | 9.48e-09 | 1.99e-07 | 149 |
| GO:007207322 | Thyroid | ATC | kidney epithelium development | 68/6293 | 136/18723 | 5.50e-05 | 4.24e-04 | 68 |
| GO:007200614 | Thyroid | ATC | nephron development | 69/6293 | 142/18723 | 1.50e-04 | 1.04e-03 | 69 |
| GO:007216321 | Thyroid | ATC | mesonephric epithelium development | 48/6293 | 92/18723 | 1.81e-04 | 1.22e-03 | 48 |
| GO:007216421 | Thyroid | ATC | mesonephric tubule development | 48/6293 | 92/18723 | 1.81e-04 | 1.22e-03 | 48 |
| GO:000165721 | Thyroid | ATC | ureteric bud development | 47/6293 | 91/18723 | 2.85e-04 | 1.82e-03 | 47 |
| GO:000182321 | Thyroid | ATC | mesonephros development | 49/6293 | 96/18723 | 3.08e-04 | 1.94e-03 | 49 |
| GO:00720097 | Thyroid | ATC | nephron epithelium development | 54/6293 | 109/18723 | 4.12e-04 | 2.49e-03 | 54 |
| GO:00609933 | Thyroid | ATC | kidney morphogenesis | 47/6293 | 93/18723 | 5.40e-04 | 3.13e-03 | 47 |
| GO:00613265 | Thyroid | ATC | renal tubule development | 46/6293 | 94/18723 | 1.48e-03 | 7.52e-03 | 46 |
| Page: 1 2 |
| Pathway ID | Tissue | Disease Stage | Description | Gene Ratio | Bg Ratio | pvalue | p.adjust | qvalue | Count |
| Page: 1 |
Top |
Cell-cell communication analysis |
| Identification of potential cell-cell interactions between two cell types and their ligand-receptor pairs for different disease states |
| Ligand | Receptor | LRpair | Pathway | Tissue | Disease Stage |
| Page: 1 |
Top |
Single-cell gene regulatory network inference analysis |
| Find out the significant the regulons (TFs) and the target genes of each regulon across cell types for different disease states |
| TF | Cell Type | Tissue | Disease Stage | Target Gene | RSS | Regulon Activity |
| ∗The dot plots of a searched regulon are shown for all cell subpopulations in each disease state of each tissue based on the regulon specific score inferred using pySCENIC and by calculating the average expression. |
| Page: 1 |
Top |
Somatic mutation of malignant transformation related genes |
| Annotation of somatic variants for genes involved in malignant transformation |
| Hugo Symbol | Variant Class | Variant Classification | dbSNP RS | HGVSc | HGVSp | HGVSp Short | SWISSPROT | BIOTYPE | SIFT | PolyPhen | Tumor Sample Barcode | Tissue | Histology | Sex | Age | Stage | Therapy Types | Drugs | Outcome |
| CALB1 | SNV | Missense_Mutation | c.619N>A | p.Asp207Asn | p.D207N | P05937 | protein_coding | deleterious(0) | probably_damaging(0.993) | TCGA-BH-A0HF-01 | Breast | breast invasive carcinoma | Female | >=65 | I/II | Hormone Therapy | arimidex | SD | |
| CALB1 | SNV | Missense_Mutation | c.127C>T | p.Leu43Phe | p.L43F | P05937 | protein_coding | tolerated(0.31) | benign(0.048) | TCGA-IR-A3LB-01 | Cervix | cervical & endocervical cancer | Female | <65 | I/II | Chemotherapy | cisplatin | PD | |
| CALB1 | SNV | Missense_Mutation | c.361N>A | p.Glu121Lys | p.E121K | P05937 | protein_coding | tolerated(0.42) | benign(0.307) | TCGA-IR-A3LK-01 | Cervix | cervical & endocervical cancer | Female | >=65 | I/II | Chemotherapy | cisplatin | PD | |
| CALB1 | SNV | Missense_Mutation | novel | c.719C>A | p.Ala240Asp | p.A240D | P05937 | protein_coding | tolerated(0.45) | probably_damaging(0.997) | TCGA-A5-A0G2-01 | Endometrium | uterine corpus endometrioid carcinoma | Female | <65 | III/IV | Unknown | Unknown | SD |
| CALB1 | SNV | Missense_Mutation | c.258G>T | p.Glu86Asp | p.E86D | P05937 | protein_coding | deleterious(0) | possibly_damaging(0.762) | TCGA-A5-A2K5-01 | Endometrium | uterine corpus endometrioid carcinoma | Female | >=65 | I/II | Unknown | Unknown | SD | |
| CALB1 | SNV | Missense_Mutation | novel | c.581N>A | p.Ala194Asp | p.A194D | P05937 | protein_coding | deleterious(0.01) | possibly_damaging(0.842) | TCGA-AJ-A3EL-01 | Endometrium | uterine corpus endometrioid carcinoma | Female | <65 | I/II | Unknown | Unknown | SD |
| CALB1 | SNV | Missense_Mutation | novel | c.137N>T | p.Ala46Val | p.A46V | P05937 | protein_coding | deleterious(0.02) | possibly_damaging(0.557) | TCGA-AP-A0LM-01 | Endometrium | uterine corpus endometrioid carcinoma | Female | <65 | III/IV | Chemotherapy | cisplatin | SD |
| CALB1 | SNV | Missense_Mutation | rs374432228 | c.328N>C | p.Tyr110His | p.Y110H | P05937 | protein_coding | deleterious(0) | probably_damaging(0.999) | TCGA-AP-A1E0-01 | Endometrium | uterine corpus endometrioid carcinoma | Female | <65 | III/IV | Chemotherapy | paclitaxel | SD |
| CALB1 | SNV | Missense_Mutation | rs776145402 | c.746N>A | p.Arg249Gln | p.R249Q | P05937 | protein_coding | deleterious(0.01) | probably_damaging(0.951) | TCGA-AX-A05Z-01 | Endometrium | uterine corpus endometrioid carcinoma | Female | <65 | III/IV | Chemotherapy | adriamycin | SD |
| CALB1 | SNV | Missense_Mutation | novel | c.766C>A | p.Leu256Ile | p.L256I | P05937 | protein_coding | deleterious(0.03) | probably_damaging(0.96) | TCGA-AX-A2HD-01 | Endometrium | uterine corpus endometrioid carcinoma | Female | >=65 | III/IV | Unknown | Unknown | SD |
| Page: 1 2 3 4 |
Top |
Related drugs of malignant transformation related genes |
| Identification of chemicals and drugs interact with genes involved in malignant transfromation |
| (DGIdb 4.0) |
| Entrez ID | Symbol | Category | Interaction Types | Drug Claim Name | Drug Name | PMIDs |
| Page: 1 |

Copyright 2023-Present -The University of Texas Health Science Center at Houston |