
|
|||||
|
 | |
| |
| |
| |
| |
| |
|
Gene: CADM4 |
Gene summary for CADM4 |
| Gene information | Species | Human | Gene symbol | CADM4 | Gene ID | 199731 |
| Gene name | cell adhesion molecule 4 | |
| Gene Alias | IGSF4C | |
| Cytomap | 19q13.31 | |
| Gene Type | protein-coding | GO ID | GO:0001932 | UniProtAcc | Q8NFZ8 |
Top |
Malignant transformation analysis |
| Identification of the aberrant gene expression in precancerous and cancerous lesions by comparing the gene expression of stem-like cells in diseased tissues with normal stem cells |
| Entrez ID | Symbol | Replicates | Species | Organ | Tissue | Adj P-value | Log2FC | Malignancy |
| 199731 | CADM4 | LZE5T | Human | Esophagus | ESCC | 2.14e-02 | 2.43e-01 | 0.0514 |
| 199731 | CADM4 | LZE24T | Human | Esophagus | ESCC | 5.20e-06 | 1.75e-01 | 0.0596 |
| 199731 | CADM4 | P1T-E | Human | Esophagus | ESCC | 5.49e-06 | 3.28e-01 | 0.0875 |
| 199731 | CADM4 | P2T-E | Human | Esophagus | ESCC | 2.06e-22 | 4.51e-01 | 0.1177 |
| 199731 | CADM4 | P4T-E | Human | Esophagus | ESCC | 6.24e-16 | 4.38e-01 | 0.1323 |
| 199731 | CADM4 | P8T-E | Human | Esophagus | ESCC | 6.77e-21 | 2.97e-01 | 0.0889 |
| 199731 | CADM4 | P9T-E | Human | Esophagus | ESCC | 2.63e-02 | 9.81e-02 | 0.1131 |
| 199731 | CADM4 | P10T-E | Human | Esophagus | ESCC | 1.55e-29 | 5.71e-01 | 0.116 |
| 199731 | CADM4 | P11T-E | Human | Esophagus | ESCC | 5.97e-08 | 3.12e-01 | 0.1426 |
| 199731 | CADM4 | P12T-E | Human | Esophagus | ESCC | 6.99e-28 | 5.68e-01 | 0.1122 |
| 199731 | CADM4 | P15T-E | Human | Esophagus | ESCC | 1.09e-09 | 2.04e-01 | 0.1149 |
| 199731 | CADM4 | P16T-E | Human | Esophagus | ESCC | 3.26e-15 | 3.17e-01 | 0.1153 |
| 199731 | CADM4 | P17T-E | Human | Esophagus | ESCC | 8.19e-03 | 2.62e-01 | 0.1278 |
| 199731 | CADM4 | P21T-E | Human | Esophagus | ESCC | 1.31e-06 | 1.26e-01 | 0.1617 |
| 199731 | CADM4 | P22T-E | Human | Esophagus | ESCC | 1.44e-05 | 1.32e-01 | 0.1236 |
| 199731 | CADM4 | P23T-E | Human | Esophagus | ESCC | 1.10e-12 | 2.86e-01 | 0.108 |
| 199731 | CADM4 | P24T-E | Human | Esophagus | ESCC | 2.57e-05 | 2.02e-01 | 0.1287 |
| 199731 | CADM4 | P26T-E | Human | Esophagus | ESCC | 1.38e-15 | 3.34e-01 | 0.1276 |
| 199731 | CADM4 | P27T-E | Human | Esophagus | ESCC | 2.67e-15 | 2.93e-01 | 0.1055 |
| 199731 | CADM4 | P28T-E | Human | Esophagus | ESCC | 4.34e-13 | 1.86e-01 | 0.1149 |
| Page: 1 2 3 |
| Tissue | Expression Dynamics | Abbreviation |
| Esophagus | 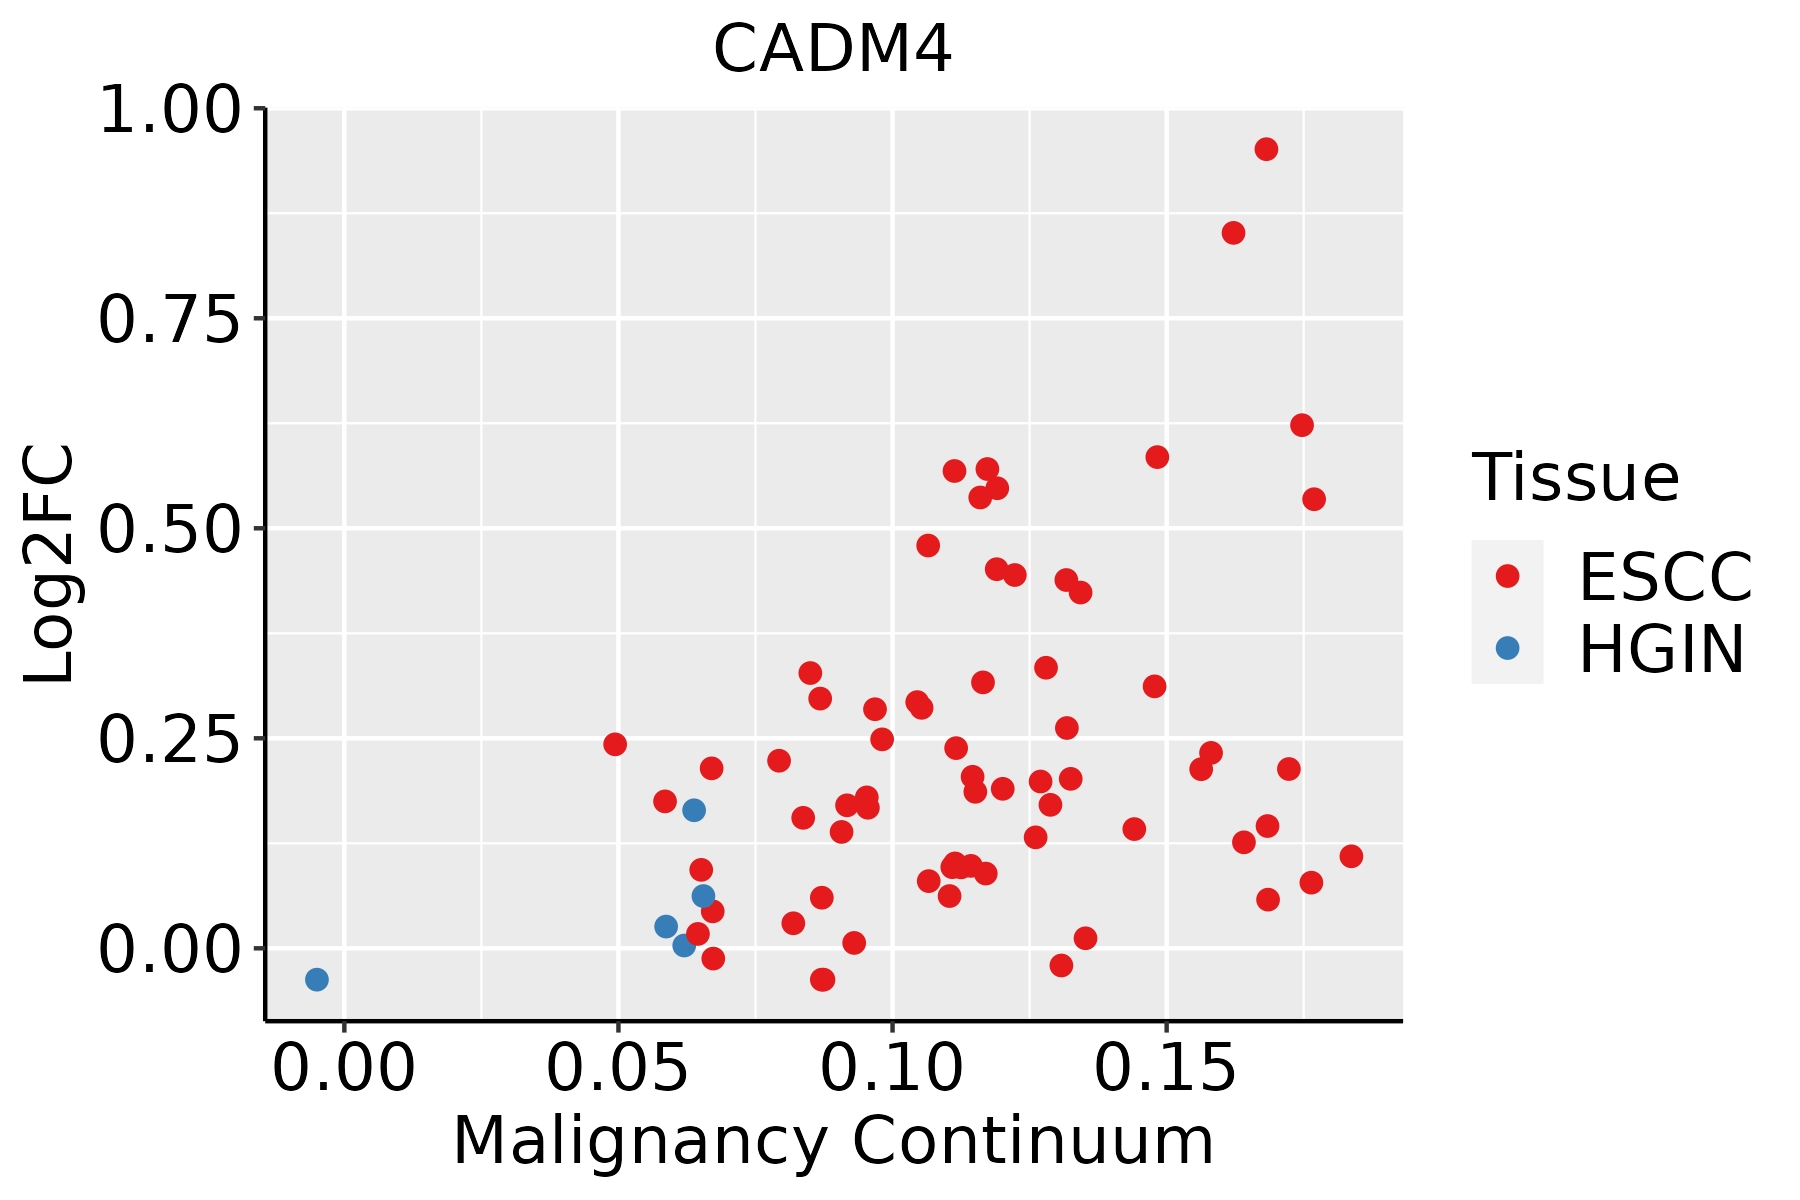 | ESCC: Esophageal squamous cell carcinoma |
| HGIN: High-grade intraepithelial neoplasias | ||
| LGIN: Low-grade intraepithelial neoplasias | ||
| Thyroid | 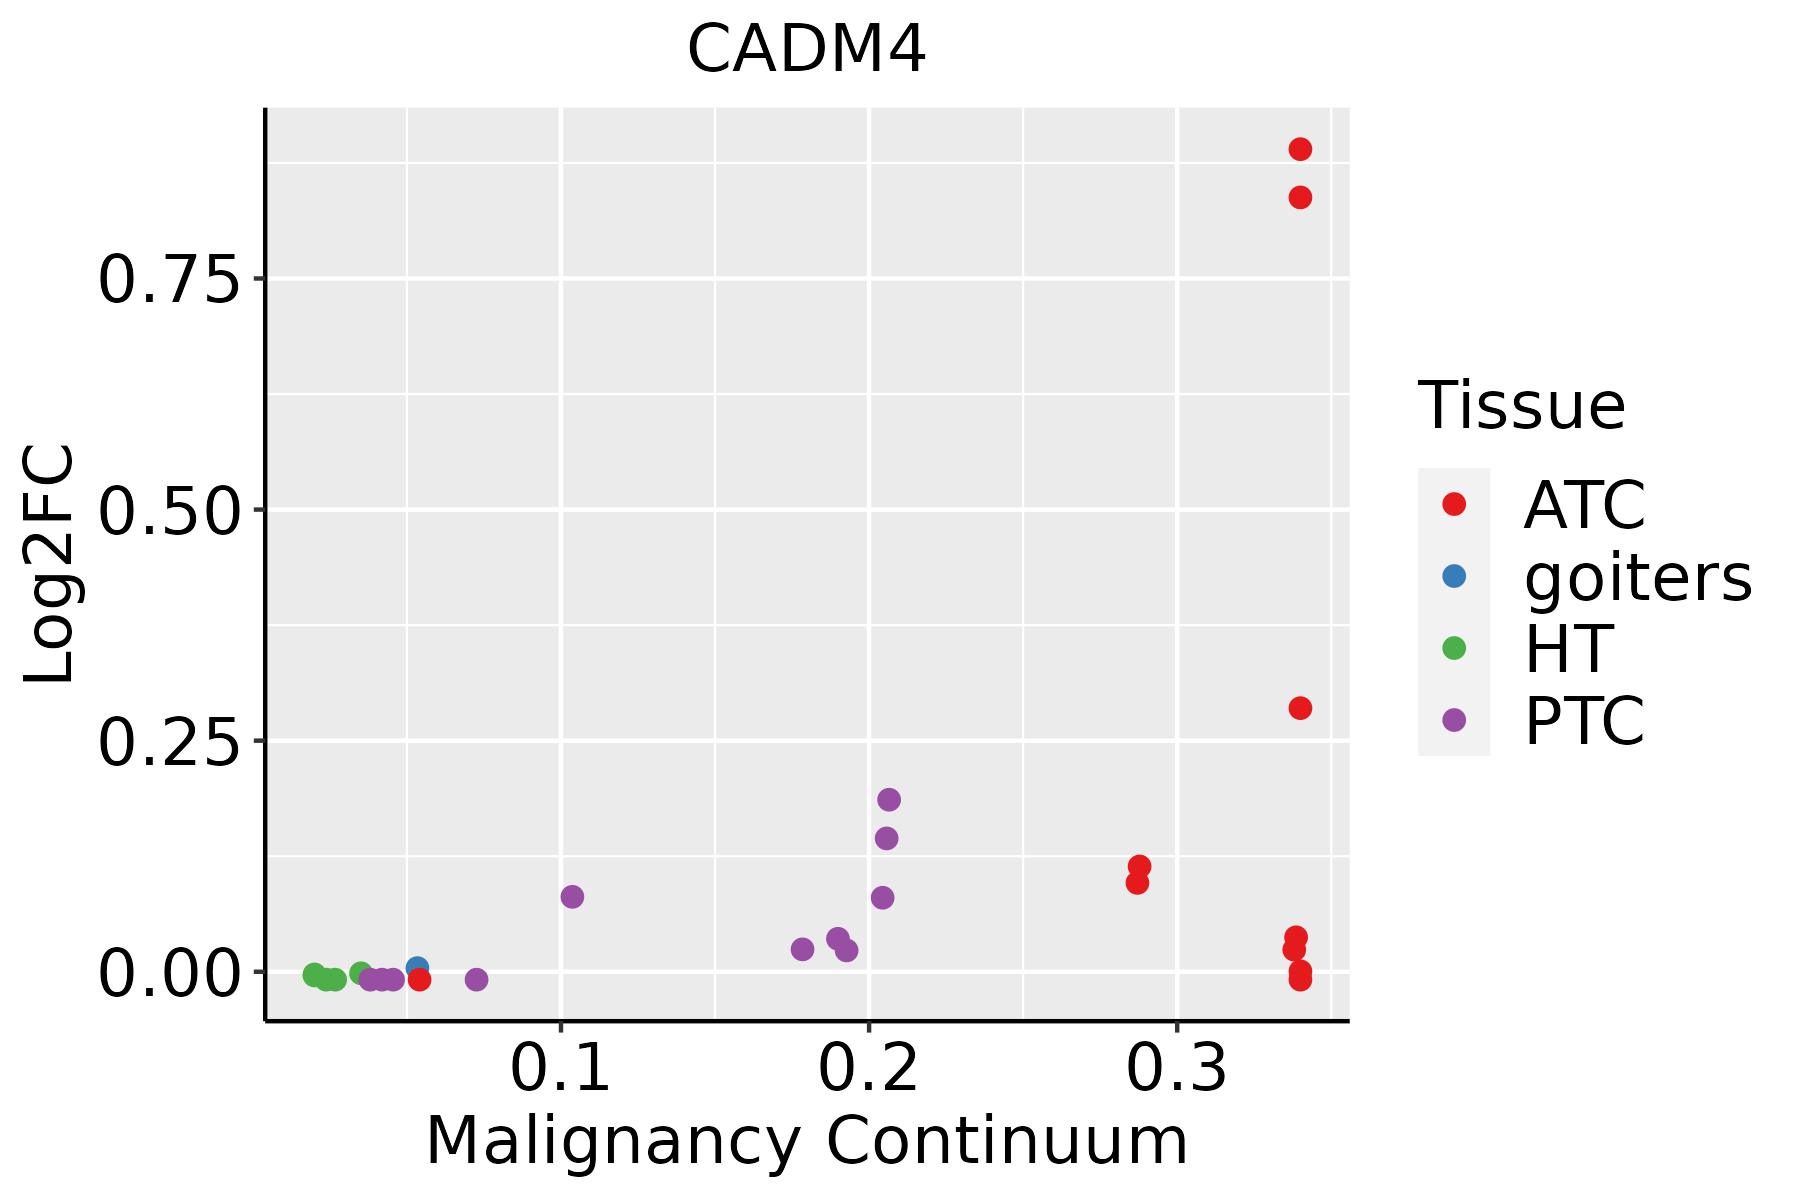 | ATC: Anaplastic thyroid cancer |
| HT: Hashimoto's thyroiditis | ||
| PTC: Papillary thyroid cancer |
| ∗log2FC in expression of this searched gene in stem-like cells from each diseased tissue sample relative to stem-like cells in normal samples in each tissue plotted against the malignancy continuum. Samples are colored based on if they are from different disease stage. |
Top |
Malignant transformation related pathway analysis |
| Find out the enriched GO biological processes and KEGG pathways involved in transition from healthy to precancer to cancer |
| Tissue | Disease Stage | Enriched GO biological Processes |
| Colorectum | AD |  |
| Colorectum | SER |  |
| Colorectum | MSS |  |
| Colorectum | MSI-H |  |
| Colorectum | FAP |  |
| ∗Top 15 enriched GO BP terms are showed in the bar plot of each disease state in each tissue. Each row represents a significant GO biological process which is colored according to the -log10(p.adjust). |
| Page: 1 2 3 4 5 6 7 8 9 |
| GO ID | Tissue | Disease Stage | Description | Gene Ratio | Bg Ratio | pvalue | p.adjust | Count |
| GO:0010563111 | Esophagus | ESCC | negative regulation of phosphorus metabolic process | 274/8552 | 442/18723 | 2.32e-12 | 9.41e-11 | 274 |
| GO:0045936111 | Esophagus | ESCC | negative regulation of phosphate metabolic process | 273/8552 | 441/18723 | 3.18e-12 | 1.25e-10 | 273 |
| GO:0042326111 | Esophagus | ESCC | negative regulation of phosphorylation | 237/8552 | 385/18723 | 1.86e-10 | 5.33e-09 | 237 |
| GO:0001933111 | Esophagus | ESCC | negative regulation of protein phosphorylation | 213/8552 | 342/18723 | 3.54e-10 | 9.76e-09 | 213 |
| GO:000726510 | Esophagus | ESCC | Ras protein signal transduction | 201/8552 | 337/18723 | 1.44e-07 | 2.30e-06 | 201 |
| GO:004206027 | Esophagus | ESCC | wound healing | 243/8552 | 422/18723 | 4.62e-07 | 6.25e-06 | 243 |
| GO:00166019 | Esophagus | ESCC | Rac protein signal transduction | 33/8552 | 42/18723 | 1.35e-05 | 1.23e-04 | 33 |
| GO:00507322 | Esophagus | ESCC | negative regulation of peptidyl-tyrosine phosphorylation | 42/8552 | 59/18723 | 6.35e-05 | 4.84e-04 | 42 |
| GO:0035020 | Esophagus | ESCC | regulation of Rac protein signal transduction | 17/8552 | 21/18723 | 1.03e-03 | 5.19e-03 | 17 |
| GO:00182124 | Esophagus | ESCC | peptidyl-tyrosine modification | 202/8552 | 378/18723 | 1.34e-03 | 6.39e-03 | 202 |
| GO:00181084 | Esophagus | ESCC | peptidyl-tyrosine phosphorylation | 200/8552 | 375/18723 | 1.60e-03 | 7.45e-03 | 200 |
| GO:00507303 | Esophagus | ESCC | regulation of peptidyl-tyrosine phosphorylation | 144/8552 | 264/18723 | 2.22e-03 | 9.78e-03 | 144 |
| GO:00465789 | Esophagus | ESCC | regulation of Ras protein signal transduction | 106/8552 | 189/18723 | 2.49e-03 | 1.08e-02 | 106 |
| GO:190303420 | Esophagus | ESCC | regulation of response to wounding | 93/8552 | 167/18723 | 5.77e-03 | 2.14e-02 | 93 |
| GO:001810710 | Esophagus | ESCC | peptidyl-threonine phosphorylation | 66/8552 | 116/18723 | 9.76e-03 | 3.37e-02 | 66 |
| GO:001821010 | Esophagus | ESCC | peptidyl-threonine modification | 70/8552 | 125/18723 | 1.29e-02 | 4.25e-02 | 70 |
| GO:005105610 | Esophagus | ESCC | regulation of small GTPase mediated signal transduction | 157/8552 | 302/18723 | 1.55e-02 | 4.98e-02 | 157 |
| GO:0010563113 | Thyroid | PTC | negative regulation of phosphorus metabolic process | 219/5968 | 442/18723 | 4.47e-15 | 3.07e-13 | 219 |
| GO:0045936113 | Thyroid | PTC | negative regulation of phosphate metabolic process | 218/5968 | 441/18723 | 7.08e-15 | 4.75e-13 | 218 |
| GO:0001933113 | Thyroid | PTC | negative regulation of protein phosphorylation | 173/5968 | 342/18723 | 3.46e-13 | 1.75e-11 | 173 |
| Page: 1 2 3 |
| Pathway ID | Tissue | Disease Stage | Description | Gene Ratio | Bg Ratio | pvalue | p.adjust | qvalue | Count |
| Page: 1 |
Top |
Cell-cell communication analysis |
| Identification of potential cell-cell interactions between two cell types and their ligand-receptor pairs for different disease states |
| Ligand | Receptor | LRpair | Pathway | Tissue | Disease Stage |
| Page: 1 |
Top |
Single-cell gene regulatory network inference analysis |
| Find out the significant the regulons (TFs) and the target genes of each regulon across cell types for different disease states |
| TF | Cell Type | Tissue | Disease Stage | Target Gene | RSS | Regulon Activity |
| ∗The dot plots of a searched regulon are shown for all cell subpopulations in each disease state of each tissue based on the regulon specific score inferred using pySCENIC and by calculating the average expression. |
| Page: 1 |
Top |
Somatic mutation of malignant transformation related genes |
| Annotation of somatic variants for genes involved in malignant transformation |
| Hugo Symbol | Variant Class | Variant Classification | dbSNP RS | HGVSc | HGVSp | HGVSp Short | SWISSPROT | BIOTYPE | SIFT | PolyPhen | Tumor Sample Barcode | Tissue | Histology | Sex | Age | Stage | Therapy Types | Drugs | Outcome |
| CADM4 | SNV | Missense_Mutation | c.928N>T | p.Asp310Tyr | p.D310Y | Q8NFZ8 | protein_coding | deleterious(0.02) | benign(0.003) | TCGA-3C-AAAU-01 | Breast | breast invasive carcinoma | Female | <65 | I/II | Chemotherapy | zoladex | SD | |
| CADM4 | SNV | Missense_Mutation | novel | c.307N>G | p.Phe103Val | p.F103V | Q8NFZ8 | protein_coding | tolerated(0.46) | benign(0.145) | TCGA-5L-AAT1-01 | Breast | breast invasive carcinoma | Female | <65 | III/IV | Hormone Therapy | letrozol | SD |
| CADM4 | insertion | In_Frame_Ins | novel | c.561_562insCCTCAGGAGGAGAAAGCT | p.Arg187_Val188insProGlnGluGluLysAla | p.R187_V188insPQEEKA | Q8NFZ8 | protein_coding | TCGA-A2-A0D1-01 | Breast | breast invasive carcinoma | Female | >=65 | I/II | Chemotherapy | taxotere | SD | ||
| CADM4 | SNV | Missense_Mutation | novel | c.790N>A | p.Ser264Thr | p.S264T | Q8NFZ8 | protein_coding | tolerated(0.21) | benign(0.007) | TCGA-C5-A8YQ-01 | Cervix | cervical & endocervical cancer | Female | >=65 | I/II | Chemotherapy | cisplatin | PD |
| CADM4 | SNV | Missense_Mutation | c.394N>T | p.Arg132Trp | p.R132W | Q8NFZ8 | protein_coding | deleterious(0) | benign(0.005) | TCGA-Q1-A6DT-01 | Cervix | cervical & endocervical cancer | Female | <65 | I/II | Unknown | Unknown | PD | |
| CADM4 | SNV | Missense_Mutation | c.394C>T | p.Arg132Trp | p.R132W | Q8NFZ8 | protein_coding | deleterious(0) | benign(0.005) | TCGA-AA-A022-01 | Colorectum | colon adenocarcinoma | Female | >=65 | I/II | Unknown | Unknown | SD | |
| CADM4 | SNV | Missense_Mutation | c.839N>A | p.Gly280Asp | p.G280D | Q8NFZ8 | protein_coding | tolerated(0.36) | benign(0.023) | TCGA-CK-4951-01 | Colorectum | colon adenocarcinoma | Female | >=65 | I/II | Unknown | Unknown | PD | |
| CADM4 | SNV | Missense_Mutation | novel | c.337N>A | p.His113Asn | p.H113N | Q8NFZ8 | protein_coding | tolerated(0.14) | possibly_damaging(0.877) | TCGA-F4-6570-01 | Colorectum | colon adenocarcinoma | Female | >=65 | I/II | Unknown | Unknown | SD |
| CADM4 | SNV | Missense_Mutation | c.295N>A | p.Glu99Lys | p.E99K | Q8NFZ8 | protein_coding | deleterious(0) | probably_damaging(0.995) | TCGA-NH-A6GC-01 | Colorectum | colon adenocarcinoma | Female | >=65 | I/II | Chemotherapy | fluorouracil | SD | |
| CADM4 | SNV | Missense_Mutation | novel | c.211N>C | p.Ala71Pro | p.A71P | Q8NFZ8 | protein_coding | tolerated(0.5) | benign(0.055) | TCGA-AG-3726-01 | Colorectum | rectum adenocarcinoma | Female | <65 | I/II | Unknown | Unknown | SD |
| Page: 1 2 3 4 5 |
Top |
Related drugs of malignant transformation related genes |
| Identification of chemicals and drugs interact with genes involved in malignant transfromation |
| (DGIdb 4.0) |
| Entrez ID | Symbol | Category | Interaction Types | Drug Claim Name | Drug Name | PMIDs |
| Page: 1 |

Copyright 2023-Present -The University of Texas Health Science Center at Houston |