
|
|||||
|
 | |
| |
| |
| |
| |
| |
|
Gene: CADM2 |
Gene summary for CADM2 |
| Gene information | Species | Human | Gene symbol | CADM2 | Gene ID | 253559 |
| Gene name | cell adhesion molecule 2 | |
| Gene Alias | IGSF4D | |
| Cytomap | 3p12.1 | |
| Gene Type | protein-coding | GO ID | GO:0007155 | UniProtAcc | Q8N3J6 |
Top |
Malignant transformation analysis |
| Identification of the aberrant gene expression in precancerous and cancerous lesions by comparing the gene expression of stem-like cells in diseased tissues with normal stem cells |
| Entrez ID | Symbol | Replicates | Species | Organ | Tissue | Adj P-value | Log2FC | Malignancy |
| 253559 | CADM2 | HTA11_1938_2000001011 | Human | Colorectum | AD | 2.68e-03 | 3.20e-01 | -0.0811 |
| 253559 | CADM2 | HTA11_78_2000001011 | Human | Colorectum | AD | 8.84e-04 | 2.50e-01 | -0.1088 |
| 253559 | CADM2 | HTA11_83_2000001011 | Human | Colorectum | SER | 8.23e-06 | 3.66e-01 | -0.1526 |
| 253559 | CADM2 | HTA11_2992_2000001011 | Human | Colorectum | SER | 3.31e-07 | 5.05e-01 | -0.1706 |
| 253559 | CADM2 | HTA11_5212_2000001011 | Human | Colorectum | AD | 1.40e-02 | 3.01e-01 | -0.2061 |
| 253559 | CADM2 | HTA11_6818_2000001011 | Human | Colorectum | AD | 1.12e-03 | 3.19e-01 | 0.0112 |
| 253559 | CADM2 | HTA11_99999970781_79442 | Human | Colorectum | MSS | 9.89e-10 | 3.49e-01 | 0.294 |
| 253559 | CADM2 | HTA11_99999965062_69753 | Human | Colorectum | MSI-H | 1.02e-02 | 4.95e-01 | 0.3487 |
| 253559 | CADM2 | HTA11_99999971662_82457 | Human | Colorectum | MSS | 3.48e-09 | 3.17e-01 | 0.3859 |
| 253559 | CADM2 | LP16 | Human | Oral cavity | LP | 4.93e-06 | 8.14e-01 | 0.1055 |
| 253559 | CADM2 | HTA12-15-2 | Human | Pancreas | PDAC | 4.06e-02 | 4.13e-01 | 0.2315 |
| 253559 | CADM2 | HTA12-23-1 | Human | Pancreas | PDAC | 2.25e-04 | 6.45e-01 | 0.3405 |
| 253559 | CADM2 | HTA12-25-1 | Human | Pancreas | PDAC | 3.52e-06 | 5.82e-01 | 0.313 |
| 253559 | CADM2 | HTA12-26-1 | Human | Pancreas | PDAC | 9.77e-13 | 7.76e-01 | 0.3728 |
| 253559 | CADM2 | HTA12-29-1 | Human | Pancreas | PDAC | 4.14e-35 | 9.82e-01 | 0.3722 |
| 253559 | CADM2 | HTA12-9-3 | Human | Pancreas | PDAC | 5.47e-06 | 7.68e-01 | 0.2045 |
| Page: 1 |
| Tissue | Expression Dynamics | Abbreviation |
| Colorectum (GSE201348) | 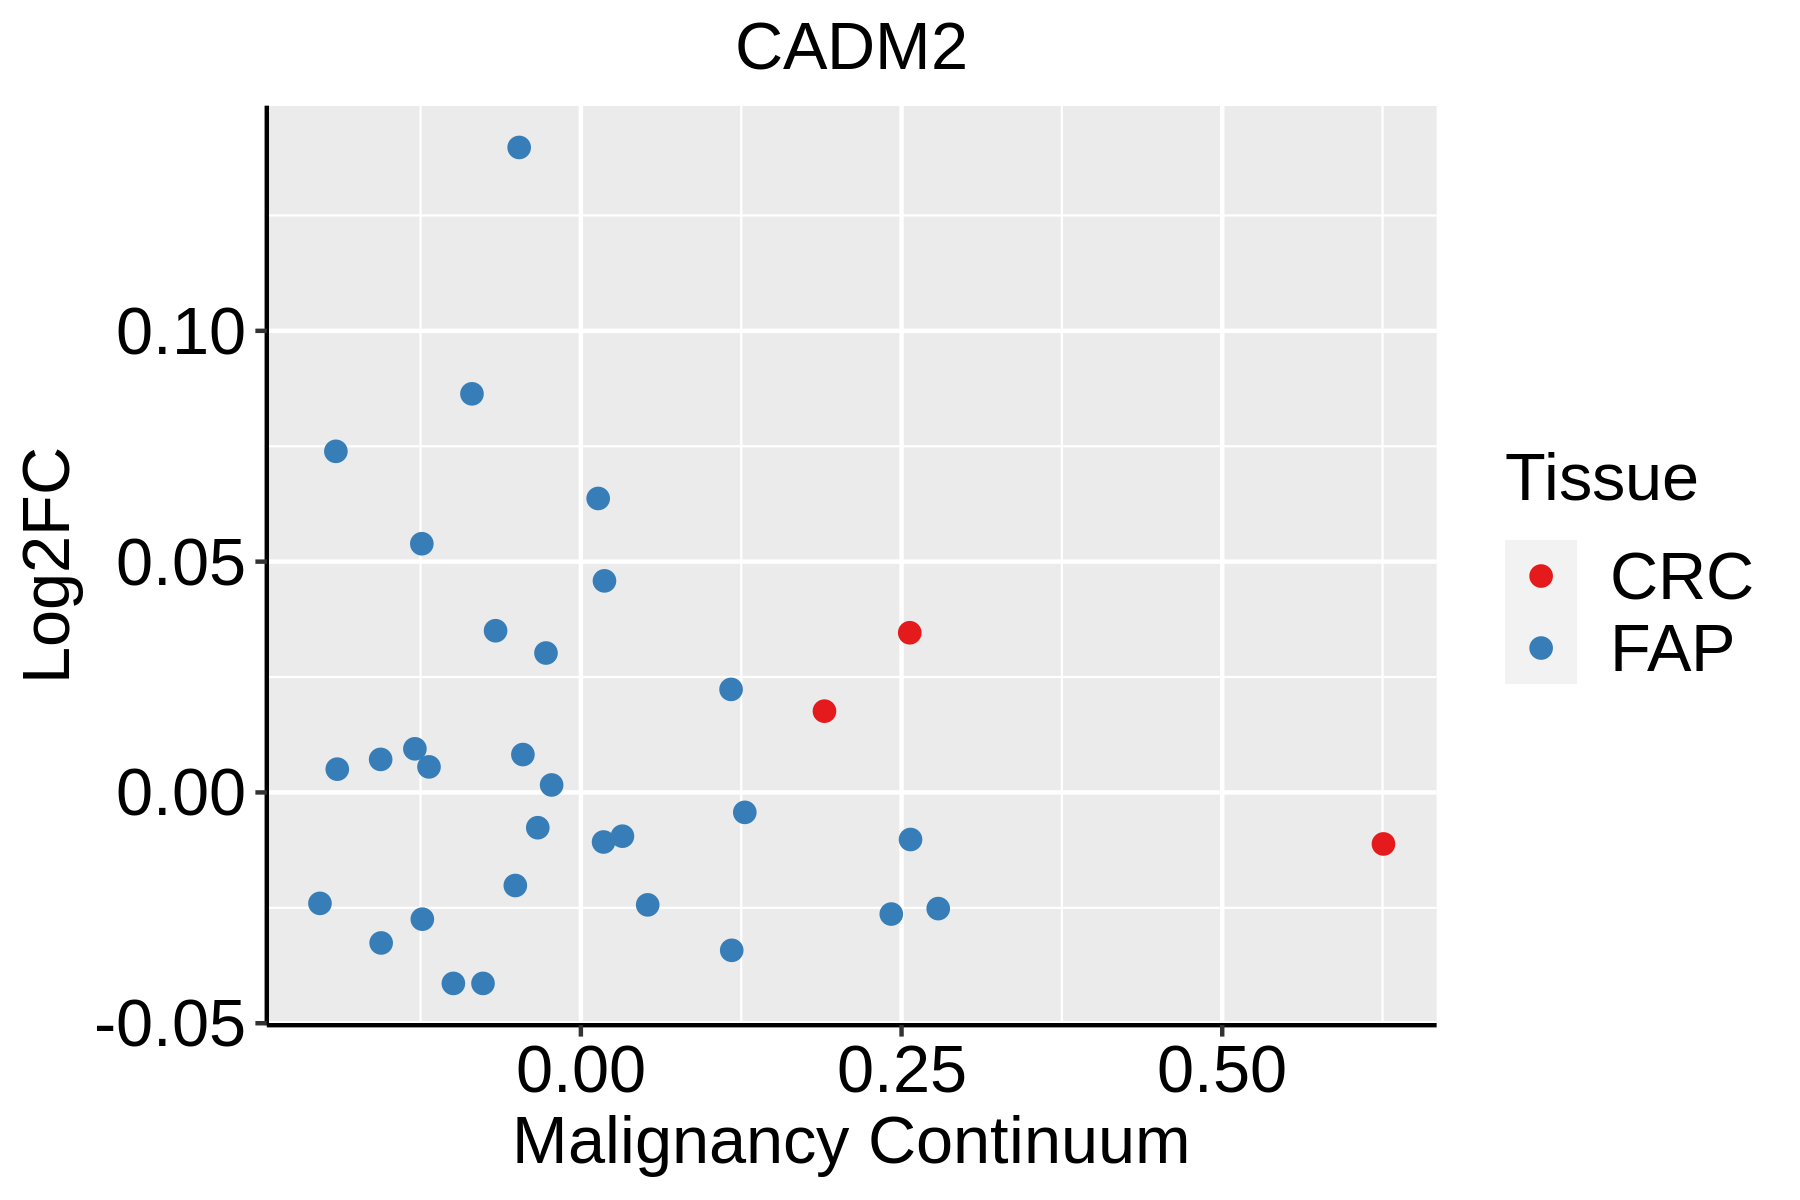 | FAP: Familial adenomatous polyposis |
| CRC: Colorectal cancer | ||
| Colorectum (HTA11) | 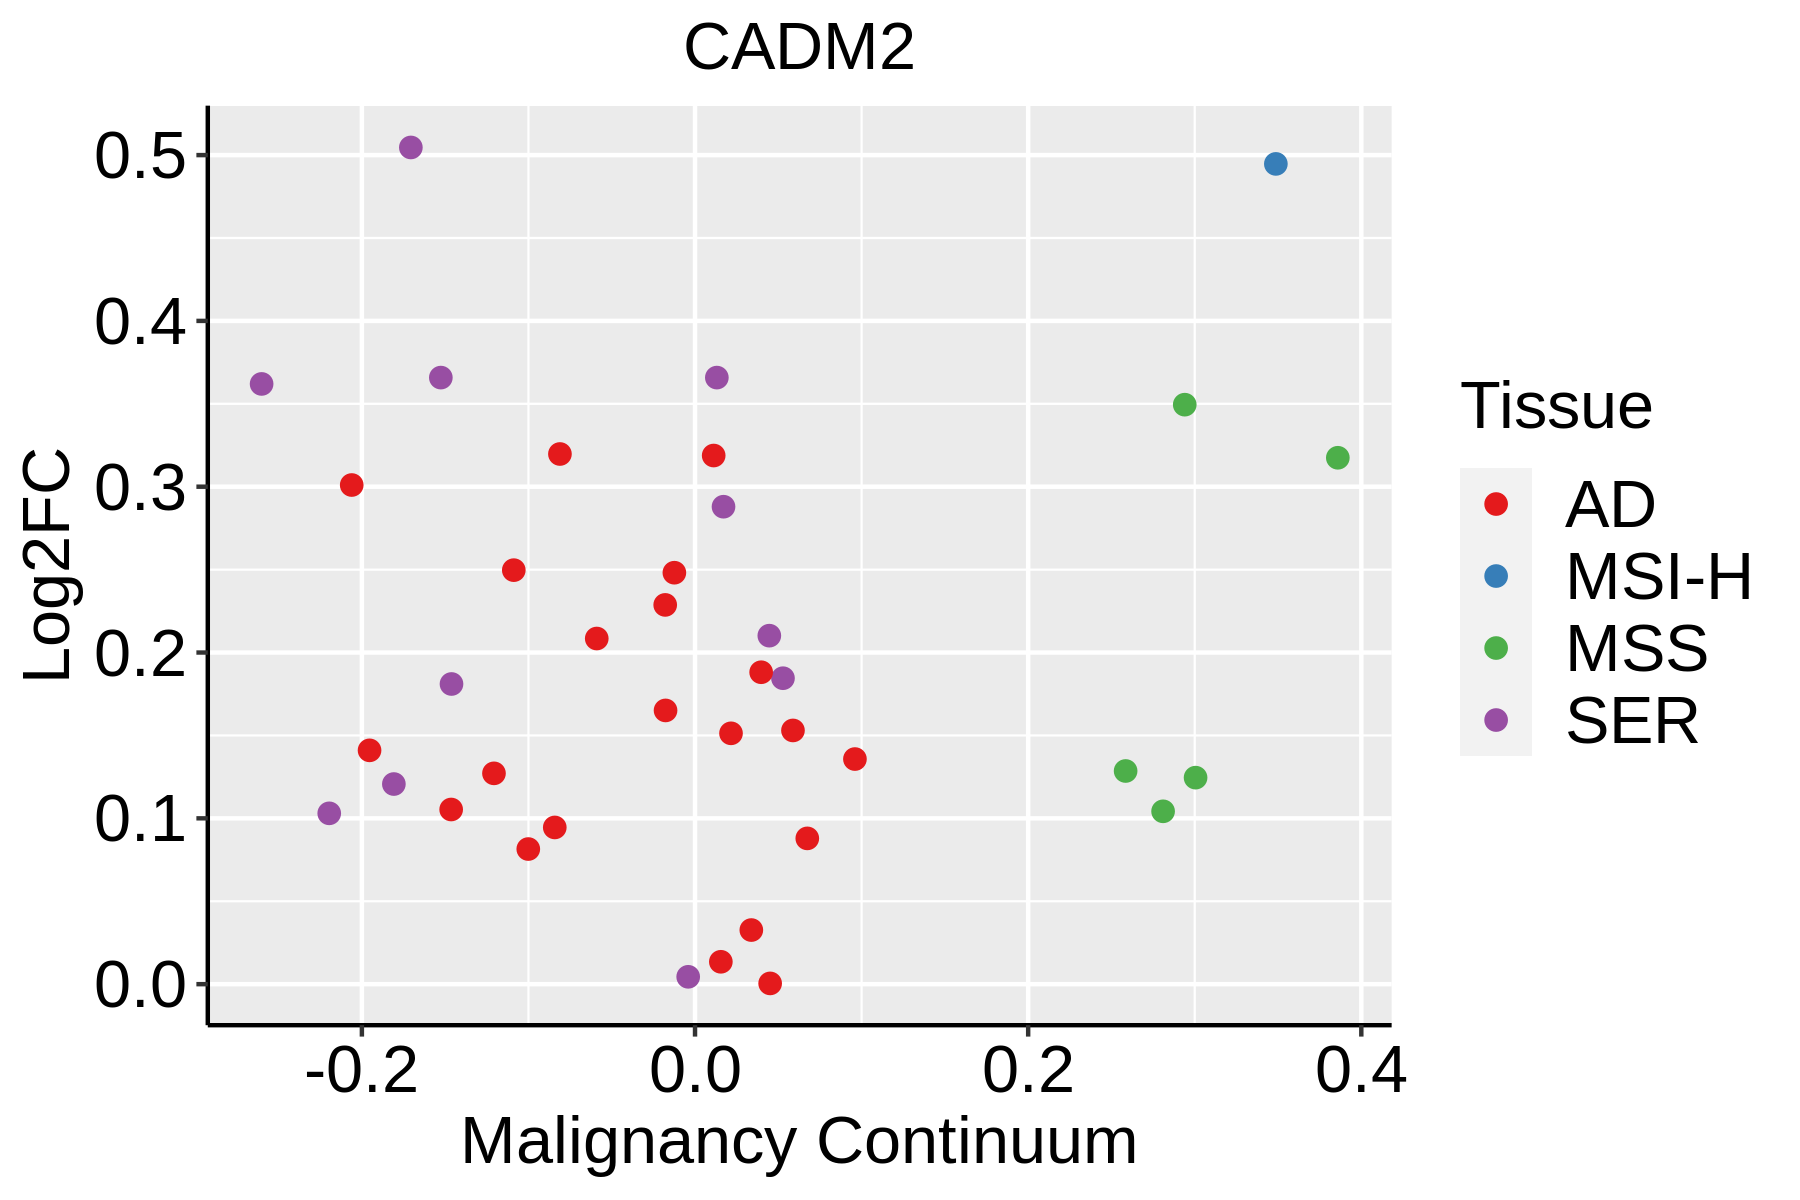 | AD: Adenomas |
| SER: Sessile serrated lesions | ||
| MSI-H: Microsatellite-high colorectal cancer | ||
| MSS: Microsatellite stable colorectal cancer | ||
| Oral Cavity | 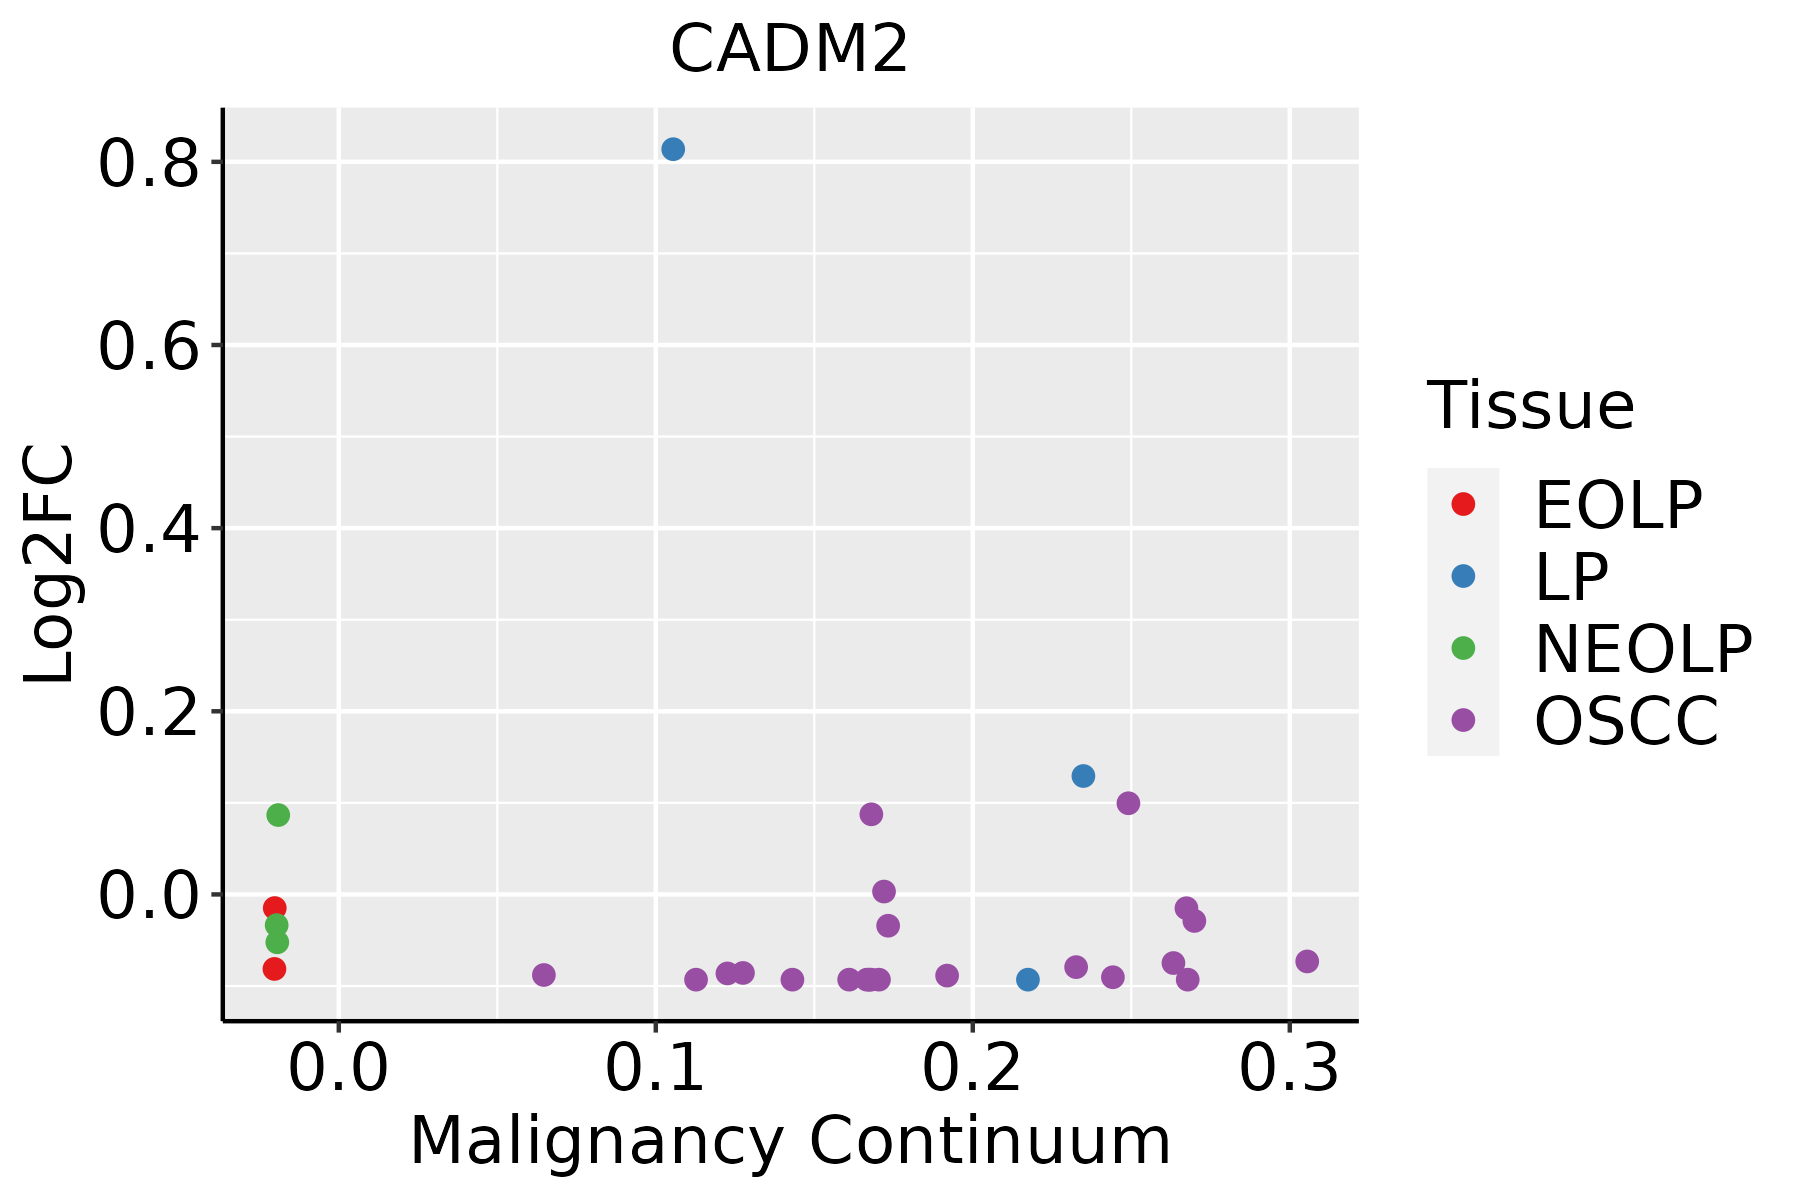 | EOLP: Erosive Oral lichen planus |
| LP: leukoplakia | ||
| NEOLP: Non-erosive oral lichen planus | ||
| OSCC: Oral squamous cell carcinoma |
| ∗log2FC in expression of this searched gene in stem-like cells from each diseased tissue sample relative to stem-like cells in normal samples in each tissue plotted against the malignancy continuum. Samples are colored based on if they are from different disease stage. |
Top |
Malignant transformation related pathway analysis |
| Find out the enriched GO biological processes and KEGG pathways involved in transition from healthy to precancer to cancer |
| Tissue | Disease Stage | Enriched GO biological Processes |
| Colorectum | AD |  |
| Colorectum | SER |  |
| Colorectum | MSS |  |
| Colorectum | MSI-H |  |
| Colorectum | FAP |  |
| ∗Top 15 enriched GO BP terms are showed in the bar plot of each disease state in each tissue. Each row represents a significant GO biological process which is colored according to the -log10(p.adjust). |
| Page: 1 2 3 4 5 6 7 8 9 |
| GO ID | Tissue | Disease Stage | Description | Gene Ratio | Bg Ratio | pvalue | p.adjust | Count |
| Page: 1 |
| Pathway ID | Tissue | Disease Stage | Description | Gene Ratio | Bg Ratio | pvalue | p.adjust | qvalue | Count |
| Page: 1 |
Top |
Cell-cell communication analysis |
| Identification of potential cell-cell interactions between two cell types and their ligand-receptor pairs for different disease states |
| Ligand | Receptor | LRpair | Pathway | Tissue | Disease Stage |
| Page: 1 |
Top |
Single-cell gene regulatory network inference analysis |
| Find out the significant the regulons (TFs) and the target genes of each regulon across cell types for different disease states |
| TF | Cell Type | Tissue | Disease Stage | Target Gene | RSS | Regulon Activity |
| ∗The dot plots of a searched regulon are shown for all cell subpopulations in each disease state of each tissue based on the regulon specific score inferred using pySCENIC and by calculating the average expression. |
| Page: 1 |
Top |
Somatic mutation of malignant transformation related genes |
| Annotation of somatic variants for genes involved in malignant transformation |
| Hugo Symbol | Variant Class | Variant Classification | dbSNP RS | HGVSc | HGVSp | HGVSp Short | SWISSPROT | BIOTYPE | SIFT | PolyPhen | Tumor Sample Barcode | Tissue | Histology | Sex | Age | Stage | Therapy Types | Drugs | Outcome |
| CADM2 | SNV | Missense_Mutation | c.452C>G | p.Ser151Cys | p.S151C | Q8N3J6 | protein_coding | deleterious(0.01) | probably_damaging(0.959) | TCGA-A7-A0CJ-01 | Breast | breast invasive carcinoma | Female | <65 | I/II | Chemotherapy | cytoxan | SD | |
| CADM2 | SNV | Missense_Mutation | c.722N>C | p.Gln241Pro | p.Q241P | Q8N3J6 | protein_coding | deleterious(0.01) | possibly_damaging(0.602) | TCGA-AC-A23C-01 | Breast | breast invasive carcinoma | Female | <65 | I/II | Chemotherapy | chemo | CR | |
| CADM2 | SNV | Missense_Mutation | c.1265N>A | p.Ala422Asp | p.A422D | Q8N3J6 | protein_coding | deleterious(0) | probably_damaging(1) | TCGA-BH-A1FJ-01 | Breast | breast invasive carcinoma | Female | >=65 | III/IV | Unknown | Unknown | SD | |
| CADM2 | SNV | Missense_Mutation | c.839N>C | p.Gly280Ala | p.G280A | Q8N3J6 | protein_coding | deleterious(0.03) | probably_damaging(0.979) | TCGA-D8-A1JA-01 | Breast | breast invasive carcinoma | Female | <65 | III/IV | Chemotherapy | adriamycin | PD | |
| CADM2 | SNV | Missense_Mutation | novel | c.845A>T | p.Glu282Val | p.E282V | Q8N3J6 | protein_coding | tolerated(0.7) | benign(0.005) | TCGA-LL-A441-01 | Breast | breast invasive carcinoma | Female | <65 | I/II | Chemotherapy | taxotere | CR |
| CADM2 | SNV | Missense_Mutation | rs138383256 | c.364N>A | p.Val122Ile | p.V122I | Q8N3J6 | protein_coding | deleterious(0) | probably_damaging(0.983) | TCGA-OL-A5RZ-01 | Breast | breast invasive carcinoma | Female | <65 | I/II | Chemotherapy | doxorubicin | CR |
| CADM2 | SNV | Missense_Mutation | rs777104225 | c.29N>A | p.Arg10His | p.R10H | Q8N3J6 | protein_coding | tolerated(0.54) | benign(0) | TCGA-JW-AAVH-01 | Cervix | cervical & endocervical cancer | Female | <65 | I/II | Unknown | Unknown | SD |
| CADM2 | SNV | Missense_Mutation | c.389N>G | p.Gln130Arg | p.Q130R | Q8N3J6 | protein_coding | tolerated(0.48) | benign(0.438) | TCGA-AA-3833-01 | Colorectum | colon adenocarcinoma | Female | <65 | I/II | Unknown | Unknown | SD | |
| CADM2 | SNV | Missense_Mutation | c.604G>A | p.Ala202Thr | p.A202T | Q8N3J6 | protein_coding | tolerated(0.63) | benign(0.038) | TCGA-AA-3966-01 | Colorectum | colon adenocarcinoma | Female | >=65 | I/II | Unknown | Unknown | SD | |
| CADM2 | SNV | Missense_Mutation | c.531N>T | p.Glu177Asp | p.E177D | Q8N3J6 | protein_coding | tolerated(0.14) | benign(0.273) | TCGA-AA-A00N-01 | Colorectum | colon adenocarcinoma | Male | >=65 | I/II | Unknown | Unknown | PD |
| Page: 1 2 3 4 5 6 7 8 9 |
Top |
Related drugs of malignant transformation related genes |
| Identification of chemicals and drugs interact with genes involved in malignant transfromation |
| (DGIdb 4.0) |
| Entrez ID | Symbol | Category | Interaction Types | Drug Claim Name | Drug Name | PMIDs |
| 253559 | CADM2 | NA | ethanol | ALCOHOL | 32451486 |
| Page: 1 |

Copyright 2023-Present -The University of Texas Health Science Center at Houston |