
|
|||||
|
 | |
| |
| |
| |
| |
| |
|
Gene: CADM1 |
Gene summary for CADM1 |
| Gene information | Species | Human | Gene symbol | CADM1 | Gene ID | 23705 |
| Gene name | cell adhesion molecule 1 | |
| Gene Alias | BL2 | |
| Cytomap | 11q23.3 | |
| Gene Type | protein-coding | GO ID | GO:0000003 | UniProtAcc | Q9BY67 |
Top |
Malignant transformation analysis |
| Identification of the aberrant gene expression in precancerous and cancerous lesions by comparing the gene expression of stem-like cells in diseased tissues with normal stem cells |
| Entrez ID | Symbol | Replicates | Species | Organ | Tissue | Adj P-value | Log2FC | Malignancy |
| 23705 | CADM1 | AEH-subject1 | Human | Endometrium | AEH | 3.02e-34 | 8.46e-01 | -0.3059 |
| 23705 | CADM1 | AEH-subject2 | Human | Endometrium | AEH | 9.35e-07 | 4.14e-01 | -0.2525 |
| 23705 | CADM1 | AEH-subject3 | Human | Endometrium | AEH | 4.98e-29 | 8.21e-01 | -0.2576 |
| 23705 | CADM1 | AEH-subject4 | Human | Endometrium | AEH | 4.34e-10 | 5.32e-01 | -0.2657 |
| 23705 | CADM1 | AEH-subject5 | Human | Endometrium | AEH | 2.14e-02 | 3.81e-01 | -0.2953 |
| 23705 | CADM1 | EEC-subject1 | Human | Endometrium | EEC | 5.12e-20 | 6.74e-01 | -0.2682 |
| 23705 | CADM1 | EEC-subject3 | Human | Endometrium | EEC | 1.29e-41 | 8.68e-01 | -0.2525 |
| 23705 | CADM1 | EEC-subject5 | Human | Endometrium | EEC | 2.05e-07 | 4.78e-01 | -0.249 |
| 23705 | CADM1 | GSM5276934 | Human | Endometrium | EEC | 2.20e-02 | 2.64e-01 | -0.0913 |
| 23705 | CADM1 | GSM6177620_NYU_UCEC1_lib1_lib1 | Human | Endometrium | EEC | 8.95e-12 | 2.98e-01 | -0.1869 |
| 23705 | CADM1 | GSM6177620_NYU_UCEC1_lib2_lib2 | Human | Endometrium | EEC | 3.71e-09 | 2.48e-01 | -0.1875 |
| 23705 | CADM1 | GSM6177620_NYU_UCEC1_lib3_lib3 | Human | Endometrium | EEC | 2.33e-12 | 2.47e-01 | -0.1883 |
| 23705 | CADM1 | GSM6177621_NYU_UCEC2_lib1_lib1 | Human | Endometrium | EEC | 4.59e-16 | 5.98e-01 | -0.1934 |
| 23705 | CADM1 | GSM6177622_NYU_UCEC3_lib1_lib1 | Human | Endometrium | EEC | 2.86e-11 | -1.02e-02 | -0.1917 |
| 23705 | CADM1 | GSM6177622_NYU_UCEC3_lib2_lib2 | Human | Endometrium | EEC | 1.03e-10 | -5.64e-02 | -0.1916 |
| 23705 | CADM1 | P1T-E | Human | Esophagus | ESCC | 9.25e-03 | 2.47e-01 | 0.0875 |
| 23705 | CADM1 | P2T-E | Human | Esophagus | ESCC | 2.65e-37 | 7.30e-01 | 0.1177 |
| 23705 | CADM1 | P4T-E | Human | Esophagus | ESCC | 2.73e-25 | 6.05e-01 | 0.1323 |
| 23705 | CADM1 | P5T-E | Human | Esophagus | ESCC | 7.91e-04 | -6.92e-03 | 0.1327 |
| 23705 | CADM1 | P10T-E | Human | Esophagus | ESCC | 4.16e-68 | 1.45e+00 | 0.116 |
| Page: 1 2 3 4 5 6 |
| Tissue | Expression Dynamics | Abbreviation |
| Endometrium | 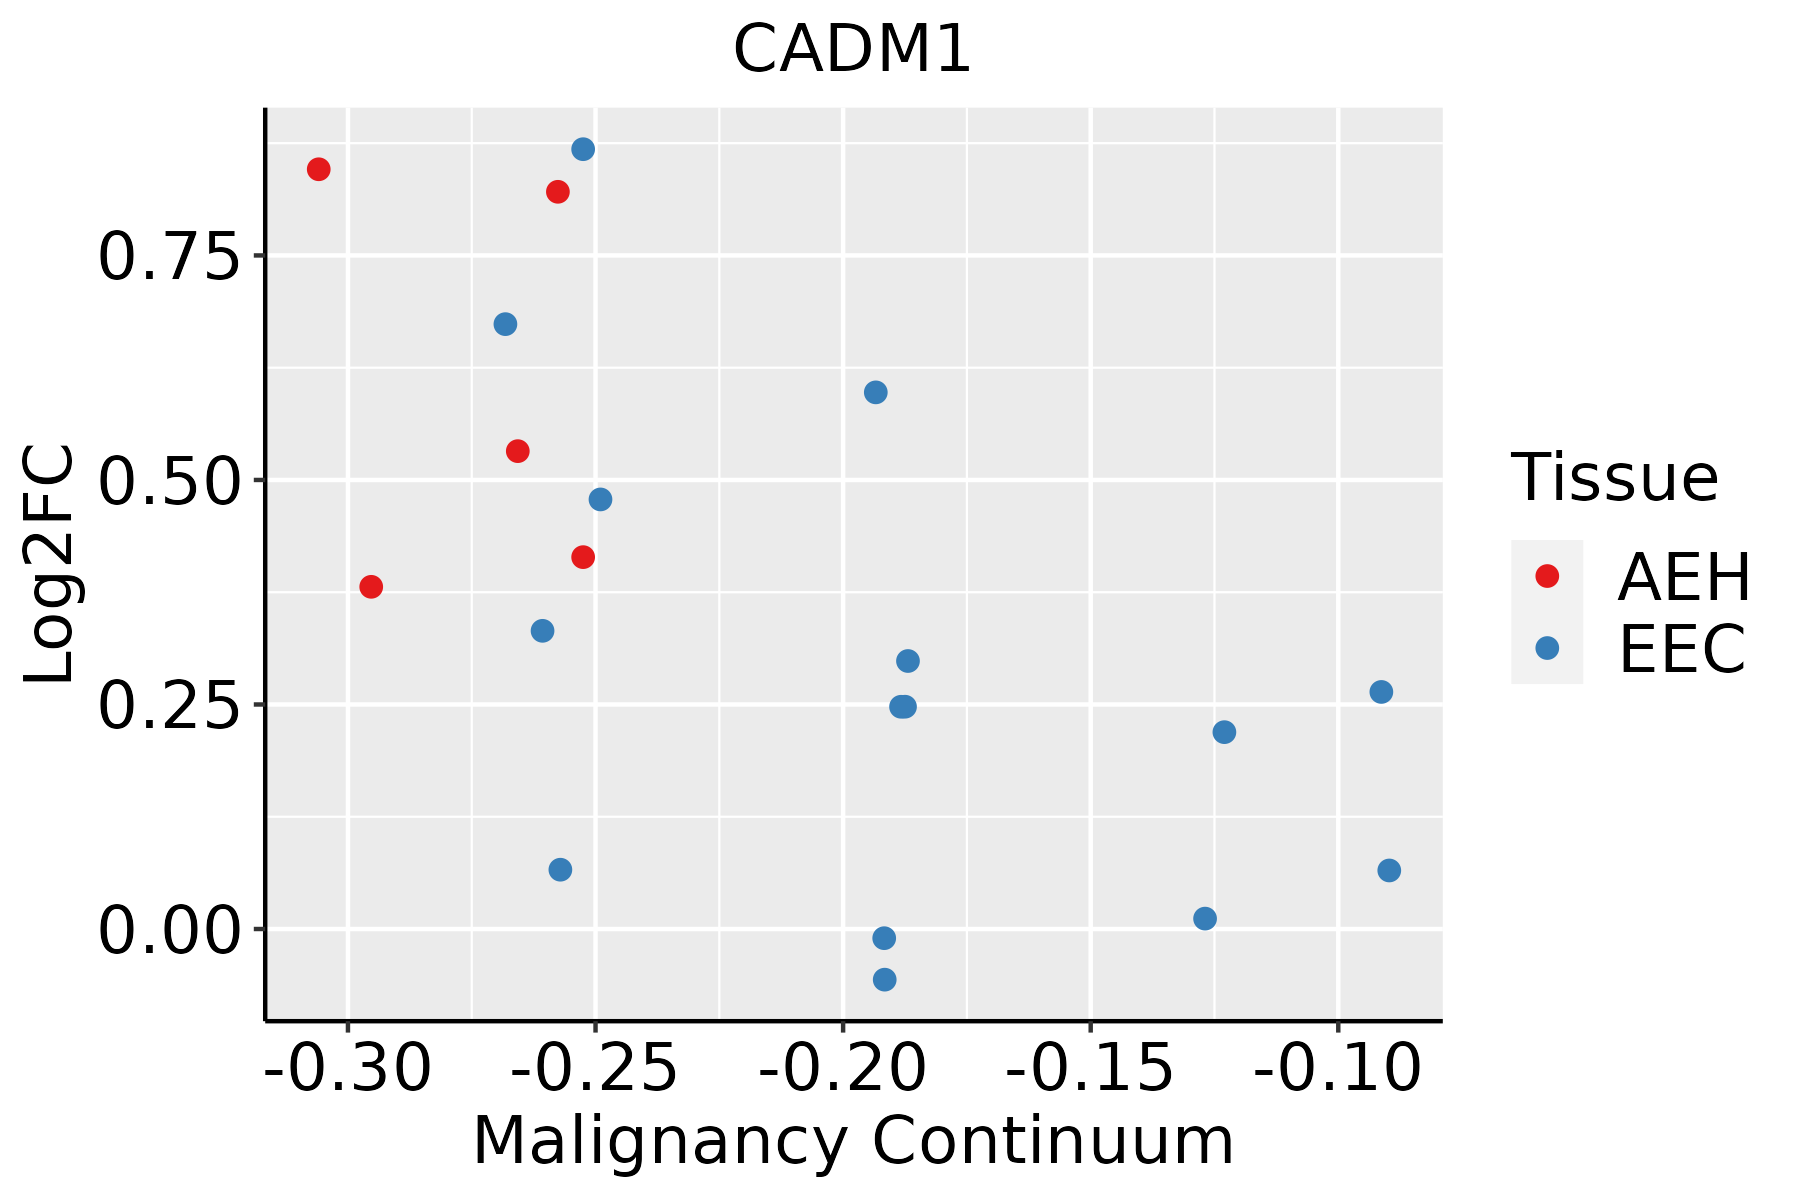 | AEH: Atypical endometrial hyperplasia |
| EEC: Endometrioid Cancer | ||
| Esophagus |  | ESCC: Esophageal squamous cell carcinoma |
| HGIN: High-grade intraepithelial neoplasias | ||
| LGIN: Low-grade intraepithelial neoplasias | ||
| Liver |  | HCC: Hepatocellular carcinoma |
| NAFLD: Non-alcoholic fatty liver disease | ||
| Lung | 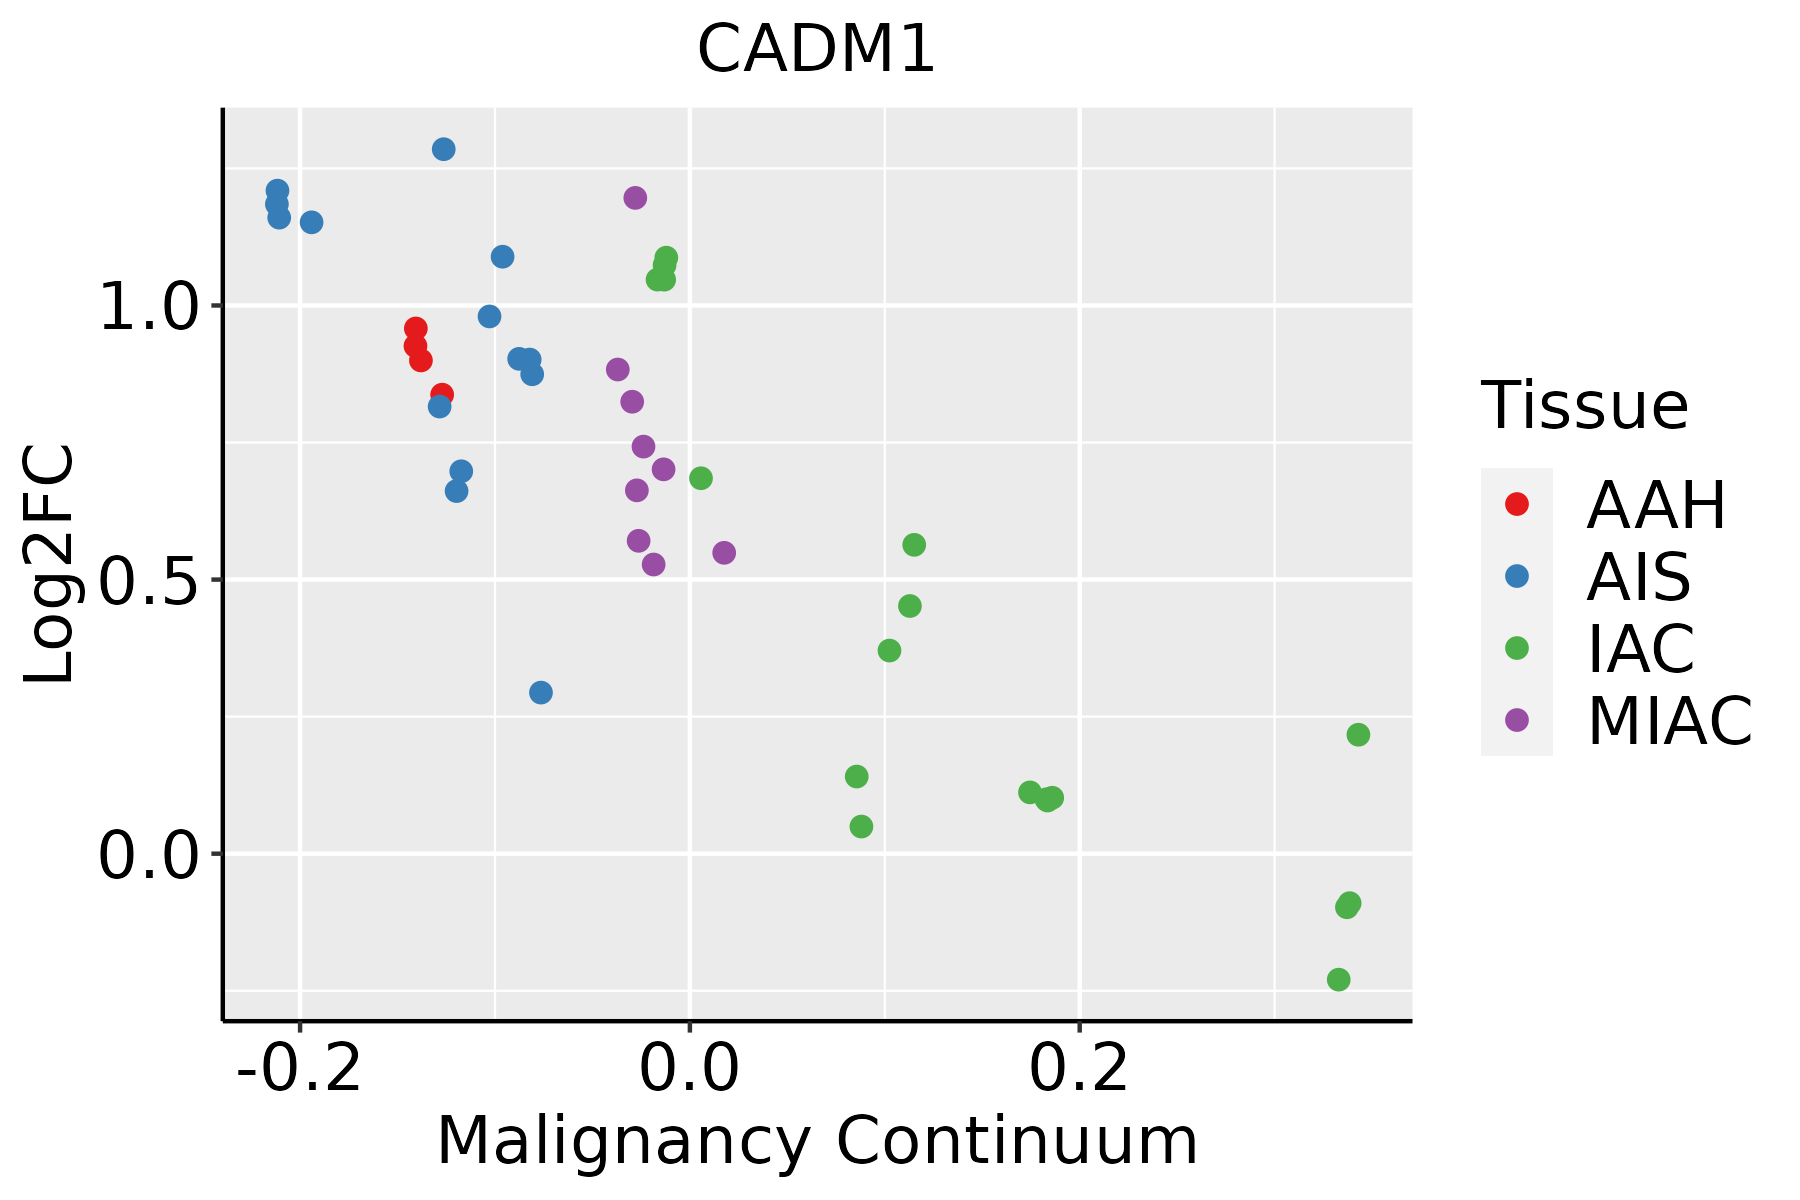 | AAH: Atypical adenomatous hyperplasia |
| AIS: Adenocarcinoma in situ | ||
| IAC: Invasive lung adenocarcinoma | ||
| MIA: Minimally invasive adenocarcinoma | ||
| Prostate | 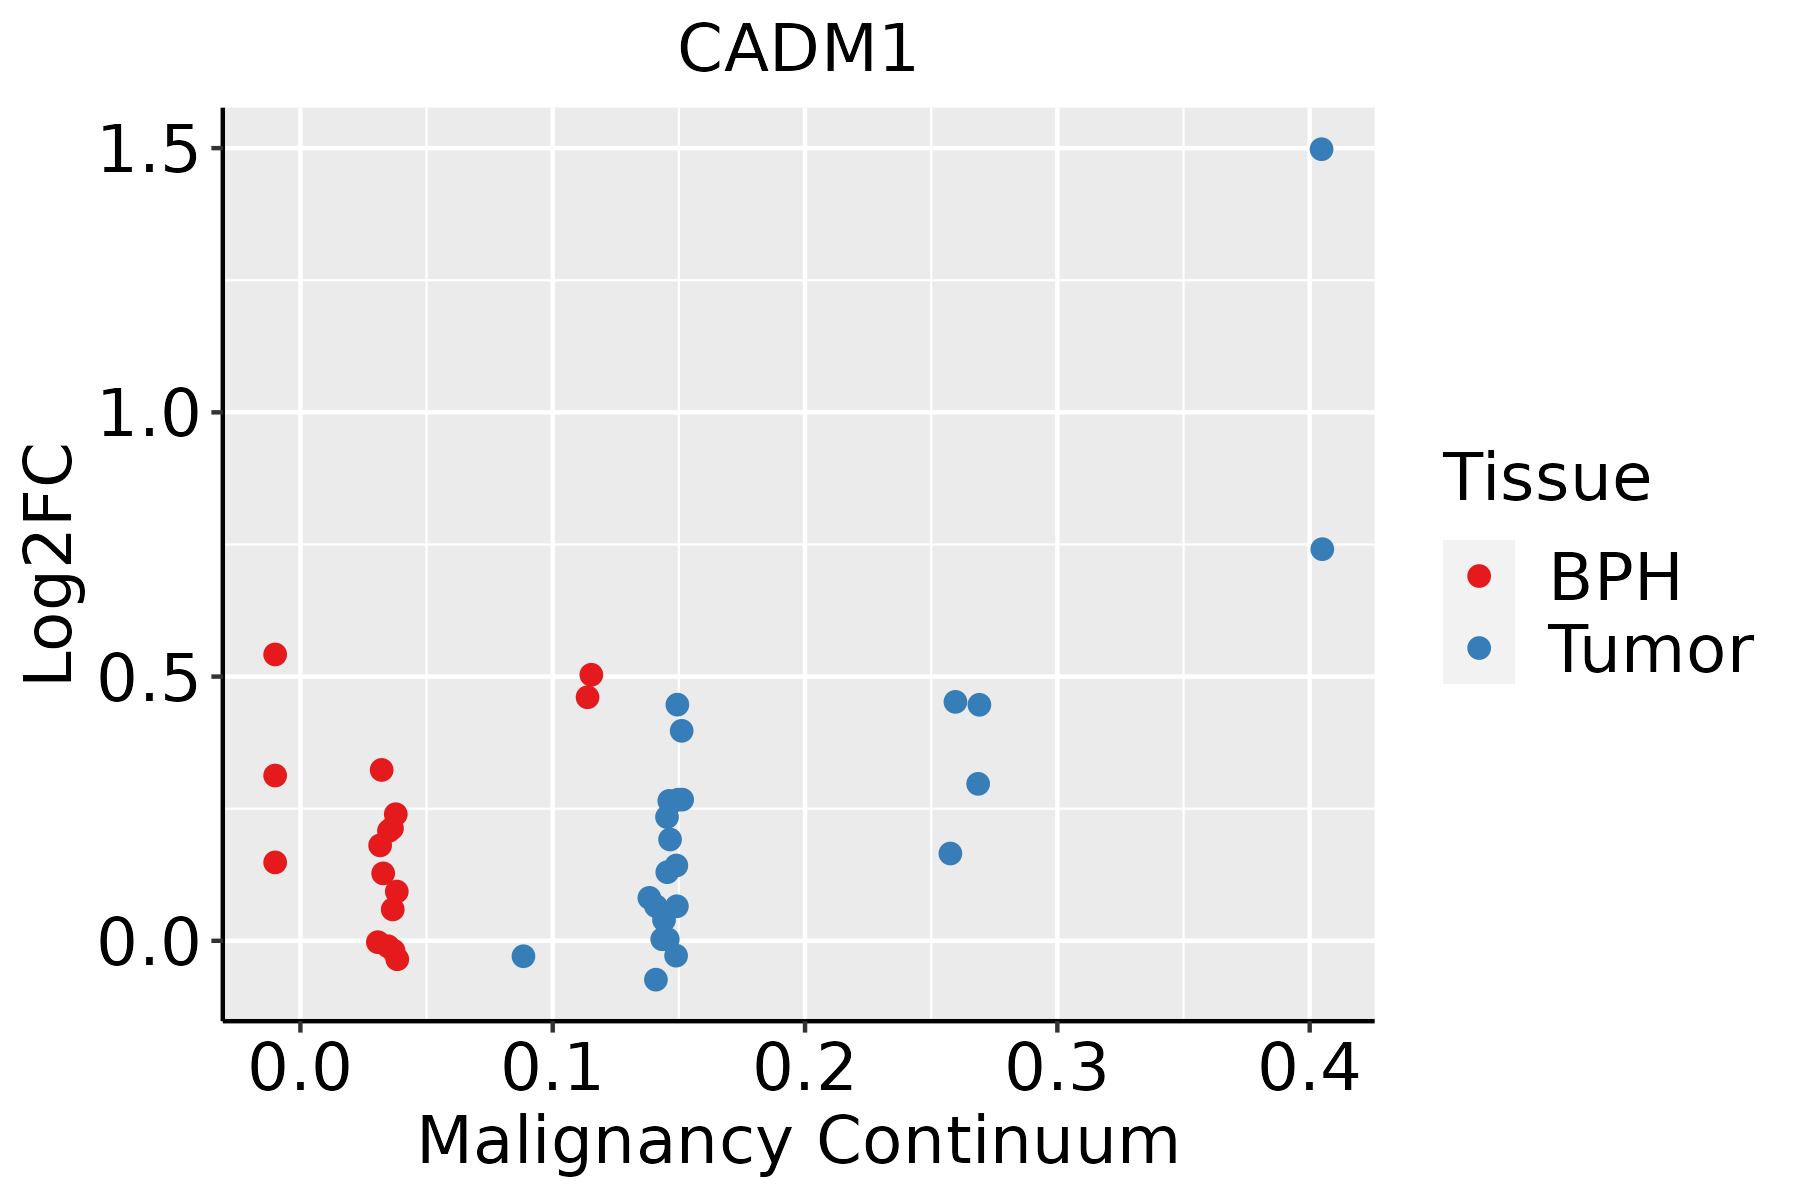 | BPH: Benign Prostatic Hyperplasia |
| Thyroid |  | ATC: Anaplastic thyroid cancer |
| HT: Hashimoto's thyroiditis | ||
| PTC: Papillary thyroid cancer |
| ∗log2FC in expression of this searched gene in stem-like cells from each diseased tissue sample relative to stem-like cells in normal samples in each tissue plotted against the malignancy continuum. Samples are colored based on if they are from different disease stage. |
Top |
Malignant transformation related pathway analysis |
| Find out the enriched GO biological processes and KEGG pathways involved in transition from healthy to precancer to cancer |
| Tissue | Disease Stage | Enriched GO biological Processes |
| Colorectum | AD |  |
| Colorectum | SER |  |
| Colorectum | MSS |  |
| Colorectum | MSI-H |  |
| Colorectum | FAP |  |
| ∗Top 15 enriched GO BP terms are showed in the bar plot of each disease state in each tissue. Each row represents a significant GO biological process which is colored according to the -log10(p.adjust). |
| Page: 1 2 3 4 5 6 7 8 9 |
| GO ID | Tissue | Disease Stage | Description | Gene Ratio | Bg Ratio | pvalue | p.adjust | Count |
| GO:00321036 | Endometrium | AEH | positive regulation of response to external stimulus | 68/2100 | 427/18723 | 1.82e-03 | 1.44e-02 | 68 |
| GO:00018198 | Endometrium | AEH | positive regulation of cytokine production | 71/2100 | 467/18723 | 4.76e-03 | 3.02e-02 | 71 |
| GO:003210313 | Endometrium | EEC | positive regulation of response to external stimulus | 71/2168 | 427/18723 | 1.06e-03 | 9.18e-03 | 71 |
| GO:000181913 | Endometrium | EEC | positive regulation of cytokine production | 73/2168 | 467/18723 | 4.64e-03 | 2.97e-02 | 73 |
| GO:00028318 | Esophagus | ESCC | regulation of response to biotic stimulus | 191/8552 | 327/18723 | 2.12e-06 | 2.45e-05 | 191 |
| GO:00450885 | Esophagus | ESCC | regulation of innate immune response | 125/8552 | 218/18723 | 3.34e-04 | 1.96e-03 | 125 |
| GO:000181916 | Esophagus | ESCC | positive regulation of cytokine production | 244/8552 | 467/18723 | 2.29e-03 | 1.01e-02 | 244 |
| GO:00028313 | Liver | NAFLD | regulation of response to biotic stimulus | 49/1882 | 327/18723 | 2.94e-03 | 2.66e-02 | 49 |
| GO:0045088 | Liver | NAFLD | regulation of innate immune response | 34/1882 | 218/18723 | 6.47e-03 | 4.69e-02 | 34 |
| GO:00321032 | Liver | Cirrhotic | positive regulation of response to external stimulus | 131/4634 | 427/18723 | 2.90e-03 | 1.66e-02 | 131 |
| GO:00028311 | Liver | Cirrhotic | regulation of response to biotic stimulus | 101/4634 | 327/18723 | 6.58e-03 | 3.25e-02 | 101 |
| GO:00028312 | Liver | HCC | regulation of response to biotic stimulus | 173/7958 | 327/18723 | 8.55e-05 | 7.48e-04 | 173 |
| GO:00450881 | Liver | HCC | regulation of innate immune response | 113/7958 | 218/18723 | 3.27e-03 | 1.50e-02 | 113 |
| GO:00321033 | Lung | IAC | positive regulation of response to external stimulus | 65/2061 | 427/18723 | 4.28e-03 | 3.41e-02 | 65 |
| GO:00018199 | Prostate | BPH | positive regulation of cytokine production | 105/3107 | 467/18723 | 5.18e-04 | 3.66e-03 | 105 |
| GO:000181914 | Prostate | Tumor | positive regulation of cytokine production | 109/3246 | 467/18723 | 4.98e-04 | 3.67e-03 | 109 |
| GO:00028316 | Prostate | Tumor | regulation of response to biotic stimulus | 74/3246 | 327/18723 | 8.03e-03 | 3.54e-02 | 74 |
| GO:000181919 | Thyroid | HT | positive regulation of cytokine production | 61/1272 | 467/18723 | 6.46e-07 | 2.68e-05 | 61 |
| GO:00321039 | Thyroid | HT | positive regulation of response to external stimulus | 55/1272 | 427/18723 | 3.50e-06 | 1.16e-04 | 55 |
| GO:00313497 | Thyroid | HT | positive regulation of defense response | 40/1272 | 278/18723 | 5.40e-06 | 1.66e-04 | 40 |
| Page: 1 2 |
| Pathway ID | Tissue | Disease Stage | Description | Gene Ratio | Bg Ratio | pvalue | p.adjust | qvalue | Count |
| Page: 1 |
Top |
Cell-cell communication analysis |
| Identification of potential cell-cell interactions between two cell types and their ligand-receptor pairs for different disease states |
| Ligand | Receptor | LRpair | Pathway | Tissue | Disease Stage |
| CADM1 | CADM1 | CADM1_CADM1 | CADM | Breast | DCIS |
| CADM1 | CADM1 | CADM1_CADM1 | CADM | Breast | IDC |
| CADM1 | CADM1 | CADM1_CADM1 | CADM | Cervix | Precancer |
| CADM1 | CADM1 | CADM1_CADM1 | CADM | CRC | ADJ |
| CADM1 | CADM1 | CADM1_CADM1 | CADM | CRC | CRC |
| CADM1 | CADM1 | CADM1_CADM1 | CADM | CRC | FAP |
| CADM1 | CADM1 | CADM1_CADM1 | CADM | Endometrium | ADJ |
| CADM1 | CADM1 | CADM1_CADM1 | CADM | Endometrium | AEH |
| CADM1 | CADM1 | CADM1_CADM1 | CADM | Endometrium | EEC |
| CADM1 | CADM1 | CADM1_CADM1 | CADM | Endometrium | Healthy |
| CADM1 | CADM1 | CADM1_CADM1 | CADM | Esophagus | ADJ |
| CADM1 | CADM1 | CADM1_CADM1 | CADM | Esophagus | ESCC |
| CADM1 | CADM1 | CADM1_CADM1 | CADM | GC | ADJ |
| CADM1 | CADM1 | CADM1_CADM1 | CADM | GC | GC |
| CADM1 | CADM1 | CADM1_CADM1 | CADM | GC | Precancer |
| CADM1 | CADM1 | CADM1_CADM1 | CADM | HNSCC | OSCC |
| CADM1 | CADM1 | CADM1_CADM1 | CADM | HNSCC | Precancer |
| CADM1 | CADM1 | CADM1_CADM1 | CADM | Liver | Healthy |
| CADM1 | CADM1 | CADM1_CADM1 | CADM | Liver | Precancer |
| CADM1 | CADM1 | CADM1_CADM1 | CADM | Lung | AAH |
| Page: 1 2 |
Top |
Single-cell gene regulatory network inference analysis |
| Find out the significant the regulons (TFs) and the target genes of each regulon across cell types for different disease states |
| TF | Cell Type | Tissue | Disease Stage | Target Gene | RSS | Regulon Activity |
| ∗The dot plots of a searched regulon are shown for all cell subpopulations in each disease state of each tissue based on the regulon specific score inferred using pySCENIC and by calculating the average expression. |
| Page: 1 |
Top |
Somatic mutation of malignant transformation related genes |
| Annotation of somatic variants for genes involved in malignant transformation |
| Hugo Symbol | Variant Class | Variant Classification | dbSNP RS | HGVSc | HGVSp | HGVSp Short | SWISSPROT | BIOTYPE | SIFT | PolyPhen | Tumor Sample Barcode | Tissue | Histology | Sex | Age | Stage | Therapy Types | Drugs | Outcome |
| CADM1 | SNV | Missense_Mutation | c.352N>C | p.Asp118His | p.D118H | Q9BY67 | protein_coding | deleterious(0) | probably_damaging(1) | TCGA-D8-A27G-01 | Breast | breast invasive carcinoma | Female | >=65 | I/II | Unknown | Unknown | SD | |
| CADM1 | SNV | Missense_Mutation | novel | c.1319N>G | p.Ala440Gly | p.A440G | Q9BY67 | protein_coding | deleterious(0) | probably_damaging(0.999) | TCGA-EW-A6SA-01 | Breast | breast invasive carcinoma | Male | <65 | I/II | Unknown | Unknown | SD |
| CADM1 | SNV | Missense_Mutation | novel | c.472N>C | p.Glu158Gln | p.E158Q | Q9BY67 | protein_coding | deleterious(0) | probably_damaging(0.986) | TCGA-GM-A3XL-01 | Breast | breast invasive carcinoma | Female | <65 | I/II | Chemotherapy | fluorouracil | CR |
| CADM1 | insertion | Frame_Shift_Ins | novel | c.1_2insGAGGGGGGAAACG | p.Met1? | p.M1? | Q9BY67 | protein_coding | TCGA-AN-A0FL-01 | Breast | breast invasive carcinoma | Female | <65 | I/II | Unknown | Unknown | SD | ||
| CADM1 | SNV | Missense_Mutation | c.744N>C | p.Gln248His | p.Q248H | Q9BY67 | protein_coding | tolerated(0.11) | possibly_damaging(0.601) | TCGA-IR-A3LH-01 | Cervix | cervical & endocervical cancer | Female | <65 | I/II | Chemotherapy | cisplatin | CR | |
| CADM1 | SNV | Missense_Mutation | rs768807528 | c.434N>A | p.Arg145His | p.R145H | Q9BY67 | protein_coding | tolerated(0.12) | benign(0.035) | TCGA-A6-5665-01 | Colorectum | colon adenocarcinoma | Female | >=65 | I/II | Unknown | Unknown | PD |
| CADM1 | SNV | Missense_Mutation | novel | c.64N>T | p.Pro22Ser | p.P22S | Q9BY67 | protein_coding | tolerated_low_confidence(0.58) | benign(0.279) | TCGA-A6-6137-01 | Colorectum | colon adenocarcinoma | Male | <65 | III/IV | Chemotherapy | fluorouracil | SD |
| CADM1 | SNV | Missense_Mutation | rs201626870 | c.467N>T | p.Ala156Val | p.A156V | Q9BY67 | protein_coding | tolerated(1) | benign(0) | TCGA-AA-3510-01 | Colorectum | colon adenocarcinoma | Male | >=65 | I/II | Unknown | Unknown | SD |
| CADM1 | SNV | Missense_Mutation | novel | c.1265N>C | p.Ile422Thr | p.I422T | Q9BY67 | protein_coding | deleterious(0) | probably_damaging(0.999) | TCGA-AA-3666-01 | Colorectum | colon adenocarcinoma | Male | >=65 | III/IV | Unknown | Unknown | PD |
| CADM1 | SNV | Missense_Mutation | c.1345N>A | p.Ala449Thr | p.A449T | Q9BY67 | protein_coding | deleterious(0) | probably_damaging(0.999) | TCGA-AA-3667-01 | Colorectum | colon adenocarcinoma | Female | <65 | I/II | Unknown | Unknown | SD |
| Page: 1 2 3 4 5 6 7 8 9 |
Top |
Related drugs of malignant transformation related genes |
| Identification of chemicals and drugs interact with genes involved in malignant transfromation |
| (DGIdb 4.0) |
| Entrez ID | Symbol | Category | Interaction Types | Drug Claim Name | Drug Name | PMIDs |
| Page: 1 |

Copyright 2023-Present -The University of Texas Health Science Center at Houston |