Schematic overview of the cellular and molecular mechanisms involved in the cancer progression, including the proposed cellular and molecular mechanisms in cancer cells trajectory. AT1: alveolar type 1 cells; AT2: alveolar type 2 cells; AAH: atypical adenomatous hyperplasia; AIS: adenocarcinoma in situ; MIA: minimally invasive adenocarcinoma; IA: invasive adenocarcinoma; EMT: epithelial-mesenchymal transition

Home

Download

Statistics

Help

Contact

Center for Computational Systems Medicine
leaf

Gene summary

leaf

Malignant transformation analysis

leaf

Malignant transformation related pathway analysis

leaf

Cell-cell communication analysis

leaf

Single-cell gene regulatory network inference analysis

leaf

Somatic mutation of malignant transformation related genes

leaf

Related drugs of malignant transformation related genes

Gene: CACUL1

Gene summary for CACUL1

check button Gene summary.

Gene informationSpeciesHuman
Gene symbol

CACUL1

Gene ID

143384

Gene nameCDK2 associated cullin domain 1
Gene AliasC10orf46
Cytomap10q26.11
Gene Typeprotein-coding
GO ID

GO:0000082

UniProtAcc

Q86Y37


Top

Malignant transformation analysis

check button Identification of the aberrant gene expression in precancerous and cancerous lesions by comparing the gene expression of stem-like cells in diseased tissues with normal stem cells
check button Malignant transformation involving gene list.
Entrez IDSymbolReplicatesSpeciesOrganTissueAdj P-valueLog2FCMalignancy
143384CACUL1LZE4THumanEsophagusESCC2.71e-123.89e-010.0811
143384CACUL1LZE7THumanEsophagusESCC1.36e-043.72e-010.0667
143384CACUL1LZE8THumanEsophagusESCC7.14e-031.27e-010.067
143384CACUL1LZE20THumanEsophagusESCC2.95e-051.63e-010.0662
143384CACUL1LZE24THumanEsophagusESCC1.90e-237.57e-010.0596
143384CACUL1LZE6THumanEsophagusESCC4.69e-021.91e-010.0845
143384CACUL1P1T-EHumanEsophagusESCC2.28e-033.76e-010.0875
143384CACUL1P2T-EHumanEsophagusESCC3.99e-488.73e-010.1177
143384CACUL1P4T-EHumanEsophagusESCC2.92e-246.58e-010.1323
143384CACUL1P5T-EHumanEsophagusESCC3.00e-266.72e-010.1327
143384CACUL1P8T-EHumanEsophagusESCC4.20e-254.87e-010.0889
143384CACUL1P9T-EHumanEsophagusESCC6.97e-072.24e-010.1131
143384CACUL1P10T-EHumanEsophagusESCC1.01e-231.02e-010.116
143384CACUL1P11T-EHumanEsophagusESCC2.64e-251.09e+000.1426
143384CACUL1P12T-EHumanEsophagusESCC3.52e-295.64e-010.1122
143384CACUL1P15T-EHumanEsophagusESCC6.28e-215.01e-010.1149
143384CACUL1P16T-EHumanEsophagusESCC7.40e-377.43e-010.1153
143384CACUL1P17T-EHumanEsophagusESCC1.21e-073.34e-010.1278
143384CACUL1P19T-EHumanEsophagusESCC4.44e-056.42e-010.1662
143384CACUL1P20T-EHumanEsophagusESCC2.73e-184.22e-010.1124
Page: 1 2 3 4 5 6 

check button Transcriptomic changes along malignancy continuum.
TissueExpression DynamicsAbbreviation
EsophagusThe image shows the transcriptomic changes along malignancy continuum.log2FC in expression of this searched gene in stem-like cells from each diseased tissue sample relative to stem-like cells in normal samples in each tissue plotted against the malignancy continuum. Samples are colored based on if they are from different disease stage.ESCC: Esophageal squamous cell carcinoma
HGIN: High-grade intraepithelial neoplasias
LGIN: Low-grade intraepithelial neoplasias
LiverThe image shows the transcriptomic changes along malignancy continuum.log2FC in expression of this searched gene in stem-like cells from each diseased tissue sample relative to stem-like cells in normal samples in each tissue plotted against the malignancy continuum. Samples are colored based on if they are from different disease stage.
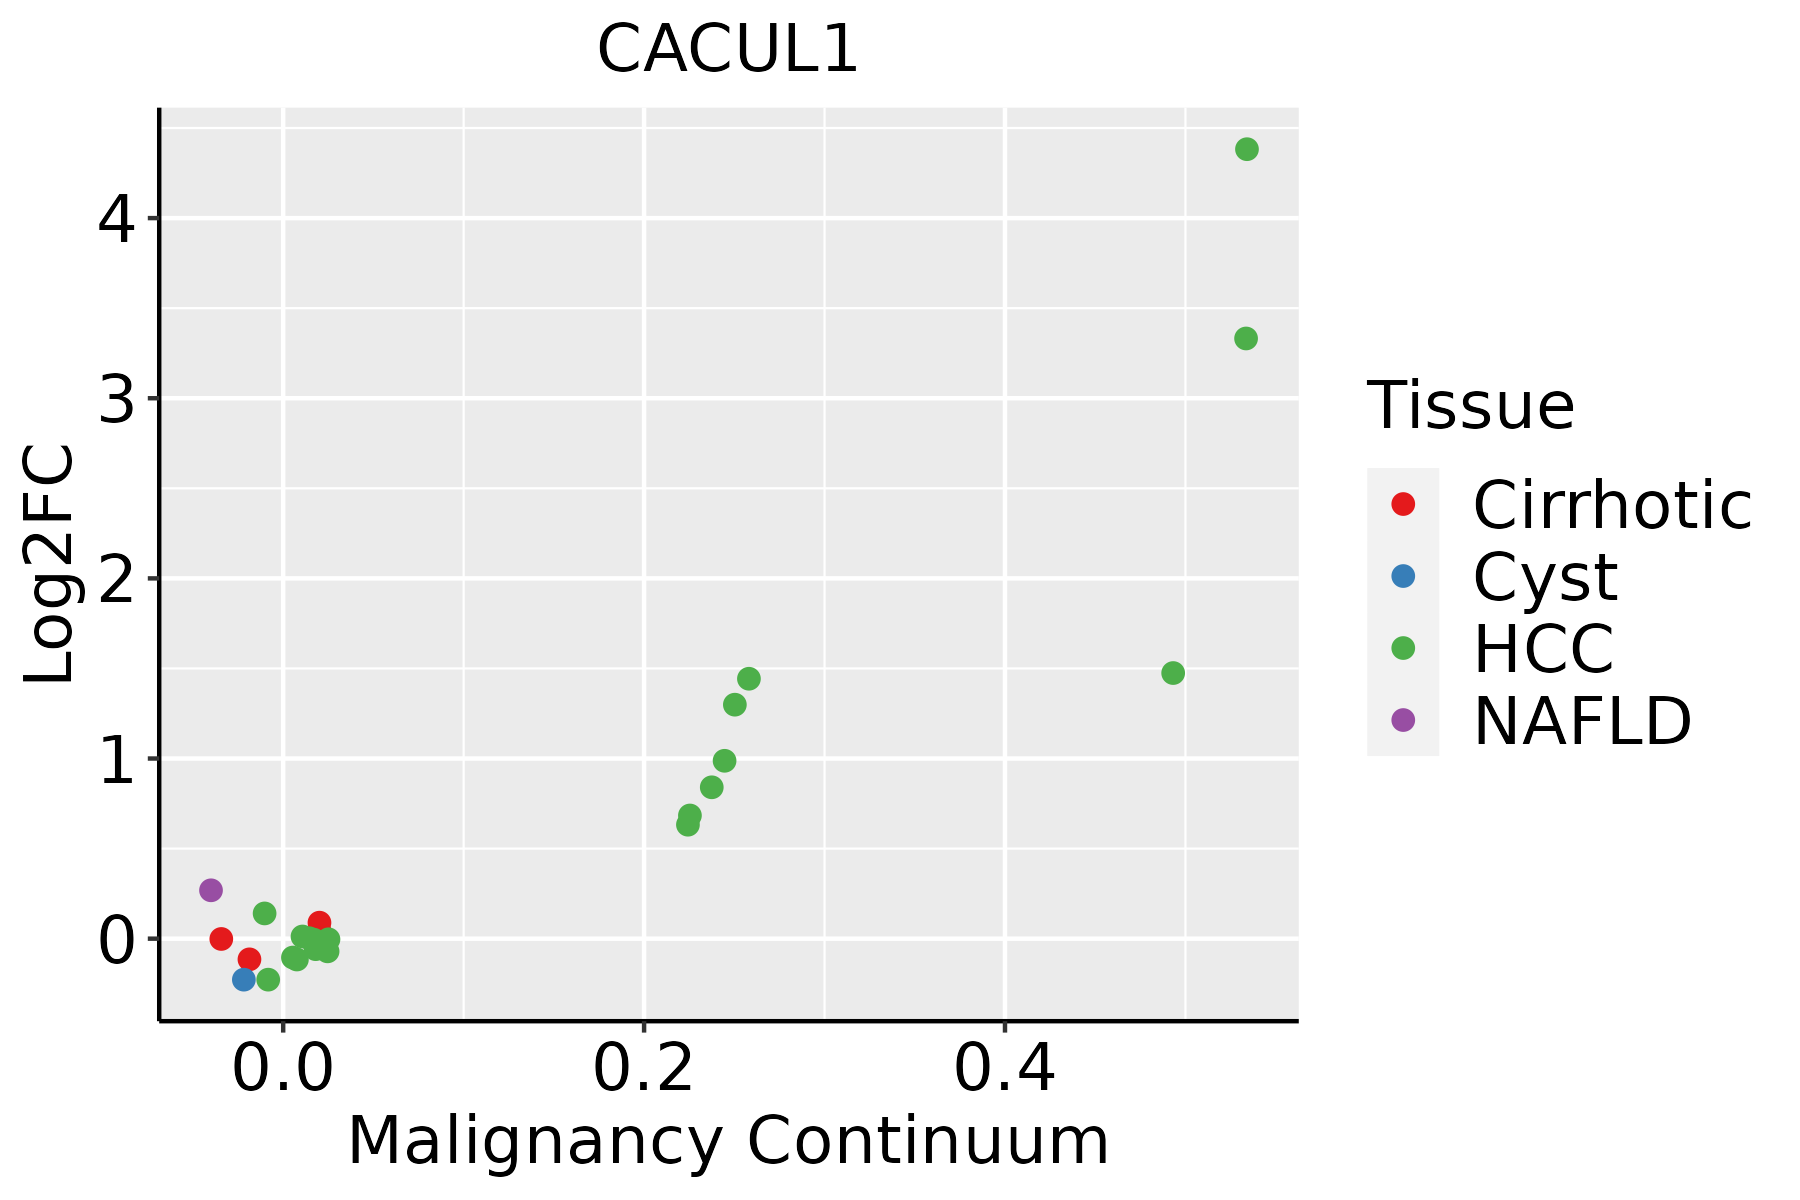
HCC: Hepatocellular carcinoma
NAFLD: Non-alcoholic fatty liver disease
Oral CavityThe image shows the transcriptomic changes along malignancy continuum.log2FC in expression of this searched gene in stem-like cells from each diseased tissue sample relative to stem-like cells in normal samples in each tissue plotted against the malignancy continuum. Samples are colored based on if they are from different disease stage.
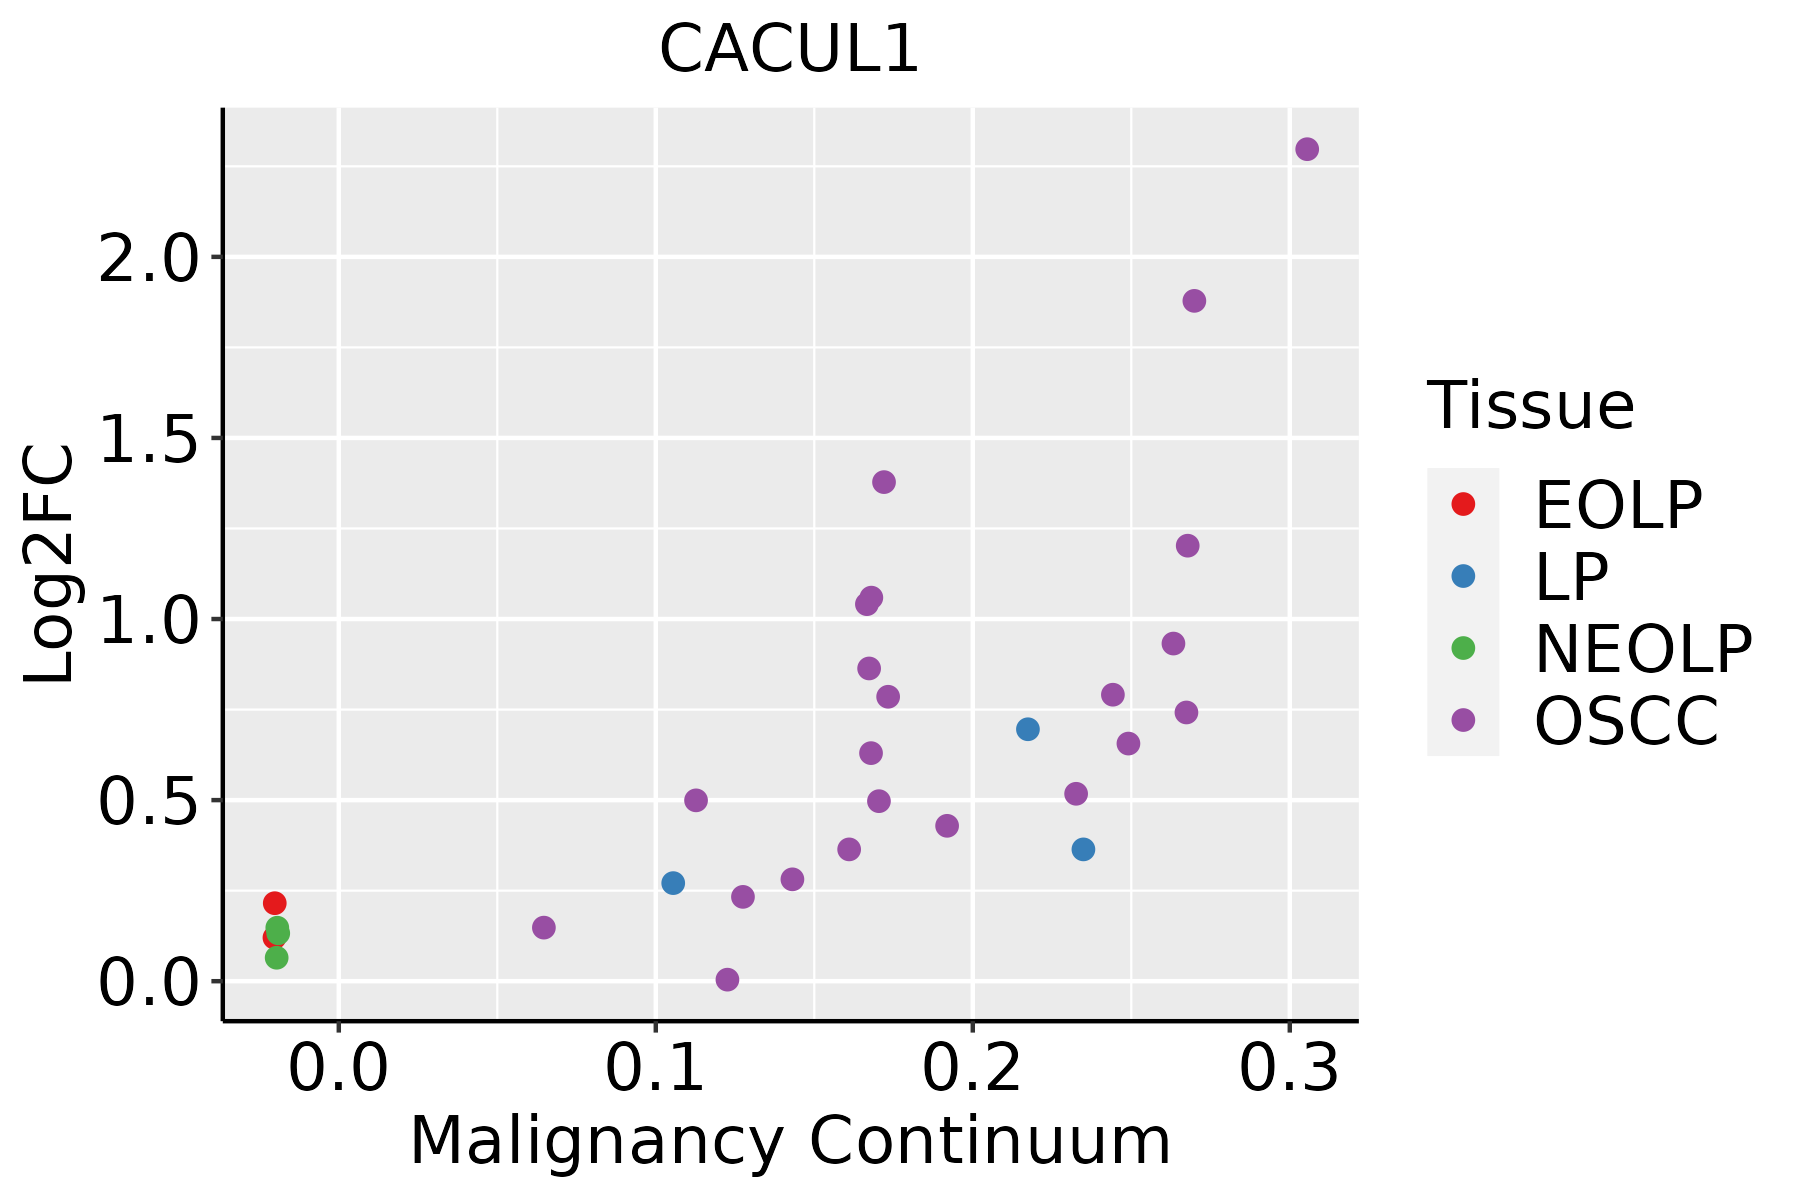
EOLP: Erosive Oral lichen planus
LP: leukoplakia
NEOLP: Non-erosive oral lichen planus
OSCC: Oral squamous cell carcinoma
ProstateThe image shows the transcriptomic changes along malignancy continuum.log2FC in expression of this searched gene in stem-like cells from each diseased tissue sample relative to stem-like cells in normal samples in each tissue plotted against the malignancy continuum. Samples are colored based on if they are from different disease stage.BPH: Benign Prostatic Hyperplasia
SkinThe image shows the transcriptomic changes along malignancy continuum.log2FC in expression of this searched gene in stem-like cells from each diseased tissue sample relative to stem-like cells in normal samples in each tissue plotted against the malignancy continuum. Samples are colored based on if they are from different disease stage.
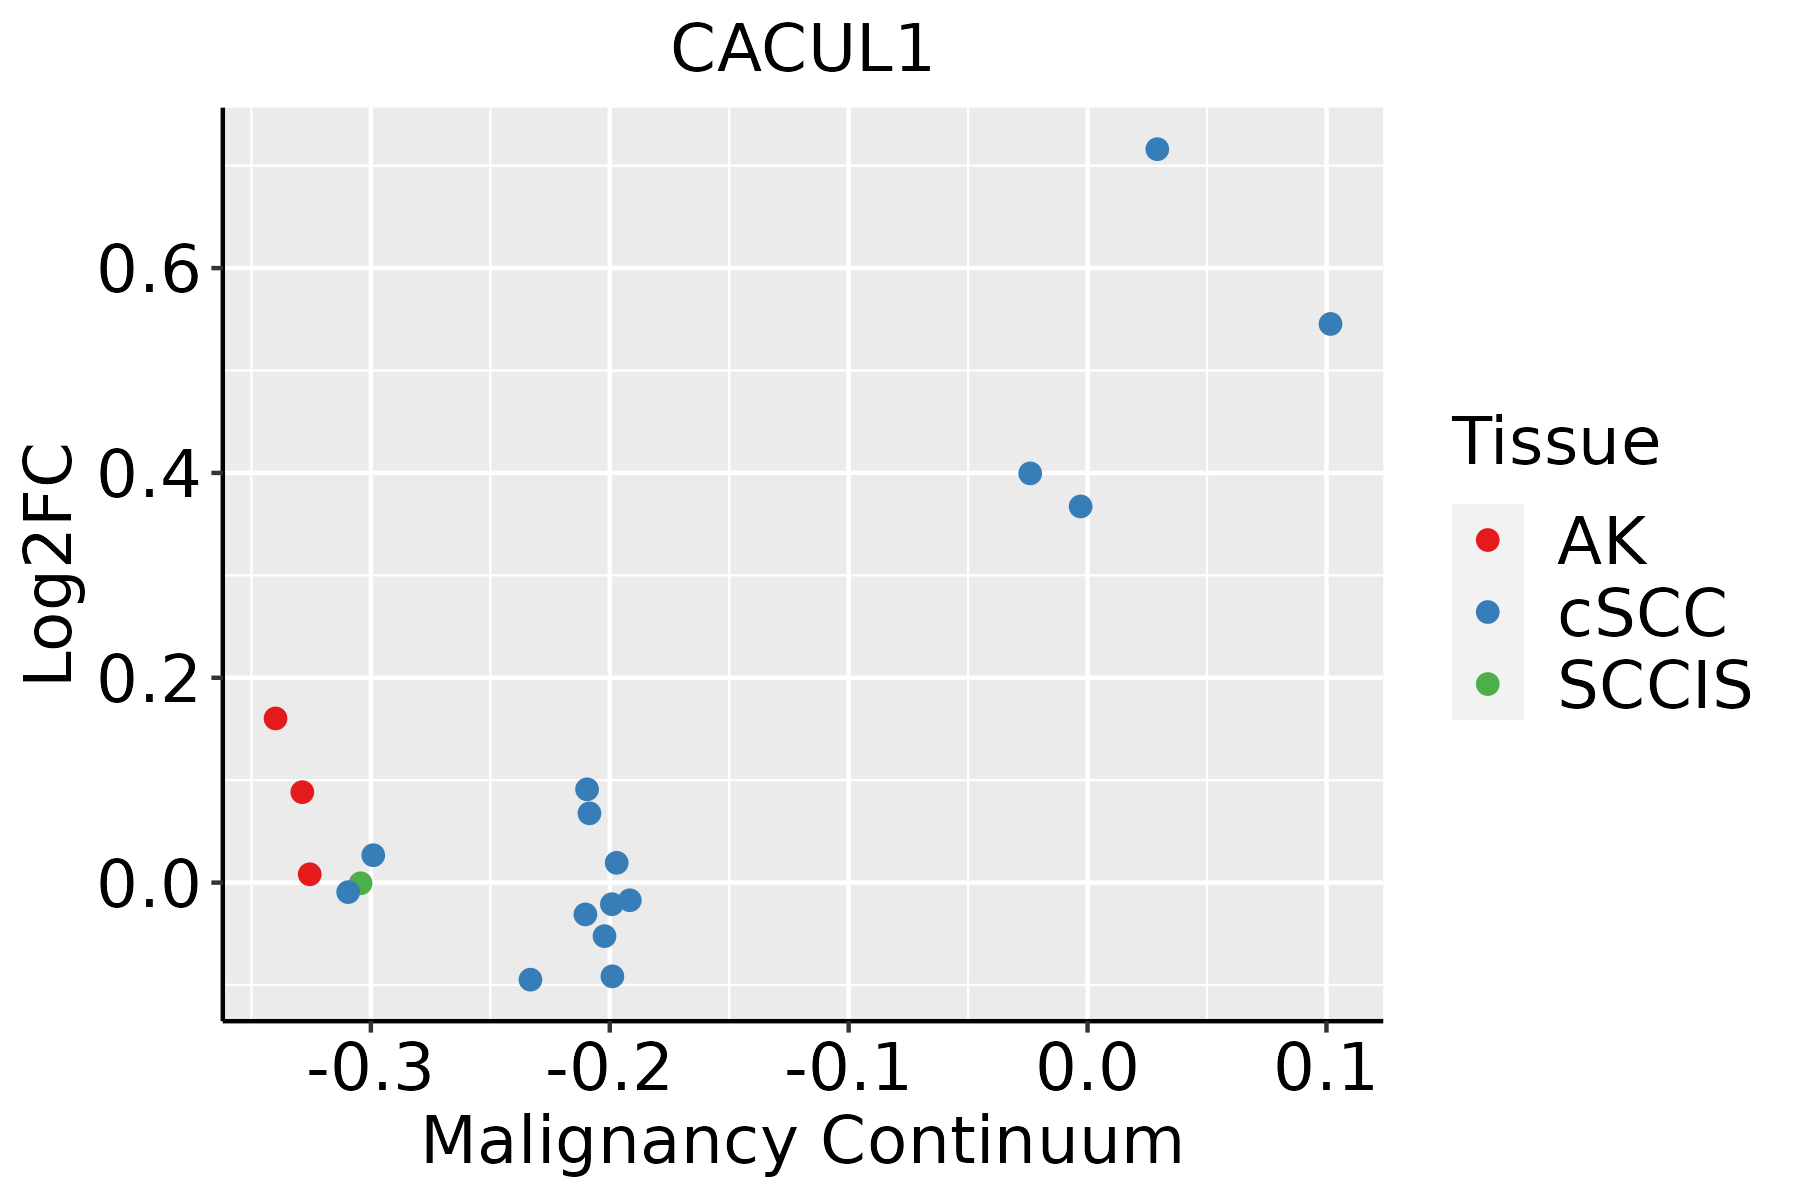
AK: Actinic keratosis
cSCC: Cutaneous squamous cell carcinoma
SCCIS:squamous cell carcinoma in situ
ThyroidThe image shows the transcriptomic changes along malignancy continuum.log2FC in expression of this searched gene in stem-like cells from each diseased tissue sample relative to stem-like cells in normal samples in each tissue plotted against the malignancy continuum. Samples are colored based on if they are from different disease stage.
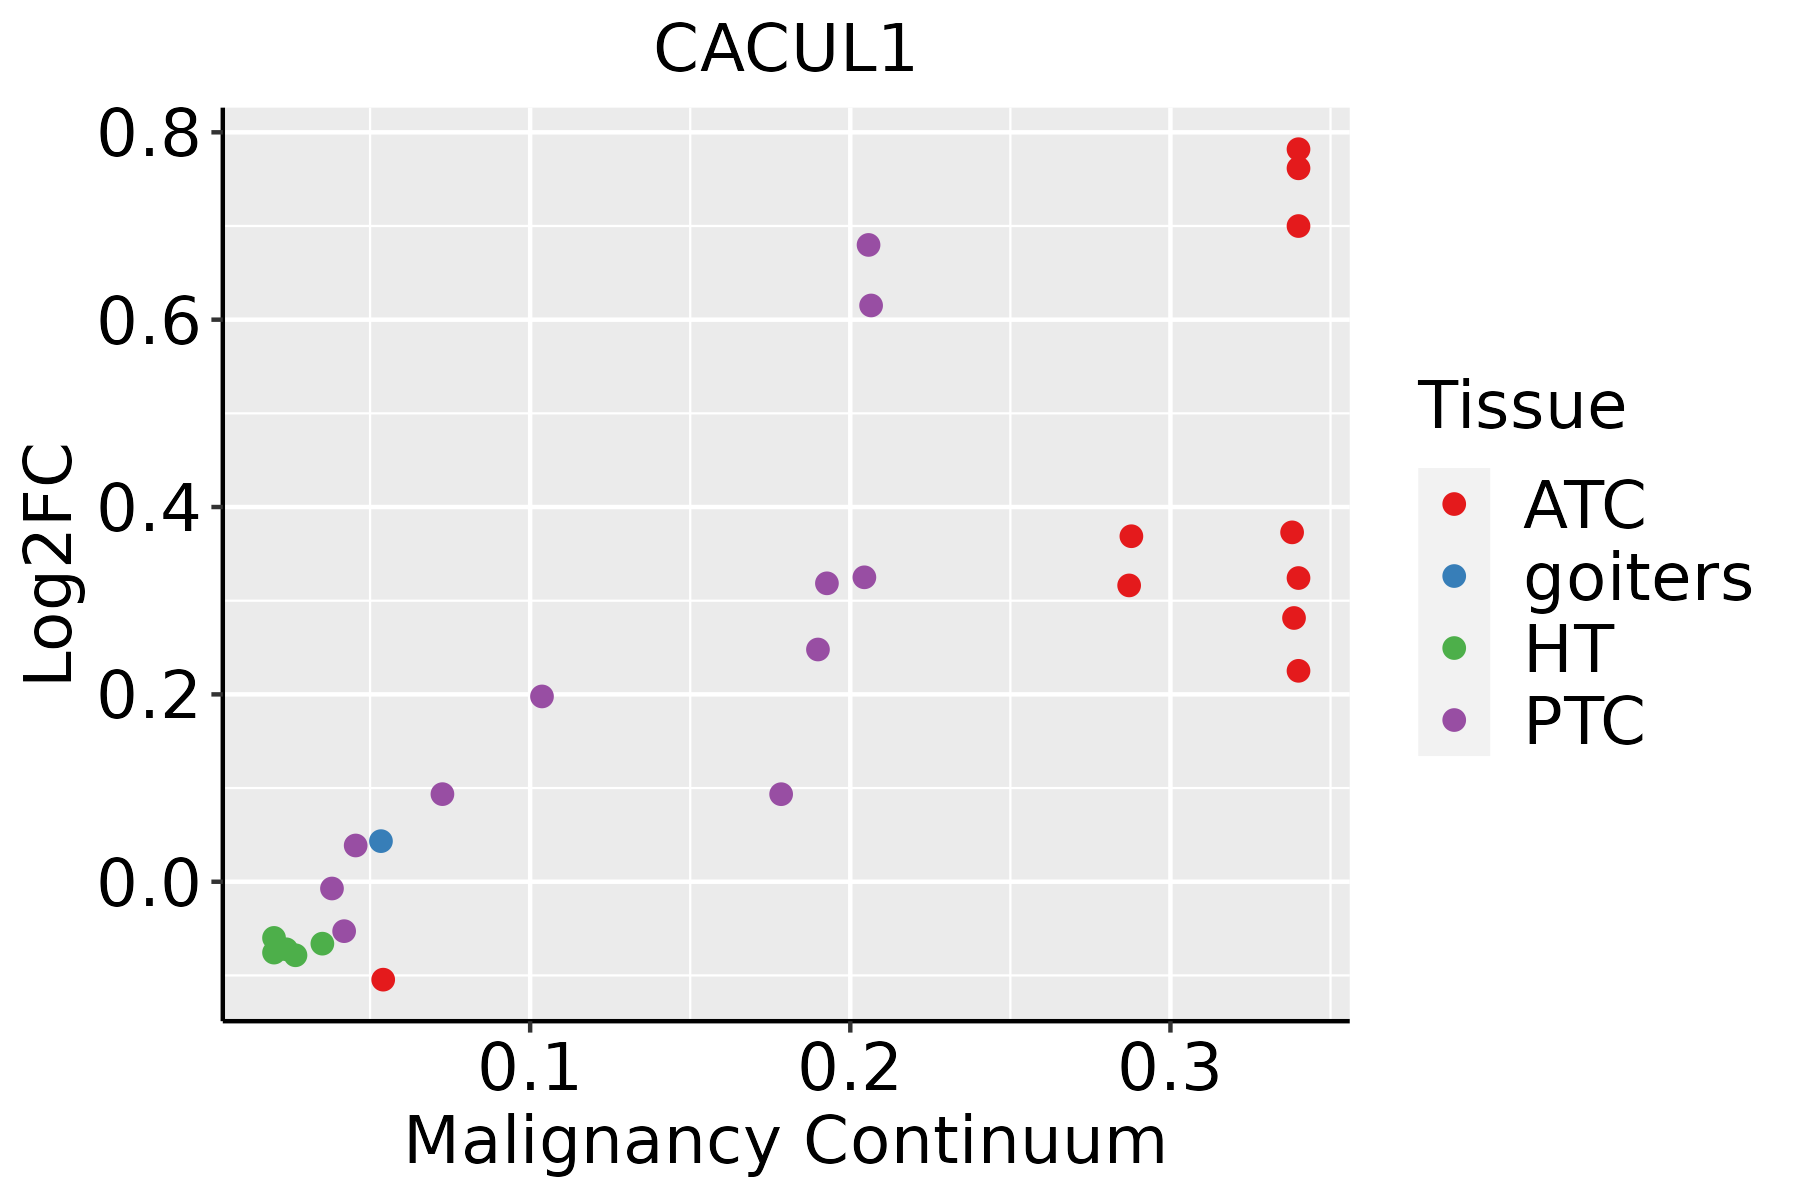
ATC: Anaplastic thyroid cancer
HT: Hashimoto's thyroiditis
PTC: Papillary thyroid cancer
∗log2FC in expression of this searched gene in stem-like cells from each diseased tissue sample relative to stem-like cells in normal samples in each tissue plotted against the malignancy continuum. Samples are colored based on if they are from different disease stage.

Top

Malignant transformation related pathway analysis

check buttonFind out the enriched GO biological processes and KEGG pathways involved in transition from healthy to precancer to cancer
check button Figure of enriched GO biological processes.
TissueDisease StageEnriched GO biological Processes
ColorectumADGO analysis - Figure of enriched GO biological processes: Top 15 enriched GO BP terms are showed in the bar plot of each disease state in each tissue. Each row represents a significant GO biological process which is colored according to the -log10(p.adjust).
ColorectumSERGO analysis - Figure of enriched GO biological processes: Top 15 enriched GO BP terms are showed in the bar plot of each disease state in each tissue. Each row represents a significant GO biological process which is colored according to the -log10(p.adjust).
ColorectumMSSGO analysis - Figure of enriched GO biological processes: Top 15 enriched GO BP terms are showed in the bar plot of each disease state in each tissue. Each row represents a significant GO biological process which is colored according to the -log10(p.adjust).
ColorectumMSI-HGO analysis - Figure of enriched GO biological processes: Top 15 enriched GO BP terms are showed in the bar plot of each disease state in each tissue. Each row represents a significant GO biological process which is colored according to the -log10(p.adjust).
ColorectumFAPGO analysis - Figure of enriched GO biological processes: Top 15 enriched GO BP terms are showed in the bar plot of each disease state in each tissue. Each row represents a significant GO biological process which is colored according to the -log10(p.adjust).
∗Top 15 enriched GO BP terms are showed in the bar plot of each disease state in each tissue. Each row represents a significant GO biological process which is colored according to the -log10(p.adjust).
Page: 1 2 3 4 5 6 7 8 9 

check button Enriched GO biological processes.
GO IDTissueDisease StageDescriptionGene RatioBg Ratiopvaluep.adjustCount
GO:004477216EsophagusESCCmitotic cell cycle phase transition281/8552424/187234.63e-184.45e-16281
GO:000008214EsophagusESCCG1/S transition of mitotic cell cycle134/8552214/187234.04e-075.55e-06134
GO:004484314EsophagusESCCcell cycle G1/S phase transition148/8552241/187235.68e-077.48e-06148
GO:004586018EsophagusESCCpositive regulation of protein kinase activity219/8552386/187236.91e-066.97e-05219
GO:003367420EsophagusESCCpositive regulation of kinase activity260/8552467/187237.26e-067.22e-05260
GO:00458606LiverNAFLDpositive regulation of protein kinase activity65/1882386/187232.22e-056.13e-0465
GO:00336747LiverNAFLDpositive regulation of kinase activity74/1882467/187235.16e-051.19e-0374
GO:0044772LiverNAFLDmitotic cell cycle phase transition67/1882424/187231.25e-042.39e-0367
GO:0044843LiverNAFLDcell cycle G1/S phase transition43/1882241/187231.40e-042.63e-0343
GO:0000082LiverNAFLDG1/S transition of mitotic cell cycle39/1882214/187231.78e-043.14e-0339
GO:00447721LiverCirrhoticmitotic cell cycle phase transition139/4634424/187231.02e-041.06e-03139
GO:00000821LiverCirrhoticG1/S transition of mitotic cell cycle72/4634214/187232.07e-031.28e-0272
GO:00448431LiverCirrhoticcell cycle G1/S phase transition77/4634241/187236.68e-033.30e-0277
GO:004586011LiverCirrhoticpositive regulation of protein kinase activity117/4634386/187237.07e-033.41e-02117
GO:00447722LiverHCCmitotic cell cycle phase transition240/7958424/187232.47e-096.84e-08240
GO:00448432LiverHCCcell cycle G1/S phase transition134/7958241/187232.60e-052.70e-04134
GO:00000822LiverHCCG1/S transition of mitotic cell cycle119/7958214/187237.11e-056.39e-04119
GO:004586021LiverHCCpositive regulation of protein kinase activity194/7958386/187231.16e-036.54e-03194
GO:003367411LiverHCCpositive regulation of kinase activity230/7958467/187231.72e-038.95e-03230
GO:00447728Oral cavityOSCCmitotic cell cycle phase transition255/7305424/187235.29e-196.98e-17255
Page: 1 2 3 

check button Enriched KEGG pathways.
Pathway IDTissueDisease StageDescriptionGene RatioBg Ratiopvaluep.adjustqvalueCount
Page: 1 

Top

Cell-cell communication analysis

check buttonIdentification of potential cell-cell interactions between two cell types and their ligand-receptor pairs for different disease states
LigandReceptorLRpairPathwayTissueDisease Stage
Page: 1 

Top

Single-cell gene regulatory network inference analysis

check buttonFind out the significant the regulons (TFs) and the target genes of each regulon across cell types for different disease states
TFCell TypeTissueDisease StageTarget GeneRSSRegulon Activity
∗The dot plots of a searched regulon are shown for all cell subpopulations in each disease state of each tissue based on the regulon specific score inferred using pySCENIC and by calculating the average expression.
Page: 1 

Top

Somatic mutation of malignant transformation related genes

check buttonAnnotation of somatic variants for genes involved in malignant transformation
Hugo SymbolVariant ClassVariant ClassificationdbSNP RSHGVScHGVSpHGVSp ShortSWISSPROTBIOTYPESIFTPolyPhenTumor Sample BarcodeTissueHistologySexAgeStageTherapy TypesDrugsOutcome
CACUL1SNVMissense_Mutationc.982N>Ap.Asp328Asnp.D328NQ86Y37protein_codingdeleterious(0.03)probably_damaging(0.996)TCGA-A2-A0EV-01Breastbreast invasive carcinomaFemale>=65I/IIUnknownUnknownSD
CACUL1SNVMissense_Mutationnovelc.1093T>Cp.Ser365Prop.S365PQ86Y37protein_codingdeleterious_low_confidence(0)probably_damaging(0.979)TCGA-PL-A8LV-01Breastbreast invasive carcinomaFemale<65III/IVUnknownUnknownSD
CACUL1insertionIn_Frame_Insnovelc.601_602insTTTTTGCTTACAATTTTGGAATTTp.Ser201delinsIlePheAlaTyrAsnPheGlyIleCysp.S201delinsIFAYNFGICQ86Y37protein_codingTCGA-BH-A0HF-01Breastbreast invasive carcinomaFemale>=65I/IIHormone TherapyarimidexSD
CACUL1SNVMissense_Mutationnovelc.1021A>Gp.Thr341Alap.T341AQ86Y37protein_codingtolerated(1)benign(0)TCGA-2W-A8YY-01Cervixcervical & endocervical cancerFemale<65I/IIChemotherapycisplatinCR
CACUL1SNVMissense_Mutationc.313C>Tp.Pro105Serp.P105SQ86Y37protein_codingtolerated_low_confidence(0.12)benign(0.043)TCGA-DG-A2KM-01Cervixcervical & endocervical cancerFemale<65I/IIChemotherapycisplatinSD
CACUL1SNVMissense_Mutationnovelc.703N>Cp.Tyr235Hisp.Y235HQ86Y37protein_codingdeleterious(0)probably_damaging(0.999)TCGA-EA-A3HU-01Cervixcervical & endocervical cancerFemale<65I/IIUnknownUnknownSD
CACUL1SNVMissense_Mutationc.29N>Ap.Gly10Glup.G10EQ86Y37protein_codingtolerated_low_confidence(0.23)benign(0.014)TCGA-A6-5665-01Colorectumcolon adenocarcinomaFemale>=65I/IIUnknownUnknownPD
CACUL1SNVMissense_Mutationc.989N>Cp.Lys330Thrp.K330TQ86Y37protein_codingdeleterious(0)possibly_damaging(0.906)TCGA-AA-3510-01Colorectumcolon adenocarcinomaMale>=65I/IIUnknownUnknownSD
CACUL1SNVMissense_Mutationc.716N>Tp.Lys239Metp.K239MQ86Y37protein_codingdeleterious(0)probably_damaging(0.999)TCGA-D5-6924-01Colorectumcolon adenocarcinomaMale>=65I/IIUnknownUnknownSD
CACUL1SNVMissense_Mutationnovelc.349N>Cp.Thr117Prop.T117PQ86Y37protein_codingtolerated(0.33)benign(0)TCGA-DM-A1HB-01Colorectumcolon adenocarcinomaMale>=65III/IVUnknownUnknownSD
Page: 1 2 3 4 5 

Top

Related drugs of malignant transformation related genes

check buttonIdentification of chemicals and drugs interact with genes involved in malignant transfromation
(DGIdb 4.0)
Entrez IDSymbolCategoryInteraction TypesDrug Claim NameDrug NamePMIDs
Page: 1