
|
|||||
|
 | |
| |
| |
| |
| |
| |
|
Gene: CACFD1 |
Gene summary for CACFD1 |
| Gene information | Species | Human | Gene symbol | CACFD1 | Gene ID | 11094 |
| Gene name | calcium channel flower domain containing 1 | |
| Gene Alias | C9orf7 | |
| Cytomap | 9q34.2 | |
| Gene Type | protein-coding | GO ID | GO:0006810 | UniProtAcc | Q9UGQ2 |
Top |
Malignant transformation analysis |
| Identification of the aberrant gene expression in precancerous and cancerous lesions by comparing the gene expression of stem-like cells in diseased tissues with normal stem cells |
| Entrez ID | Symbol | Replicates | Species | Organ | Tissue | Adj P-value | Log2FC | Malignancy |
| 11094 | CACFD1 | HTA11_2487_2000001011 | Human | Colorectum | SER | 8.46e-13 | 4.48e-01 | -0.1808 |
| 11094 | CACFD1 | HTA11_1938_2000001011 | Human | Colorectum | AD | 6.99e-11 | 3.53e-01 | -0.0811 |
| 11094 | CACFD1 | HTA11_78_2000001011 | Human | Colorectum | AD | 3.86e-05 | 1.91e-01 | -0.1088 |
| 11094 | CACFD1 | HTA11_347_2000001011 | Human | Colorectum | AD | 1.47e-19 | 4.32e-01 | -0.1954 |
| 11094 | CACFD1 | HTA11_411_2000001011 | Human | Colorectum | SER | 1.69e-07 | 9.71e-01 | -0.2602 |
| 11094 | CACFD1 | HTA11_2112_2000001011 | Human | Colorectum | SER | 2.81e-09 | 7.68e-01 | -0.2196 |
| 11094 | CACFD1 | HTA11_3361_2000001011 | Human | Colorectum | AD | 5.82e-08 | 3.11e-01 | -0.1207 |
| 11094 | CACFD1 | HTA11_83_2000001011 | Human | Colorectum | SER | 9.42e-07 | 3.42e-01 | -0.1526 |
| 11094 | CACFD1 | HTA11_696_2000001011 | Human | Colorectum | AD | 1.06e-31 | 5.98e-01 | -0.1464 |
| 11094 | CACFD1 | HTA11_866_2000001011 | Human | Colorectum | AD | 2.43e-07 | 2.03e-01 | -0.1001 |
| 11094 | CACFD1 | HTA11_1391_2000001011 | Human | Colorectum | AD | 1.56e-12 | 3.81e-01 | -0.059 |
| 11094 | CACFD1 | HTA11_2992_2000001011 | Human | Colorectum | SER | 7.34e-03 | 3.93e-01 | -0.1706 |
| 11094 | CACFD1 | HTA11_5212_2000001011 | Human | Colorectum | AD | 1.91e-07 | 4.68e-01 | -0.2061 |
| 11094 | CACFD1 | HTA11_546_2000001011 | Human | Colorectum | AD | 1.05e-05 | 3.32e-01 | -0.0842 |
| 11094 | CACFD1 | HTA11_6801_2000001011 | Human | Colorectum | SER | 1.17e-04 | 3.58e-01 | 0.0171 |
| 11094 | CACFD1 | HTA11_10711_2000001011 | Human | Colorectum | AD | 1.30e-04 | 2.56e-01 | 0.0338 |
| 11094 | CACFD1 | HTA11_7696_3000711011 | Human | Colorectum | AD | 1.17e-07 | 2.33e-01 | 0.0674 |
| 11094 | CACFD1 | HTA11_6818_2000001021 | Human | Colorectum | AD | 2.57e-02 | 1.41e-01 | 0.0588 |
| 11094 | CACFD1 | HTA11_99999971662_82457 | Human | Colorectum | MSS | 1.12e-02 | 1.44e-01 | 0.3859 |
| 11094 | CACFD1 | HTA11_99999973899_84307 | Human | Colorectum | MSS | 2.08e-02 | 1.56e-01 | 0.2585 |
| Page: 1 2 3 4 5 |
| Tissue | Expression Dynamics | Abbreviation |
| Colorectum (GSE201348) |  | FAP: Familial adenomatous polyposis |
| CRC: Colorectal cancer | ||
| Colorectum (HTA11) |  | AD: Adenomas |
| SER: Sessile serrated lesions | ||
| MSI-H: Microsatellite-high colorectal cancer | ||
| MSS: Microsatellite stable colorectal cancer | ||
| Esophagus | 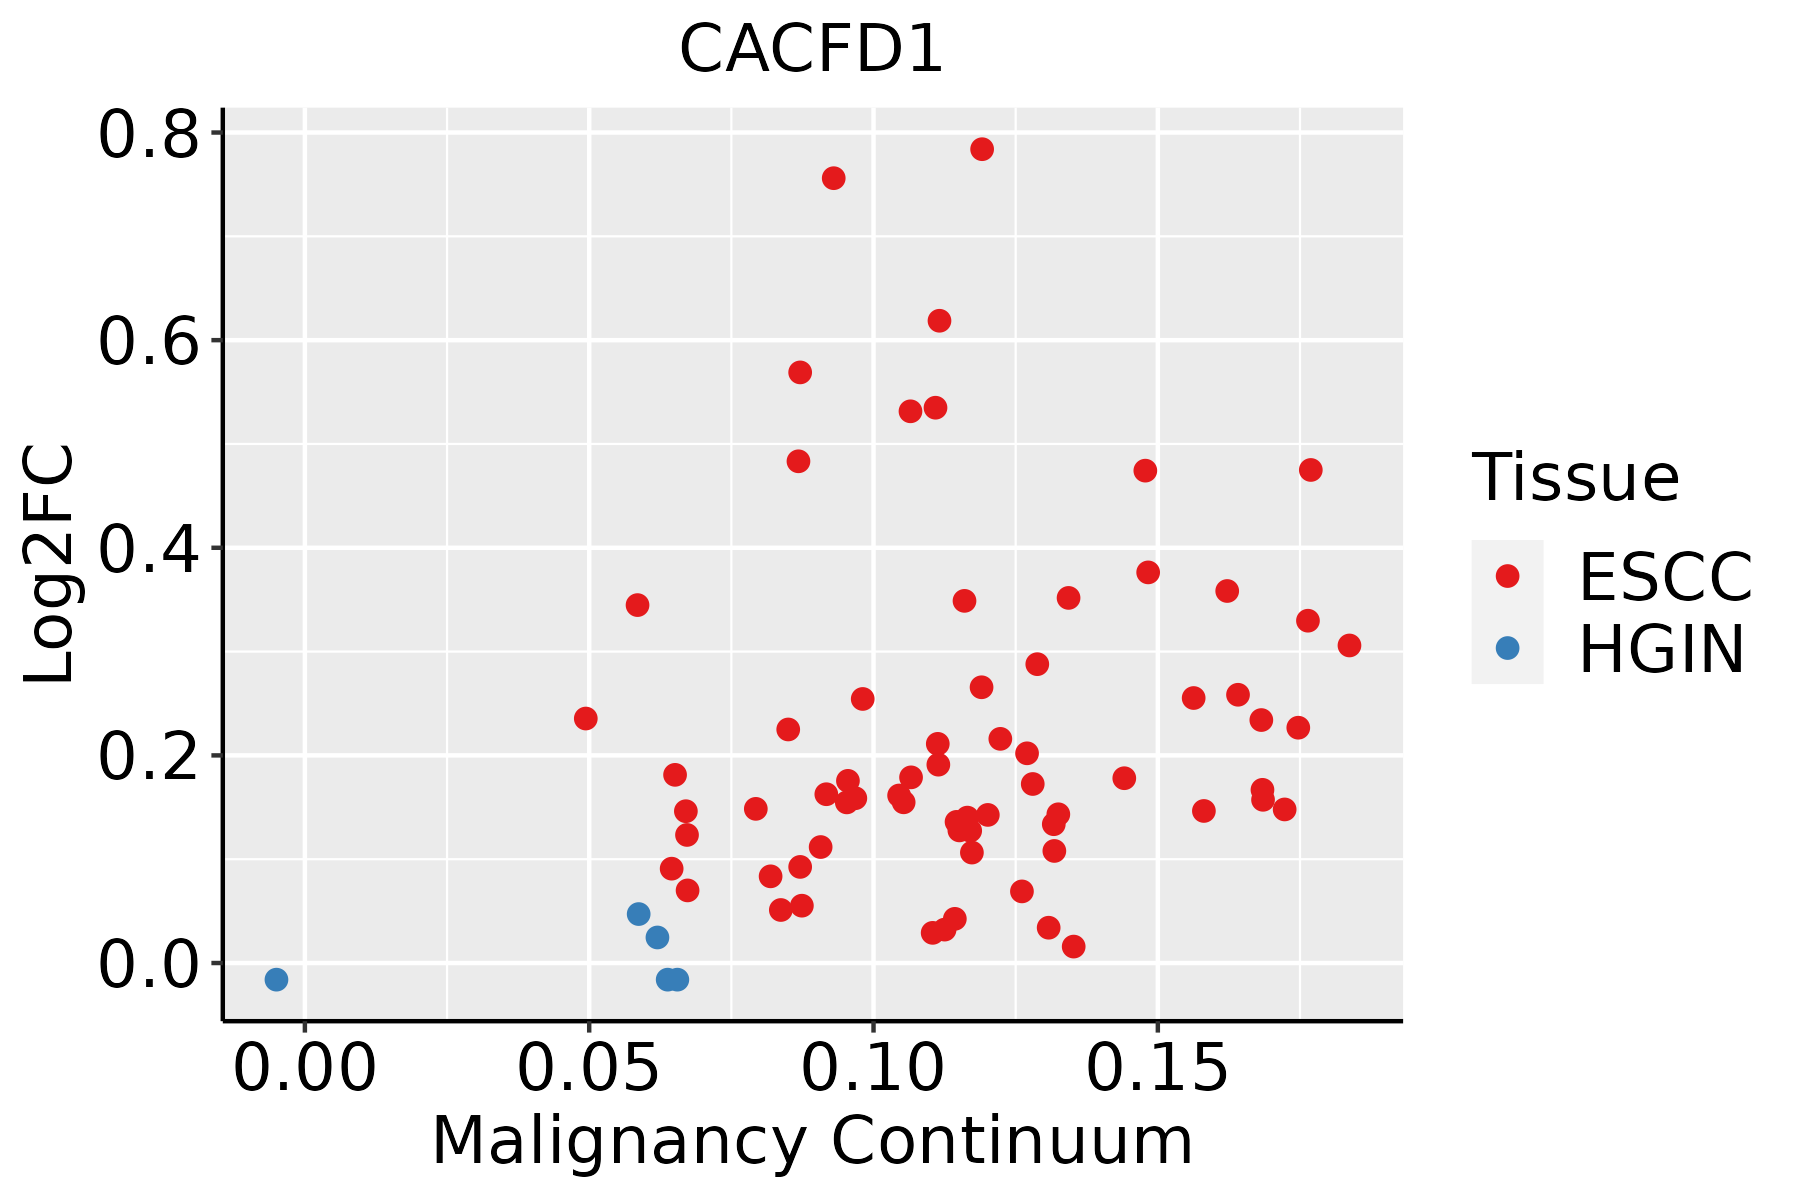 | ESCC: Esophageal squamous cell carcinoma |
| HGIN: High-grade intraepithelial neoplasias | ||
| LGIN: Low-grade intraepithelial neoplasias | ||
| Liver |  | HCC: Hepatocellular carcinoma |
| NAFLD: Non-alcoholic fatty liver disease |
| ∗log2FC in expression of this searched gene in stem-like cells from each diseased tissue sample relative to stem-like cells in normal samples in each tissue plotted against the malignancy continuum. Samples are colored based on if they are from different disease stage. |
Top |
Malignant transformation related pathway analysis |
| Find out the enriched GO biological processes and KEGG pathways involved in transition from healthy to precancer to cancer |
| Tissue | Disease Stage | Enriched GO biological Processes |
| Colorectum | AD |  |
| Colorectum | SER |  |
| Colorectum | MSS |  |
| Colorectum | MSI-H |  |
| Colorectum | FAP |  |
| ∗Top 15 enriched GO BP terms are showed in the bar plot of each disease state in each tissue. Each row represents a significant GO biological process which is colored according to the -log10(p.adjust). |
| Page: 1 2 3 4 5 6 7 8 9 |
| GO ID | Tissue | Disease Stage | Description | Gene Ratio | Bg Ratio | pvalue | p.adjust | Count |
| Page: 1 |
| Pathway ID | Tissue | Disease Stage | Description | Gene Ratio | Bg Ratio | pvalue | p.adjust | qvalue | Count |
| Page: 1 |
Top |
Cell-cell communication analysis |
| Identification of potential cell-cell interactions between two cell types and their ligand-receptor pairs for different disease states |
| Ligand | Receptor | LRpair | Pathway | Tissue | Disease Stage |
| Page: 1 |
Top |
Single-cell gene regulatory network inference analysis |
| Find out the significant the regulons (TFs) and the target genes of each regulon across cell types for different disease states |
| TF | Cell Type | Tissue | Disease Stage | Target Gene | RSS | Regulon Activity |
| ∗The dot plots of a searched regulon are shown for all cell subpopulations in each disease state of each tissue based on the regulon specific score inferred using pySCENIC and by calculating the average expression. |
| Page: 1 |
Top |
Somatic mutation of malignant transformation related genes |
| Annotation of somatic variants for genes involved in malignant transformation |
| Hugo Symbol | Variant Class | Variant Classification | dbSNP RS | HGVSc | HGVSp | HGVSp Short | SWISSPROT | BIOTYPE | SIFT | PolyPhen | Tumor Sample Barcode | Tissue | Histology | Sex | Age | Stage | Therapy Types | Drugs | Outcome |
| CACFD1 | SNV | Missense_Mutation | c.426N>T | p.Lys142Asn | p.K142N | Q9UGQ2 | protein_coding | deleterious(0) | probably_damaging(0.994) | TCGA-A8-A07P-01 | Breast | breast invasive carcinoma | Female | >=65 | I/II | Chemotherapy | 5-fluorouracil | SD | |
| CACFD1 | SNV | Missense_Mutation | c.350N>C | p.Leu117Pro | p.L117P | Q9UGQ2 | protein_coding | tolerated(0.2) | probably_damaging(0.967) | TCGA-AA-3492-01 | Colorectum | colon adenocarcinoma | Female | >=65 | I/II | Unknown | Unknown | SD | |
| CACFD1 | SNV | Missense_Mutation | rs867108595 | c.655G>A | p.Ala219Thr | p.A219T | Q9UGQ2 | protein_coding | tolerated_low_confidence(0.2) | benign(0) | TCGA-AA-3845-01 | Colorectum | colon adenocarcinoma | Female | >=65 | I/II | Unknown | Unknown | PD |
| CACFD1 | SNV | Missense_Mutation | novel | c.646G>T | p.Gly216Trp | p.G216W | Q9UGQ2 | protein_coding | deleterious_low_confidence(0) | possibly_damaging(0.792) | TCGA-AA-A010-01 | Colorectum | colon adenocarcinoma | Female | <65 | I/II | Chemotherapy | folinic | CR |
| CACFD1 | SNV | Missense_Mutation | rs782205792 | c.382N>A | p.Ala128Thr | p.A128T | Q9UGQ2 | protein_coding | tolerated(0.21) | benign(0.184) | TCGA-A5-A0G1-01 | Endometrium | uterine corpus endometrioid carcinoma | Female | >=65 | I/II | Unknown | Unknown | SD |
| CACFD1 | SNV | Missense_Mutation | rs782073285 | c.563N>A | p.Arg188Gln | p.R188Q | Q9UGQ2 | protein_coding | tolerated_low_confidence(0.39) | benign(0) | TCGA-A5-A1OF-01 | Endometrium | uterine corpus endometrioid carcinoma | Female | <65 | I/II | Unknown | Unknown | SD |
| CACFD1 | SNV | Missense_Mutation | rs782205792 | c.382N>A | p.Ala128Thr | p.A128T | Q9UGQ2 | protein_coding | tolerated(0.21) | benign(0.184) | TCGA-A5-A2K5-01 | Endometrium | uterine corpus endometrioid carcinoma | Female | >=65 | I/II | Unknown | Unknown | SD |
| CACFD1 | SNV | Missense_Mutation | c.127N>A | p.Ala43Thr | p.A43T | Q9UGQ2 | protein_coding | deleterious(0.05) | benign(0.104) | TCGA-AP-A0LM-01 | Endometrium | uterine corpus endometrioid carcinoma | Female | <65 | III/IV | Chemotherapy | cisplatin | SD | |
| CACFD1 | SNV | Missense_Mutation | novel | c.435N>T | p.Gln145His | p.Q145H | Q9UGQ2 | protein_coding | deleterious(0.02) | possibly_damaging(0.607) | TCGA-AX-A2HD-01 | Endometrium | uterine corpus endometrioid carcinoma | Female | >=65 | III/IV | Unknown | Unknown | SD |
| CACFD1 | SNV | Missense_Mutation | c.218N>C | p.Leu73Pro | p.L73P | Q9UGQ2 | protein_coding | deleterious(0.01) | probably_damaging(0.955) | TCGA-B5-A11H-01 | Endometrium | uterine corpus endometrioid carcinoma | Female | >=65 | III/IV | Hormone Therapy | megace | SD |
| Page: 1 2 |
Top |
Related drugs of malignant transformation related genes |
| Identification of chemicals and drugs interact with genes involved in malignant transfromation |
| (DGIdb 4.0) |
| Entrez ID | Symbol | Category | Interaction Types | Drug Claim Name | Drug Name | PMIDs |
| Page: 1 |

Copyright 2023-Present -The University of Texas Health Science Center at Houston |