
|
|||||
|
 | |
| |
| |
| |
| |
| |
|
Gene: CABYR |
Gene summary for CABYR |
| Gene information | Species | Human | Gene symbol | CABYR | Gene ID | 26256 |
| Gene name | calcium binding tyrosine phosphorylation regulated | |
| Gene Alias | CABYRa | |
| Cytomap | 18q11.2 | |
| Gene Type | protein-coding | GO ID | GO:0000003 | UniProtAcc | A0A0D9SFQ2 |
Top |
Malignant transformation analysis |
| Identification of the aberrant gene expression in precancerous and cancerous lesions by comparing the gene expression of stem-like cells in diseased tissues with normal stem cells |
| Entrez ID | Symbol | Replicates | Species | Organ | Tissue | Adj P-value | Log2FC | Malignancy |
| 26256 | CABYR | LZE4T | Human | Esophagus | ESCC | 3.18e-05 | 1.96e-01 | 0.0811 |
| 26256 | CABYR | LZE7T | Human | Esophagus | ESCC | 1.62e-04 | 2.60e-01 | 0.0667 |
| 26256 | CABYR | P2T-E | Human | Esophagus | ESCC | 2.37e-10 | 1.53e-01 | 0.1177 |
| 26256 | CABYR | P4T-E | Human | Esophagus | ESCC | 1.49e-09 | 2.03e-01 | 0.1323 |
| 26256 | CABYR | P8T-E | Human | Esophagus | ESCC | 8.50e-10 | 7.17e-02 | 0.0889 |
| 26256 | CABYR | P9T-E | Human | Esophagus | ESCC | 1.78e-21 | 4.61e-01 | 0.1131 |
| 26256 | CABYR | P10T-E | Human | Esophagus | ESCC | 1.73e-06 | 6.58e-02 | 0.116 |
| 26256 | CABYR | P12T-E | Human | Esophagus | ESCC | 3.22e-07 | 1.38e-01 | 0.1122 |
| 26256 | CABYR | P15T-E | Human | Esophagus | ESCC | 8.54e-16 | 4.03e-01 | 0.1149 |
| 26256 | CABYR | P16T-E | Human | Esophagus | ESCC | 1.37e-12 | 1.29e-01 | 0.1153 |
| 26256 | CABYR | P21T-E | Human | Esophagus | ESCC | 2.12e-08 | 1.07e-01 | 0.1617 |
| 26256 | CABYR | P22T-E | Human | Esophagus | ESCC | 3.07e-16 | 3.25e-01 | 0.1236 |
| 26256 | CABYR | P26T-E | Human | Esophagus | ESCC | 1.88e-12 | 1.47e-01 | 0.1276 |
| 26256 | CABYR | P27T-E | Human | Esophagus | ESCC | 6.77e-09 | 1.14e-01 | 0.1055 |
| 26256 | CABYR | P28T-E | Human | Esophagus | ESCC | 4.71e-07 | 9.33e-02 | 0.1149 |
| 26256 | CABYR | P30T-E | Human | Esophagus | ESCC | 5.31e-17 | 5.83e-01 | 0.137 |
| 26256 | CABYR | P31T-E | Human | Esophagus | ESCC | 9.91e-04 | 1.08e-01 | 0.1251 |
| 26256 | CABYR | P32T-E | Human | Esophagus | ESCC | 1.53e-06 | 1.16e-01 | 0.1666 |
| 26256 | CABYR | P39T-E | Human | Esophagus | ESCC | 2.43e-07 | 1.98e-01 | 0.0894 |
| 26256 | CABYR | P42T-E | Human | Esophagus | ESCC | 2.93e-03 | 1.19e-01 | 0.1175 |
| Page: 1 2 |
| Tissue | Expression Dynamics | Abbreviation |
| Esophagus | 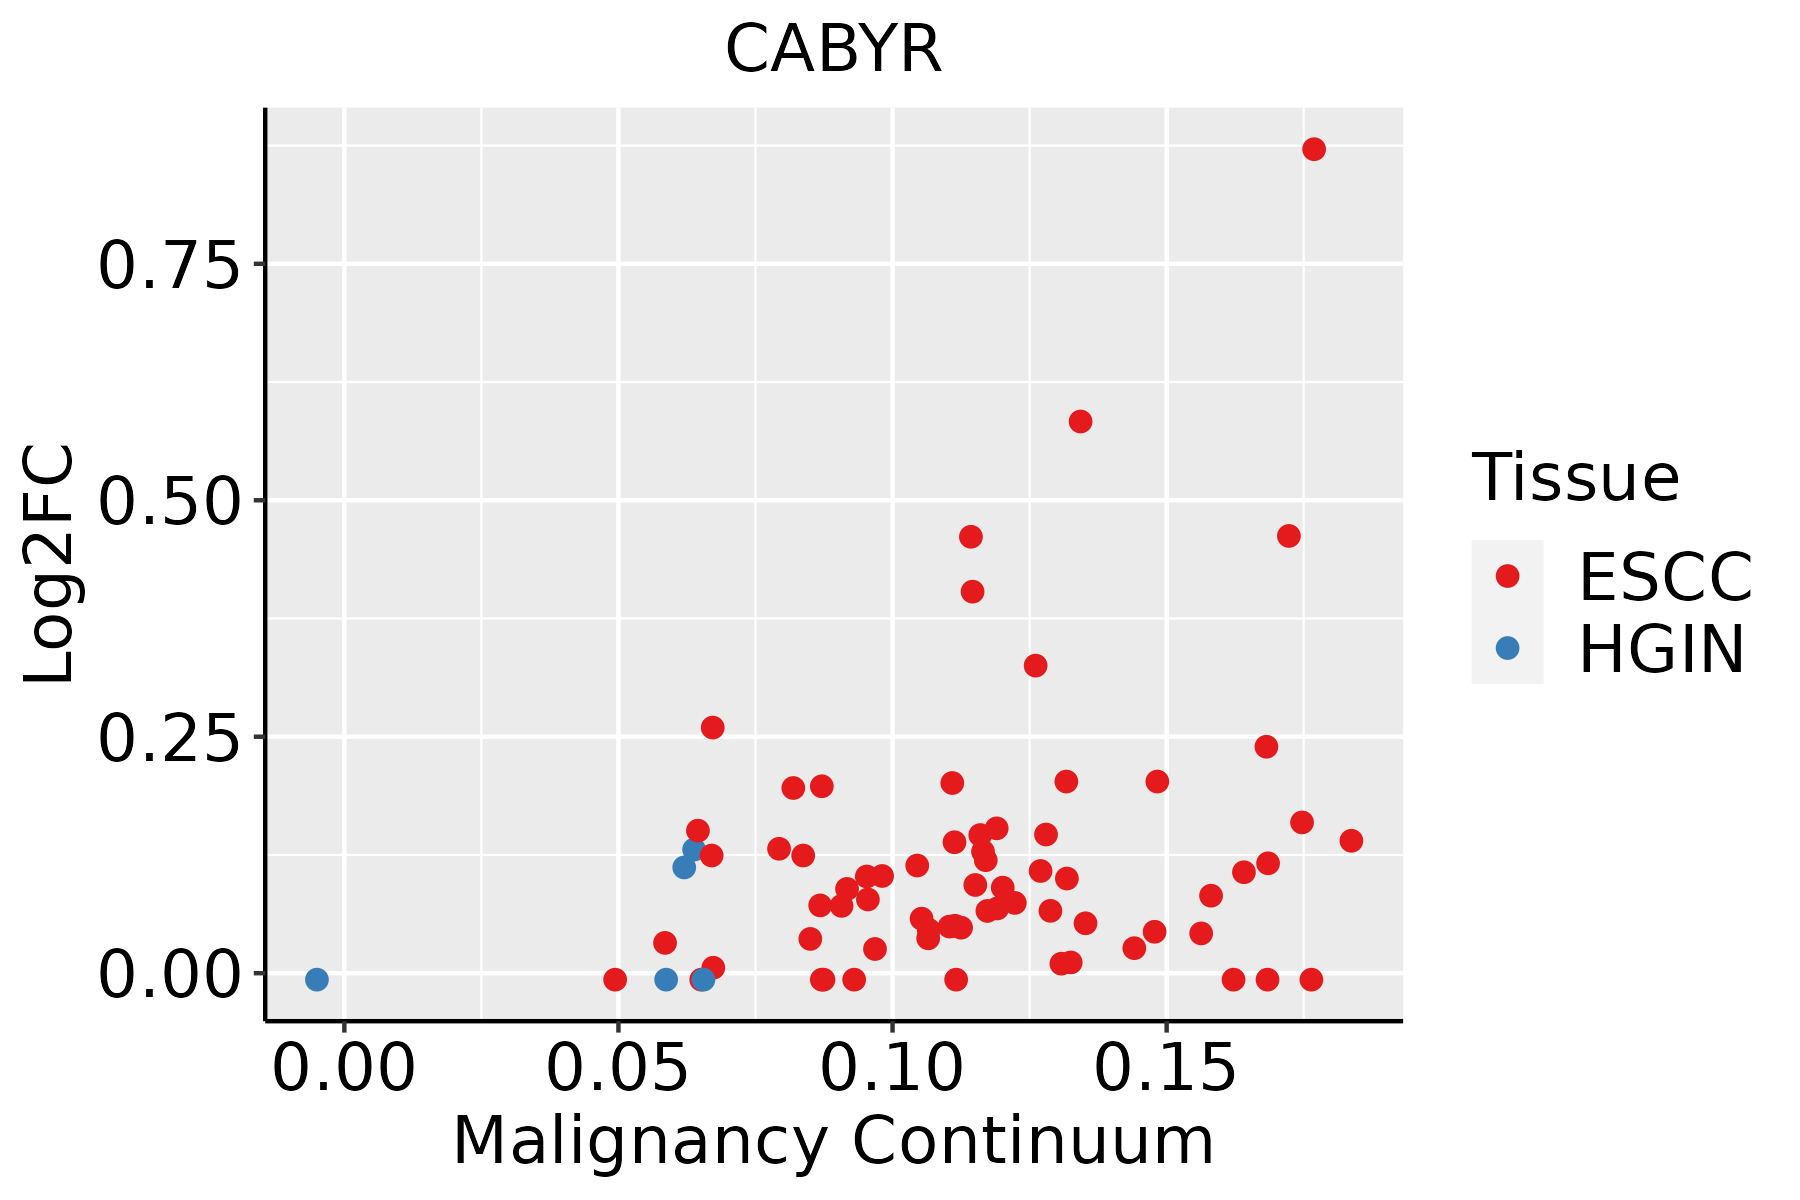 | ESCC: Esophageal squamous cell carcinoma |
| HGIN: High-grade intraepithelial neoplasias | ||
| LGIN: Low-grade intraepithelial neoplasias |
| ∗log2FC in expression of this searched gene in stem-like cells from each diseased tissue sample relative to stem-like cells in normal samples in each tissue plotted against the malignancy continuum. Samples are colored based on if they are from different disease stage. |
Top |
Malignant transformation related pathway analysis |
| Find out the enriched GO biological processes and KEGG pathways involved in transition from healthy to precancer to cancer |
| Tissue | Disease Stage | Enriched GO biological Processes |
| Colorectum | AD |  |
| Colorectum | SER |  |
| Colorectum | MSS |  |
| Colorectum | MSI-H |  |
| Colorectum | FAP |  |
| ∗Top 15 enriched GO BP terms are showed in the bar plot of each disease state in each tissue. Each row represents a significant GO biological process which is colored according to the -log10(p.adjust). |
| Page: 1 2 3 4 5 6 7 8 9 |
| GO ID | Tissue | Disease Stage | Description | Gene Ratio | Bg Ratio | pvalue | p.adjust | Count |
| GO:00991114 | Esophagus | ESCC | microtubule-based transport | 115/8552 | 190/18723 | 2.54e-05 | 2.15e-04 | 115 |
| Page: 1 |
| Pathway ID | Tissue | Disease Stage | Description | Gene Ratio | Bg Ratio | pvalue | p.adjust | qvalue | Count |
| Page: 1 |
Top |
Cell-cell communication analysis |
| Identification of potential cell-cell interactions between two cell types and their ligand-receptor pairs for different disease states |
| Ligand | Receptor | LRpair | Pathway | Tissue | Disease Stage |
| Page: 1 |
Top |
Single-cell gene regulatory network inference analysis |
| Find out the significant the regulons (TFs) and the target genes of each regulon across cell types for different disease states |
| TF | Cell Type | Tissue | Disease Stage | Target Gene | RSS | Regulon Activity |
| ∗The dot plots of a searched regulon are shown for all cell subpopulations in each disease state of each tissue based on the regulon specific score inferred using pySCENIC and by calculating the average expression. |
| Page: 1 |
Top |
Somatic mutation of malignant transformation related genes |
| Annotation of somatic variants for genes involved in malignant transformation |
| Hugo Symbol | Variant Class | Variant Classification | dbSNP RS | HGVSc | HGVSp | HGVSp Short | SWISSPROT | BIOTYPE | SIFT | PolyPhen | Tumor Sample Barcode | Tissue | Histology | Sex | Age | Stage | Therapy Types | Drugs | Outcome |
| CABYR | SNV | Missense_Mutation | c.371C>T | p.Ser124Leu | p.S124L | O75952 | protein_coding | deleterious(0.02) | probably_damaging(0.96) | TCGA-A1-A0SN-01 | Breast | breast invasive carcinoma | Female | <65 | I/II | Chemotherapy | ac | SD | |
| CABYR | SNV | Missense_Mutation | rs779314323 | c.401N>T | p.Thr134Met | p.T134M | O75952 | protein_coding | deleterious(0.03) | possibly_damaging(0.469) | TCGA-EW-A1IZ-01 | Breast | breast invasive carcinoma | Female | <65 | III/IV | Chemotherapy | taxotere | SD |
| CABYR | SNV | Missense_Mutation | novel | c.1047N>C | p.Glu349Asp | p.E349D | O75952 | protein_coding | tolerated_low_confidence(0.64) | benign(0) | TCGA-OL-A5RZ-01 | Breast | breast invasive carcinoma | Female | <65 | I/II | Chemotherapy | doxorubicin | CR |
| CABYR | insertion | Frame_Shift_Ins | novel | c.522_523insGATTATA | p.Leu175AspfsTer10 | p.L175Dfs*10 | O75952 | protein_coding | TCGA-A8-A0A4-01 | Breast | breast invasive carcinoma | Female | >=65 | I/II | Hormone Therapy | tamoxiphen | CR | ||
| CABYR | insertion | Nonsense_Mutation | novel | c.523_524insGCATGAGCCATCGTGCCTGACCTAGTGTTTGCAT | p.Leu175ArgfsTer7 | p.L175Rfs*7 | O75952 | protein_coding | TCGA-A8-A0A4-01 | Breast | breast invasive carcinoma | Female | >=65 | I/II | Hormone Therapy | tamoxiphen | CR | ||
| CABYR | insertion | Frame_Shift_Ins | novel | c.1416_1417insTG | p.Pro473CysfsTer25 | p.P473Cfs*25 | O75952 | protein_coding | TCGA-BH-A0H7-01 | Breast | breast invasive carcinoma | Female | >=65 | III/IV | Chemotherapy | doxorubicin | SD | ||
| CABYR | insertion | Frame_Shift_Ins | novel | c.1418_1419insAGAACAAATAGTTATCCCTTTTACTGATCAAGTTGCTTGTC | p.Pro474GlufsTer37 | p.P474Efs*37 | O75952 | protein_coding | TCGA-BH-A0H7-01 | Breast | breast invasive carcinoma | Female | >=65 | III/IV | Chemotherapy | doxorubicin | SD | ||
| CABYR | SNV | Missense_Mutation | c.520N>A | p.Gln174Lys | p.Q174K | O75952 | protein_coding | deleterious(0) | probably_damaging(0.989) | TCGA-C5-A1BQ-01 | Cervix | cervical & endocervical cancer | Female | >=65 | III/IV | Chemotherapy | cisplatin | CR | |
| CABYR | SNV | Missense_Mutation | novel | c.389N>A | p.Gly130Asp | p.G130D | O75952 | protein_coding | tolerated(0.55) | benign(0.15) | TCGA-VS-A94Z-01 | Cervix | cervical & endocervical cancer | Female | <65 | I/II | Chemotherapy | cisplatin | CR |
| CABYR | SNV | Missense_Mutation | novel | c.454N>A | p.Pro152Thr | p.P152T | O75952 | protein_coding | deleterious(0) | probably_damaging(0.997) | TCGA-VS-A9V1-01 | Cervix | cervical & endocervical cancer | Female | <65 | I/II | Chemotherapy | cisplatin | PD |
| Page: 1 2 3 4 5 |
Top |
Related drugs of malignant transformation related genes |
| Identification of chemicals and drugs interact with genes involved in malignant transfromation |
| (DGIdb 4.0) |
| Entrez ID | Symbol | Category | Interaction Types | Drug Claim Name | Drug Name | PMIDs |
| Page: 1 |

Copyright 2023-Present -The University of Texas Health Science Center at Houston |