
|
|||||
|
 | |
| |
| |
| |
| |
| |
|
Gene: CABIN1 |
Gene summary for CABIN1 |
| Gene information | Species | Human | Gene symbol | CABIN1 | Gene ID | 23523 |
| Gene name | calcineurin binding protein 1 | |
| Gene Alias | CAIN | |
| Cytomap | 22q11.23 | |
| Gene Type | protein-coding | GO ID | GO:0006323 | UniProtAcc | A0A024R1E5 |
Top |
Malignant transformation analysis |
| Identification of the aberrant gene expression in precancerous and cancerous lesions by comparing the gene expression of stem-like cells in diseased tissues with normal stem cells |
| Entrez ID | Symbol | Replicates | Species | Organ | Tissue | Adj P-value | Log2FC | Malignancy |
| 23523 | CABIN1 | LZE4T | Human | Esophagus | ESCC | 3.87e-08 | 1.64e-01 | 0.0811 |
| 23523 | CABIN1 | LZE7T | Human | Esophagus | ESCC | 2.63e-05 | 3.35e-01 | 0.0667 |
| 23523 | CABIN1 | LZE24T | Human | Esophagus | ESCC | 1.22e-04 | 1.98e-01 | 0.0596 |
| 23523 | CABIN1 | LZE6T | Human | Esophagus | ESCC | 1.87e-04 | 2.02e-01 | 0.0845 |
| 23523 | CABIN1 | P1T-E | Human | Esophagus | ESCC | 1.79e-08 | 3.67e-01 | 0.0875 |
| 23523 | CABIN1 | P2T-E | Human | Esophagus | ESCC | 7.26e-15 | 2.67e-01 | 0.1177 |
| 23523 | CABIN1 | P4T-E | Human | Esophagus | ESCC | 4.60e-12 | 2.55e-01 | 0.1323 |
| 23523 | CABIN1 | P5T-E | Human | Esophagus | ESCC | 2.18e-12 | 1.36e-01 | 0.1327 |
| 23523 | CABIN1 | P8T-E | Human | Esophagus | ESCC | 4.79e-09 | 1.31e-01 | 0.0889 |
| 23523 | CABIN1 | P9T-E | Human | Esophagus | ESCC | 1.49e-15 | 3.31e-01 | 0.1131 |
| 23523 | CABIN1 | P10T-E | Human | Esophagus | ESCC | 5.16e-24 | 3.02e-01 | 0.116 |
| 23523 | CABIN1 | P11T-E | Human | Esophagus | ESCC | 6.90e-03 | 1.59e-01 | 0.1426 |
| 23523 | CABIN1 | P12T-E | Human | Esophagus | ESCC | 1.26e-09 | 2.17e-01 | 0.1122 |
| 23523 | CABIN1 | P15T-E | Human | Esophagus | ESCC | 1.64e-21 | 5.30e-01 | 0.1149 |
| 23523 | CABIN1 | P16T-E | Human | Esophagus | ESCC | 3.30e-19 | 3.99e-01 | 0.1153 |
| 23523 | CABIN1 | P17T-E | Human | Esophagus | ESCC | 3.20e-02 | 1.58e-01 | 0.1278 |
| 23523 | CABIN1 | P20T-E | Human | Esophagus | ESCC | 5.70e-08 | 1.36e-01 | 0.1124 |
| 23523 | CABIN1 | P21T-E | Human | Esophagus | ESCC | 9.04e-17 | 1.87e-01 | 0.1617 |
| 23523 | CABIN1 | P22T-E | Human | Esophagus | ESCC | 5.84e-19 | 3.27e-01 | 0.1236 |
| 23523 | CABIN1 | P23T-E | Human | Esophagus | ESCC | 1.58e-11 | 2.95e-01 | 0.108 |
| Page: 1 2 3 4 5 |
| Tissue | Expression Dynamics | Abbreviation |
| Esophagus | 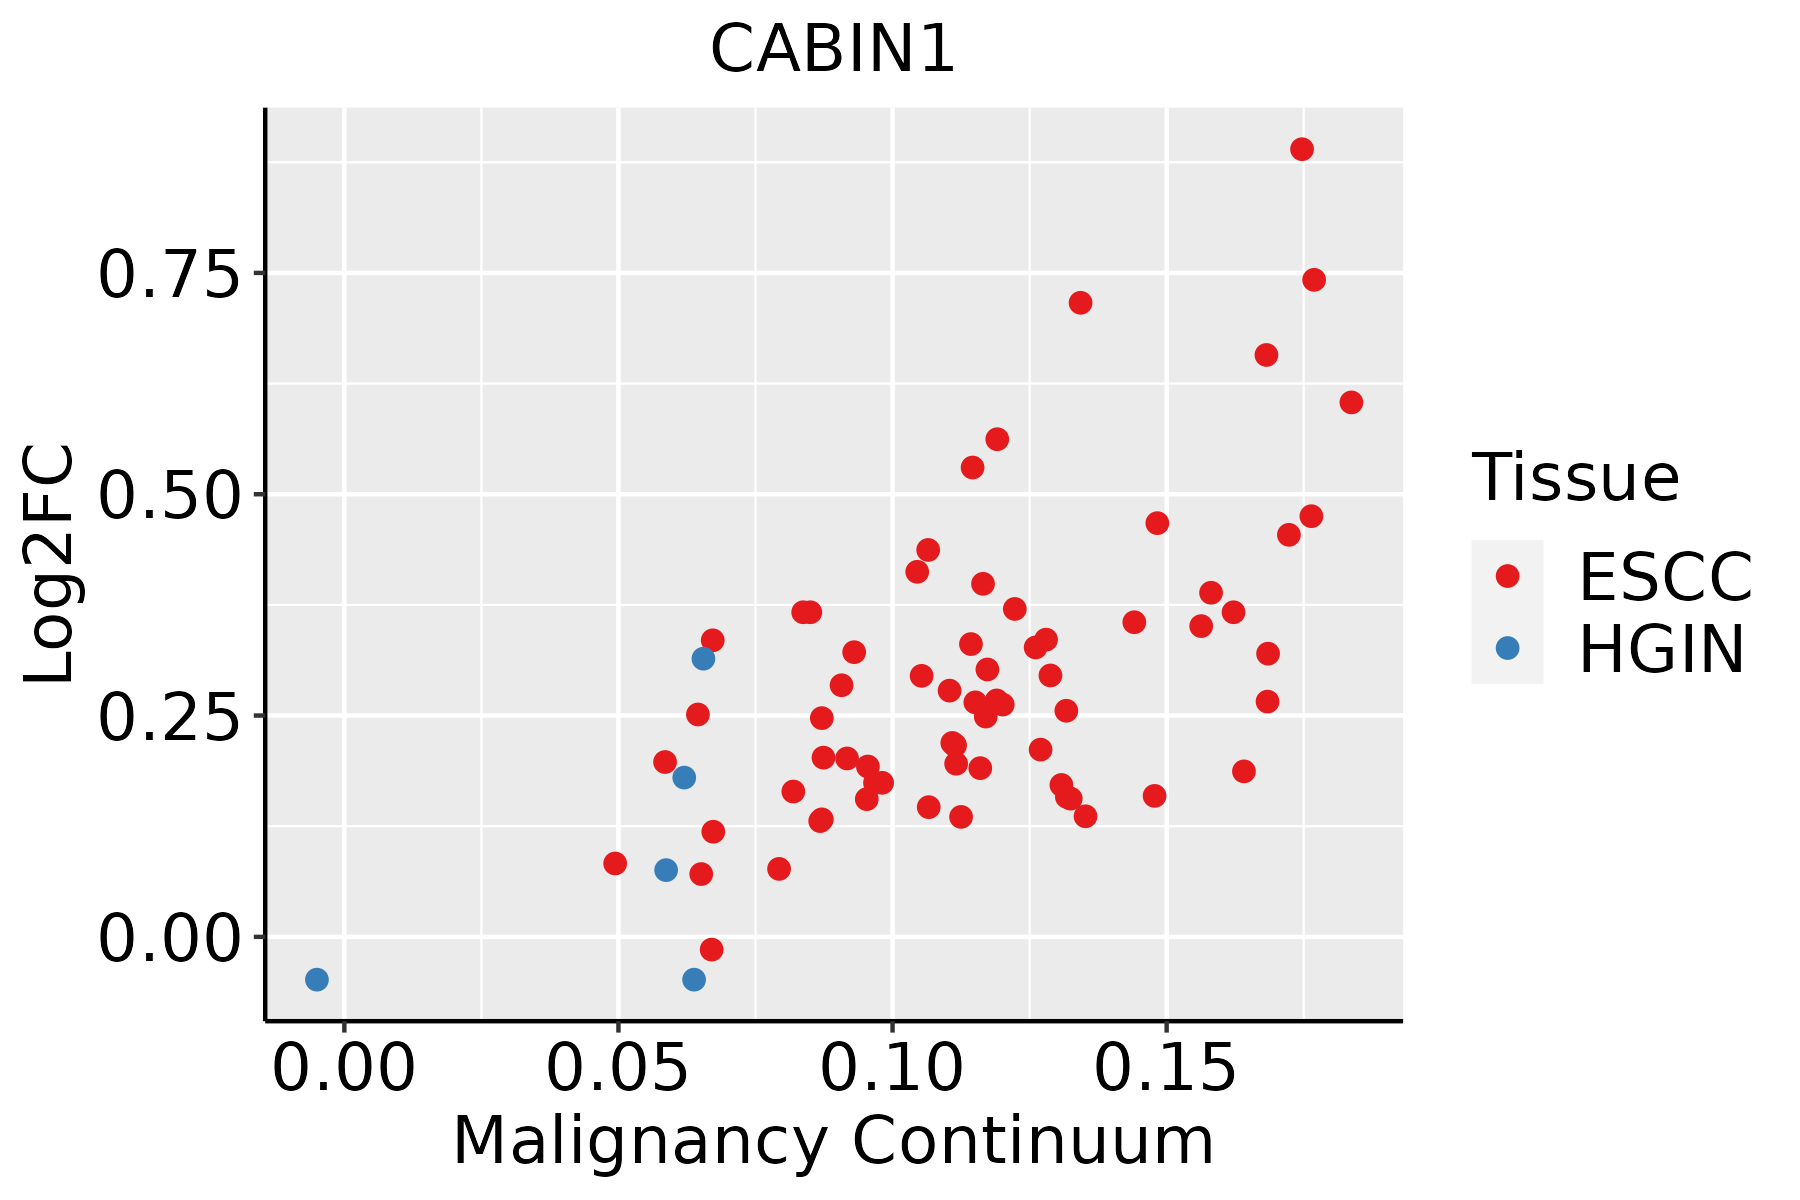 | ESCC: Esophageal squamous cell carcinoma |
| HGIN: High-grade intraepithelial neoplasias | ||
| LGIN: Low-grade intraepithelial neoplasias | ||
| Liver |  | HCC: Hepatocellular carcinoma |
| NAFLD: Non-alcoholic fatty liver disease | ||
| Thyroid | 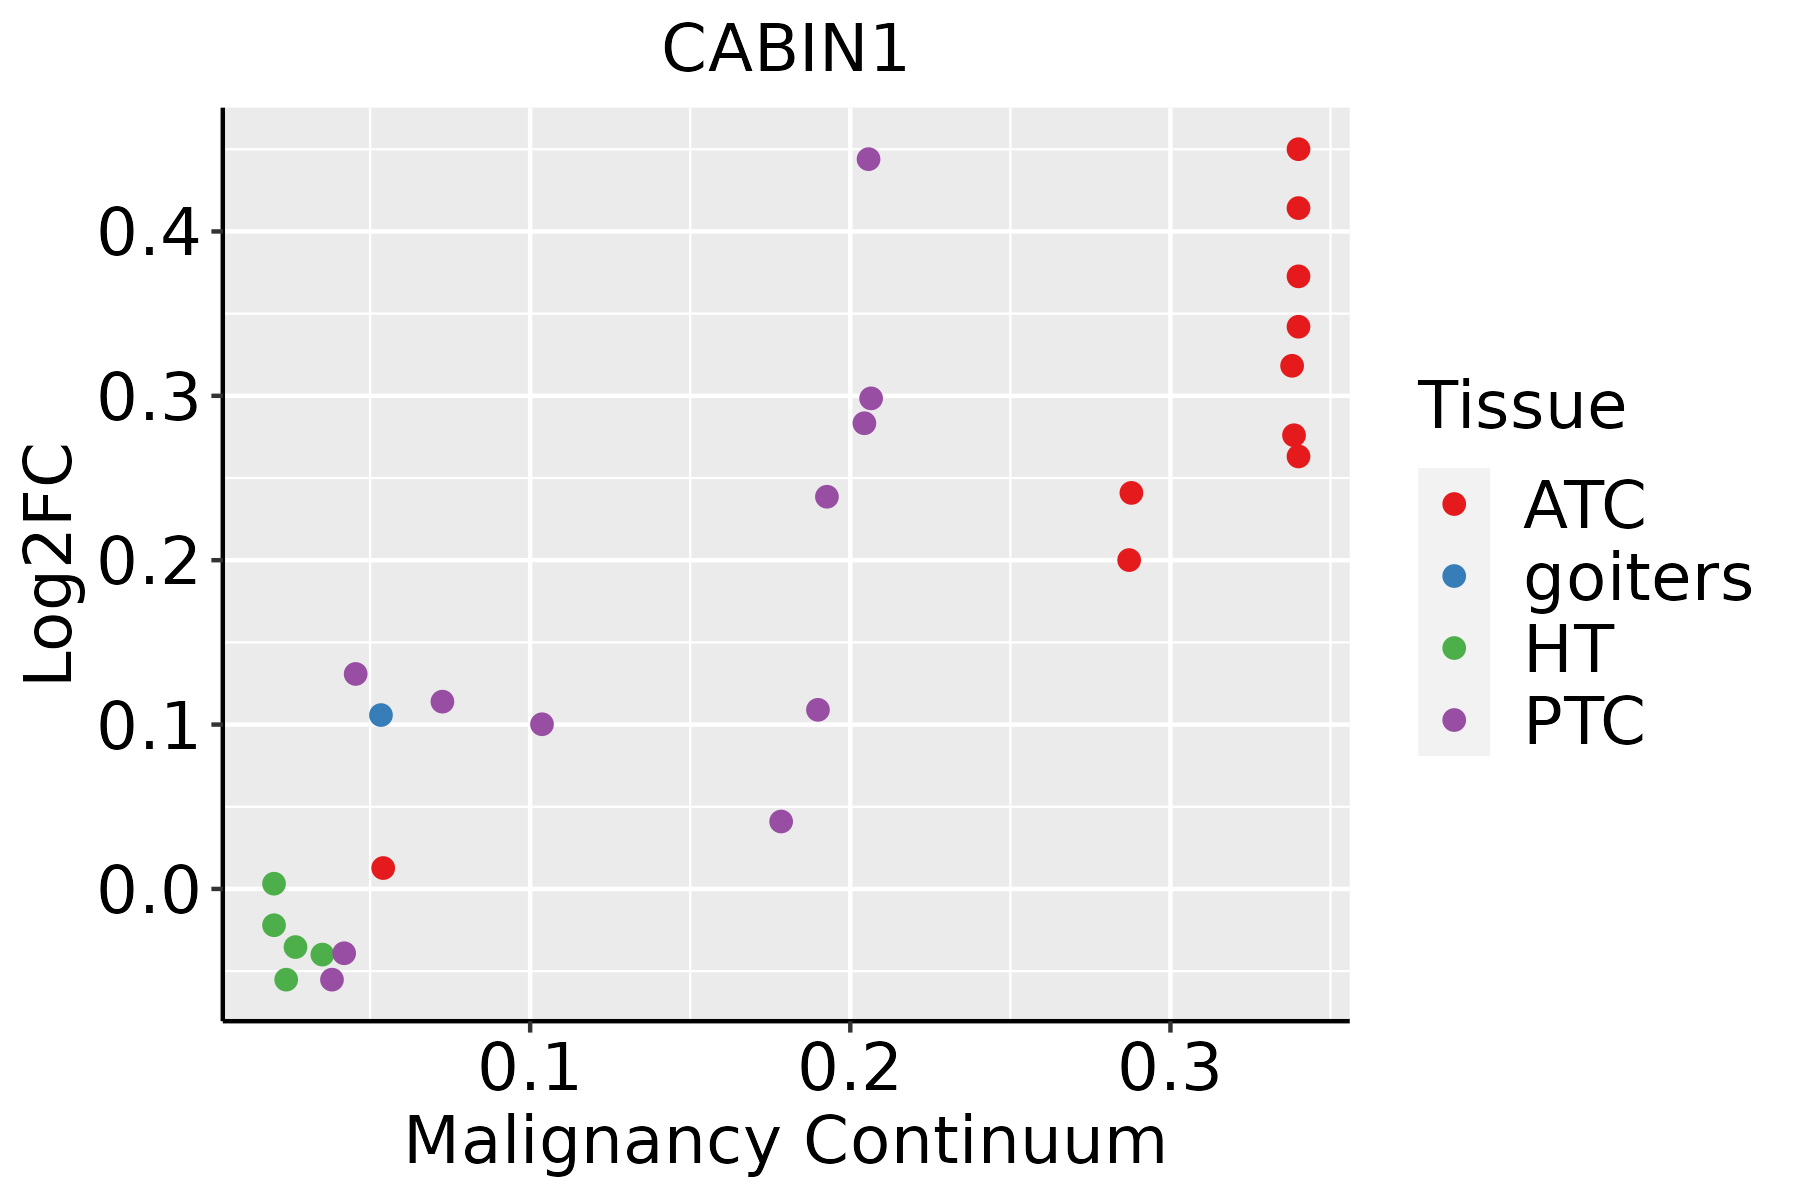 | ATC: Anaplastic thyroid cancer |
| HT: Hashimoto's thyroiditis | ||
| PTC: Papillary thyroid cancer |
| ∗log2FC in expression of this searched gene in stem-like cells from each diseased tissue sample relative to stem-like cells in normal samples in each tissue plotted against the malignancy continuum. Samples are colored based on if they are from different disease stage. |
Top |
Malignant transformation related pathway analysis |
| Find out the enriched GO biological processes and KEGG pathways involved in transition from healthy to precancer to cancer |
| Tissue | Disease Stage | Enriched GO biological Processes |
| Colorectum | AD |  |
| Colorectum | SER |  |
| Colorectum | MSS |  |
| Colorectum | MSI-H |  |
| Colorectum | FAP |  |
| ∗Top 15 enriched GO BP terms are showed in the bar plot of each disease state in each tissue. Each row represents a significant GO biological process which is colored according to the -log10(p.adjust). |
| Page: 1 2 3 4 5 6 7 8 9 |
| GO ID | Tissue | Disease Stage | Description | Gene Ratio | Bg Ratio | pvalue | p.adjust | Count |
| GO:000632517 | Esophagus | ESCC | chromatin organization | 240/8552 | 409/18723 | 6.52e-08 | 1.14e-06 | 240 |
| GO:00063255 | Liver | NAFLD | chromatin organization | 64/1882 | 409/18723 | 2.31e-04 | 3.89e-03 | 64 |
| GO:000632511 | Liver | HCC | chromatin organization | 206/7958 | 409/18723 | 7.23e-04 | 4.41e-03 | 206 |
| GO:000632520 | Thyroid | PTC | chromatin organization | 183/5968 | 409/18723 | 2.55e-08 | 5.70e-07 | 183 |
| GO:00063385 | Thyroid | PTC | chromatin remodeling | 106/5968 | 255/18723 | 6.56e-04 | 4.13e-03 | 106 |
| GO:0006325110 | Thyroid | ATC | chromatin organization | 189/6293 | 409/18723 | 6.40e-08 | 1.13e-06 | 189 |
| GO:000633813 | Thyroid | ATC | chromatin remodeling | 109/6293 | 255/18723 | 1.38e-03 | 7.15e-03 | 109 |
| GO:00718242 | Thyroid | ATC | protein-DNA complex subunit organization | 103/6293 | 241/18723 | 1.84e-03 | 9.03e-03 | 103 |
| Page: 1 |
| Pathway ID | Tissue | Disease Stage | Description | Gene Ratio | Bg Ratio | pvalue | p.adjust | qvalue | Count |
| Page: 1 |
Top |
Cell-cell communication analysis |
| Identification of potential cell-cell interactions between two cell types and their ligand-receptor pairs for different disease states |
| Ligand | Receptor | LRpair | Pathway | Tissue | Disease Stage |
| Page: 1 |
Top |
Single-cell gene regulatory network inference analysis |
| Find out the significant the regulons (TFs) and the target genes of each regulon across cell types for different disease states |
| TF | Cell Type | Tissue | Disease Stage | Target Gene | RSS | Regulon Activity |
| ∗The dot plots of a searched regulon are shown for all cell subpopulations in each disease state of each tissue based on the regulon specific score inferred using pySCENIC and by calculating the average expression. |
| Page: 1 |
Top |
Somatic mutation of malignant transformation related genes |
| Annotation of somatic variants for genes involved in malignant transformation |
| Hugo Symbol | Variant Class | Variant Classification | dbSNP RS | HGVSc | HGVSp | HGVSp Short | SWISSPROT | BIOTYPE | SIFT | PolyPhen | Tumor Sample Barcode | Tissue | Histology | Sex | Age | Stage | Therapy Types | Drugs | Outcome |
| CABIN1 | SNV | Missense_Mutation | novel | c.4066N>C | p.Asp1356His | p.D1356H | Q9Y6J0 | protein_coding | deleterious(0) | probably_damaging(0.998) | TCGA-5L-AAT1-01 | Breast | breast invasive carcinoma | Female | <65 | III/IV | Hormone Therapy | letrozol | SD |
| CABIN1 | SNV | Missense_Mutation | c.4675N>A | p.Pro1559Thr | p.P1559T | Q9Y6J0 | protein_coding | deleterious(0.01) | probably_damaging(0.915) | TCGA-A2-A0EY-01 | Breast | breast invasive carcinoma | Female | <65 | I/II | Chemotherapy | adriamycin | SD | |
| CABIN1 | SNV | Missense_Mutation | novel | c.21N>C | p.Leu7Phe | p.L7F | Q9Y6J0 | protein_coding | deleterious(0) | probably_damaging(0.996) | TCGA-A7-A4SB-01 | Breast | breast invasive carcinoma | Female | <65 | III/IV | Chemotherapy | docetaxel | CR |
| CABIN1 | SNV | Missense_Mutation | c.1640N>T | p.Ser547Phe | p.S547F | Q9Y6J0 | protein_coding | tolerated(0.07) | possibly_damaging(0.823) | TCGA-AC-A23H-01 | Breast | breast invasive carcinoma | Female | >=65 | I/II | Unknown | Unknown | PD | |
| CABIN1 | SNV | Missense_Mutation | rs200579275 | c.1976G>A | p.Arg659Gln | p.R659Q | Q9Y6J0 | protein_coding | tolerated(0.65) | benign(0) | TCGA-AN-A046-01 | Breast | breast invasive carcinoma | Female | >=65 | I/II | Unknown | Unknown | SD |
| CABIN1 | SNV | Missense_Mutation | novel | c.1598G>C | p.Cys533Ser | p.C533S | Q9Y6J0 | protein_coding | tolerated(0.32) | benign(0.01) | TCGA-AN-A0FX-01 | Breast | breast invasive carcinoma | Female | <65 | I/II | Unknown | Unknown | SD |
| CABIN1 | SNV | Missense_Mutation | c.2531C>T | p.Ser844Leu | p.S844L | Q9Y6J0 | protein_coding | deleterious(0) | benign(0.09) | TCGA-AO-A03V-01 | Breast | breast invasive carcinoma | Female | <65 | I/II | Chemotherapy | fluorouracil | SD | |
| CABIN1 | SNV | Missense_Mutation | rs755174243 | c.656N>A | p.Cys219Tyr | p.C219Y | Q9Y6J0 | protein_coding | tolerated(0.06) | benign(0.358) | TCGA-B6-A0I6-01 | Breast | breast invasive carcinoma | Female | <65 | I/II | Unknown | Unknown | PD |
| CABIN1 | SNV | Missense_Mutation | c.3193N>G | p.His1065Asp | p.H1065D | Q9Y6J0 | protein_coding | deleterious(0) | probably_damaging(0.994) | TCGA-BH-A0DZ-01 | Breast | breast invasive carcinoma | Female | <65 | I/II | Chemotherapy | docetaxel | SD | |
| CABIN1 | SNV | Missense_Mutation | novel | c.5326A>G | p.Thr1776Ala | p.T1776A | Q9Y6J0 | protein_coding | tolerated_low_confidence(0.41) | benign(0) | TCGA-D8-A1XK-01 | Breast | breast invasive carcinoma | Female | <65 | I/II | Chemotherapy | doxorubicine+cyclophosphamide | SD |
| Page: 1 2 3 4 5 6 7 8 9 10 11 12 13 14 15 16 17 18 |
Top |
Related drugs of malignant transformation related genes |
| Identification of chemicals and drugs interact with genes involved in malignant transfromation |
| (DGIdb 4.0) |
| Entrez ID | Symbol | Category | Interaction Types | Drug Claim Name | Drug Name | PMIDs |
| Page: 1 |

Copyright 2023-Present -The University of Texas Health Science Center at Houston |